Cities with the Highest Percentage of Asian Population in Colorado
RELATED REPORTS & OPTIONS
Asian
Colorado
Compare Cities
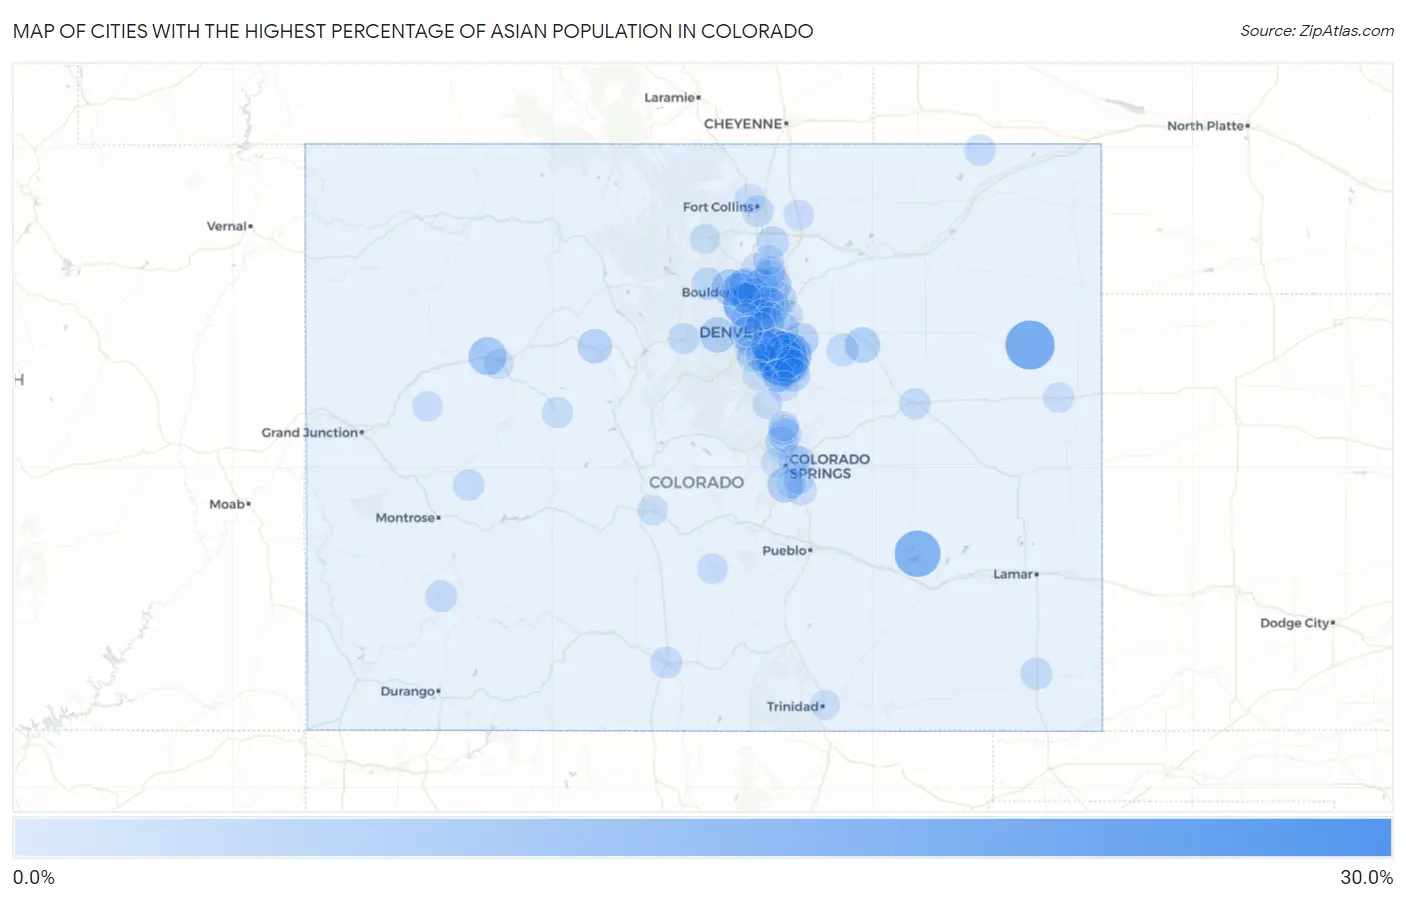
Map of Cities with the Highest Percentage of Asian Population in Colorado
0.0%
30.0%
Cities with the Highest Percentage of Asian Population in Colorado
| City | Asian | vs State | vs National | |
| 1. | Sierra Ridge | 29.2% | 3.2%(+26.0)#1 | 5.8%(+23.4)#294 |
| 2. | Meridian | 20.1% | 3.2%(+16.9)#2 | 5.8%(+14.4)#527 |
| 3. | Inverness | 20.0% | 3.2%(+16.8)#3 | 5.8%(+14.2)#534 |
| 4. | Joes | 19.8% | 3.2%(+16.6)#4 | 5.8%(+14.1)#539 |
| 5. | Sugar City | 17.0% | 3.2%(+13.8)#5 | 5.8%(+11.2)#699 |
| 6. | Superior | 16.8% | 3.2%(+13.6)#6 | 5.8%(+11.0)#713 |
| 7. | Foxfield | 14.0% | 3.2%(+10.8)#7 | 5.8%(+8.19)#900 |
| 8. | Greenwood Village | 13.7% | 3.2%(+10.5)#8 | 5.8%(+7.94)#930 |
| 9. | Cherry Creek | 11.2% | 3.2%(+8.03)#9 | 5.8%(+5.47)#1,234 |
| 10. | Stepping Stone | 10.7% | 3.2%(+7.45)#10 | 5.8%(+4.89)#1,318 |
| 11. | Lone Tree | 10.0% | 3.2%(+6.81)#11 | 5.8%(+4.25)#1,411 |
| 12. | Chacra | 9.1% | 3.2%(+5.90)#12 | 5.8%(+3.34)#1,576 |
| 13. | Valmont | 8.6% | 3.2%(+5.43)#13 | 5.8%(+2.87)#1,672 |
| 14. | Sterling Ranch | 8.6% | 3.2%(+5.42)#14 | 5.8%(+2.86)#1,673 |
| 15. | Acres Green | 8.1% | 3.2%(+4.93)#15 | 5.8%(+2.37)#1,776 |
| 16. | Pine Brook Hill | 7.5% | 3.2%(+4.27)#16 | 5.8%(+1.71)#1,940 |
| 17. | Broomfield | 7.0% | 3.2%(+3.76)#17 | 5.8%(+1.20)#2,102 |
| 18. | Floyd Hill | 6.8% | 3.2%(+3.56)#18 | 5.8%(+1.00)#2,175 |
| 19. | Peoria | 6.8% | 3.2%(+3.54)#19 | 5.8%(+0.984)#2,177 |
| 20. | Dacono | 6.5% | 3.2%(+3.27)#20 | 5.8%(+0.713)#2,272 |
| 21. | Rock Creek Park | 6.4% | 3.2%(+3.17)#21 | 5.8%(+0.610)#2,314 |
| 22. | Centennial | 6.3% | 3.2%(+3.13)#22 | 5.8%(+0.571)#2,327 |
| 23. | Highlands Ranch | 6.1% | 3.2%(+2.94)#23 | 5.8%(+0.376)#2,405 |
| 24. | Aurora | 6.0% | 3.2%(+2.79)#24 | 5.8%(+0.233)#2,468 |
| 25. | Erie | 6.0% | 3.2%(+2.75)#25 | 5.8%(+0.195)#2,483 |
| 26. | Boulder | 5.9% | 3.2%(+2.70)#26 | 5.8%(+0.143)#2,510 |
| 27. | Avon | 5.8% | 3.2%(+2.58)#27 | 5.8%(+0.016)#2,567 |
| 28. | Thornton | 5.6% | 3.2%(+2.43)#28 | 5.8%(-0.126)#2,635 |
| 29. | Dove Valley | 5.6% | 3.2%(+2.35)#29 | 5.8%(-0.206)#2,683 |
| 30. | Four Square Mile | 5.3% | 3.2%(+2.12)#30 | 5.8%(-0.436)#2,817 |
| 31. | Parker | 5.2% | 3.2%(+2.02)#31 | 5.8%(-0.539)#2,865 |
| 32. | Westminster | 4.9% | 3.2%(+1.74)#32 | 5.8%(-0.823)#3,014 |
| 33. | Gleneagle | 4.5% | 3.2%(+1.29)#33 | 5.8%(-1.27)#3,303 |
| 34. | Castle Pines | 4.5% | 3.2%(+1.27)#34 | 5.8%(-1.29)#3,321 |
| 35. | West Pleasant View | 4.4% | 3.2%(+1.19)#35 | 5.8%(-1.37)#3,370 |
| 36. | Todd Creek | 4.4% | 3.2%(+1.18)#36 | 5.8%(-1.38)#3,379 |
| 37. | Frederick | 4.3% | 3.2%(+1.11)#37 | 5.8%(-1.45)#3,422 |
| 38. | Louisville | 4.3% | 3.2%(+1.11)#38 | 5.8%(-1.45)#3,423 |
| 39. | The Pinery | 4.3% | 3.2%(+1.11)#39 | 5.8%(-1.45)#3,427 |
| 40. | Ward | 4.3% | 3.2%(+1.04)#40 | 5.8%(-1.52)#3,495 |
| 41. | Lakewood | 4.1% | 3.2%(+0.844)#41 | 5.8%(-1.71)#3,650 |
| 42. | Air Force Academy | 4.0% | 3.2%(+0.778)#42 | 5.8%(-1.78)#3,702 |
| 43. | Johnstown | 3.9% | 3.2%(+0.677)#43 | 5.8%(-1.88)#3,792 |
| 44. | Comanche Creek | 3.8% | 3.2%(+0.560)#44 | 5.8%(-2.00)#3,881 |
| 45. | Springfield | 3.7% | 3.2%(+0.471)#45 | 5.8%(-2.09)#3,961 |
| 46. | Gunbarrel | 3.6% | 3.2%(+0.378)#46 | 5.8%(-2.18)#4,051 |
| 47. | Denver | 3.6% | 3.2%(+0.367)#47 | 5.8%(-2.19)#4,061 |
| 48. | Mountain Village | 3.5% | 3.2%(+0.327)#48 | 5.8%(-2.23)#4,104 |
| 49. | Castle Pines Village | 3.5% | 3.2%(+0.283)#49 | 5.8%(-2.28)#4,143 |
| 50. | Fort Collins | 3.4% | 3.2%(+0.179)#50 | 5.8%(-2.38)#4,258 |
| 51. | Alamosa | 3.3% | 3.2%(+0.126)#51 | 5.8%(-2.43)#4,317 |
| 52. | Northglenn | 3.3% | 3.2%(+0.120)#52 | 5.8%(-2.44)#4,323 |
| 53. | Lafayette | 3.3% | 3.2%(+0.098)#53 | 5.8%(-2.46)#4,349 |
| 54. | Federal Heights | 3.2% | 3.2%(-0.059)#54 | 5.8%(-2.62)#4,541 |
| 55. | Colorado Springs | 3.1% | 3.2%(-0.074)#55 | 5.8%(-2.63)#4,555 |
| 56. | Sheridan | 3.1% | 3.2%(-0.145)#56 | 5.8%(-2.70)#4,646 |
| 57. | Crawford | 3.1% | 3.2%(-0.163)#57 | 5.8%(-2.72)#4,674 |
| 58. | Peetz | 3.0% | 3.2%(-0.183)#58 | 5.8%(-2.74)#4,702 |
| 59. | Berkley | 3.0% | 3.2%(-0.209)#59 | 5.8%(-2.77)#4,737 |
| 60. | Silver Plume | 3.0% | 3.2%(-0.258)#60 | 5.8%(-2.82)#4,796 |
| 61. | Limon | 2.9% | 3.2%(-0.306)#61 | 5.8%(-2.87)#4,855 |
| 62. | Dakota Ridge | 2.9% | 3.2%(-0.348)#62 | 5.8%(-2.91)#4,917 |
| 63. | Longmont | 2.8% | 3.2%(-0.374)#63 | 5.8%(-2.93)#4,958 |
| 64. | Stonegate | 2.8% | 3.2%(-0.399)#64 | 5.8%(-2.96)#4,990 |
| 65. | Welby | 2.8% | 3.2%(-0.401)#65 | 5.8%(-2.96)#4,995 |
| 66. | Aspen | 2.8% | 3.2%(-0.408)#66 | 5.8%(-2.97)#5,006 |
| 67. | Firestone | 2.8% | 3.2%(-0.430)#67 | 5.8%(-2.99)#5,045 |
| 68. | Ken Caryl | 2.8% | 3.2%(-0.461)#68 | 5.8%(-3.02)#5,087 |
| 69. | Shaw Heights | 2.7% | 3.2%(-0.465)#69 | 5.8%(-3.02)#5,091 |
| 70. | Monument | 2.6% | 3.2%(-0.606)#70 | 5.8%(-3.17)#5,290 |
| 71. | Littleton | 2.6% | 3.2%(-0.613)#71 | 5.8%(-3.17)#5,302 |
| 72. | North Washington | 2.6% | 3.2%(-0.627)#72 | 5.8%(-3.19)#5,321 |
| 73. | Westcliffe | 2.5% | 3.2%(-0.730)#73 | 5.8%(-3.29)#5,458 |
| 74. | Paragon Estates | 2.5% | 3.2%(-0.763)#74 | 5.8%(-3.32)#5,504 |
| 75. | Fountain | 2.4% | 3.2%(-0.779)#75 | 5.8%(-3.34)#5,533 |
| 76. | Arvada | 2.4% | 3.2%(-0.845)#76 | 5.8%(-3.40)#5,648 |
| 77. | Mountain View | 2.3% | 3.2%(-0.867)#77 | 5.8%(-3.43)#5,685 |
| 78. | Commerce City | 2.3% | 3.2%(-0.868)#78 | 5.8%(-3.43)#5,686 |
| 79. | Security Widefield | 2.3% | 3.2%(-0.879)#79 | 5.8%(-3.44)#5,712 |
| 80. | Bethune | 2.3% | 3.2%(-0.909)#80 | 5.8%(-3.47)#5,766 |
| 81. | Holly Hills | 2.2% | 3.2%(-0.964)#81 | 5.8%(-3.52)#5,866 |
| 82. | Mead | 2.2% | 3.2%(-0.982)#82 | 5.8%(-3.54)#5,900 |
| 83. | Castle Rock | 2.2% | 3.2%(-1.02)#83 | 5.8%(-3.58)#5,973 |
| 84. | Cimarron Hills | 2.2% | 3.2%(-1.04)#84 | 5.8%(-3.60)#6,007 |
| 85. | Cope | 2.2% | 3.2%(-1.04)#85 | 5.8%(-3.60)#6,011 |
| 86. | Collbran | 2.2% | 3.2%(-1.05)#86 | 5.8%(-3.61)#6,034 |
| 87. | Salida | 2.1% | 3.2%(-1.07)#87 | 5.8%(-3.63)#6,076 |
| 88. | Englewood | 2.1% | 3.2%(-1.10)#88 | 5.8%(-3.66)#6,146 |
| 89. | Perry Park | 2.1% | 3.2%(-1.11)#89 | 5.8%(-3.67)#6,168 |
| 90. | Woodmoor | 2.1% | 3.2%(-1.12)#90 | 5.8%(-3.68)#6,203 |
| 91. | Eaton | 2.1% | 3.2%(-1.15)#91 | 5.8%(-3.71)#6,251 |
| 92. | Applewood | 2.1% | 3.2%(-1.16)#92 | 5.8%(-3.72)#6,266 |
| 93. | Glenwood Springs | 2.0% | 3.2%(-1.21)#93 | 5.8%(-3.77)#6,376 |
| 94. | Upper Witter Gulch | 2.0% | 3.2%(-1.25)#94 | 5.8%(-3.81)#6,461 |
| 95. | Manitou Springs | 1.9% | 3.2%(-1.29)#95 | 5.8%(-3.85)#6,552 |
| 96. | Roxborough Park | 1.9% | 3.2%(-1.31)#96 | 5.8%(-3.87)#6,596 |
| 97. | Laporte | 1.9% | 3.2%(-1.33)#97 | 5.8%(-3.89)#6,633 |
| 98. | Trinidad | 1.9% | 3.2%(-1.35)#98 | 5.8%(-3.91)#6,687 |
| 99. | Estes Park | 1.8% | 3.2%(-1.45)#99 | 5.8%(-4.01)#6,917 |
| 100. | Fort Carson | 1.8% | 3.2%(-1.46)#100 | 5.8%(-4.02)#6,921 |
Common Questions
What are the Top 10 Cities with the Highest Percentage of Asian Population in Colorado?
Top 10 Cities with the Highest Percentage of Asian Population in Colorado are:
#1
20.1%
#2
20.0%
#3
19.8%
#4
17.0%
#5
16.8%
#6
14.0%
#7
13.7%
#8
11.2%
#9
10.0%
#10
9.1%
What city has the Highest Percentage of Asian Population in Colorado?
Meridian has the Highest Percentage of Asian Population in Colorado with 20.1%.
What is the Percentage of Asian Population in the State of Colorado?
Percentage of Asian Population in Colorado is 3.2%.
What is the Percentage of Asian Population in the United States?
Percentage of Asian Population in the United States is 5.8%.