Leonia borough, NJ Map & Demographics
Leonia borough Overview
$62,031
PER CAPITA INCOME
$128,571
AVG FAMILY INCOME
$110,679
AVG HOUSEHOLD INCOME
13.7%
WAGE / INCOME GAP [ % ]
86.3¢/ $1
WAGE / INCOME GAP [ $ ]
0.48
INEQUALITY / GINI INDEX
9,273
TOTAL POPULATION
4,516
MALE POPULATION
4,757
FEMALE POPULATION
94.93
MALES / 100 FEMALES
105.34
FEMALES / 100 MALES
45.4
MEDIAN AGE
3.2
AVG FAMILY SIZE
2.7
AVG HOUSEHOLD SIZE
5,063
LABOR FORCE [ PEOPLE ]
66.8%
PERCENT IN LABOR FORCE
4.6%
UNEMPLOYMENT RATE
Income in Leonia borough
Income Overview in Leonia borough
Per Capita Income in Leonia borough is $62,031, while median incomes of families and households are $128,571 and $110,679 respectively.
| Characteristic | Number | Measure |
| Per Capita Income | 9,273 | $62,031 |
| Median Family Income | 2,498 | $128,571 |
| Mean Family Income | 2,498 | $188,317 |
| Median Household Income | 3,433 | $110,679 |
| Mean Household Income | 3,433 | $162,933 |
| Income Deficit | 2,498 | $0 |
| Wage / Income Gap (%) | 9,273 | 13.71% |
| Wage / Income Gap ($) | 9,273 | 86.29¢ per $1 |
| Gini / Inequality Index | 9,273 | 0.48 |
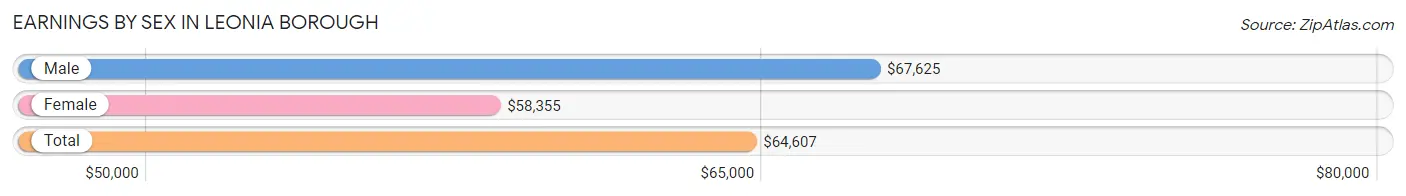
Earnings by Sex in Leonia borough
Average Earnings in Leonia borough are $64,607, $67,625 for men and $58,355 for women, a difference of 13.7%.
| Sex | Number | Average Earnings |
| Male | 2,712 (51.8%) | $67,625 |
| Female | 2,523 (48.2%) | $58,355 |
| Total | 5,235 (100.0%) | $64,607 |
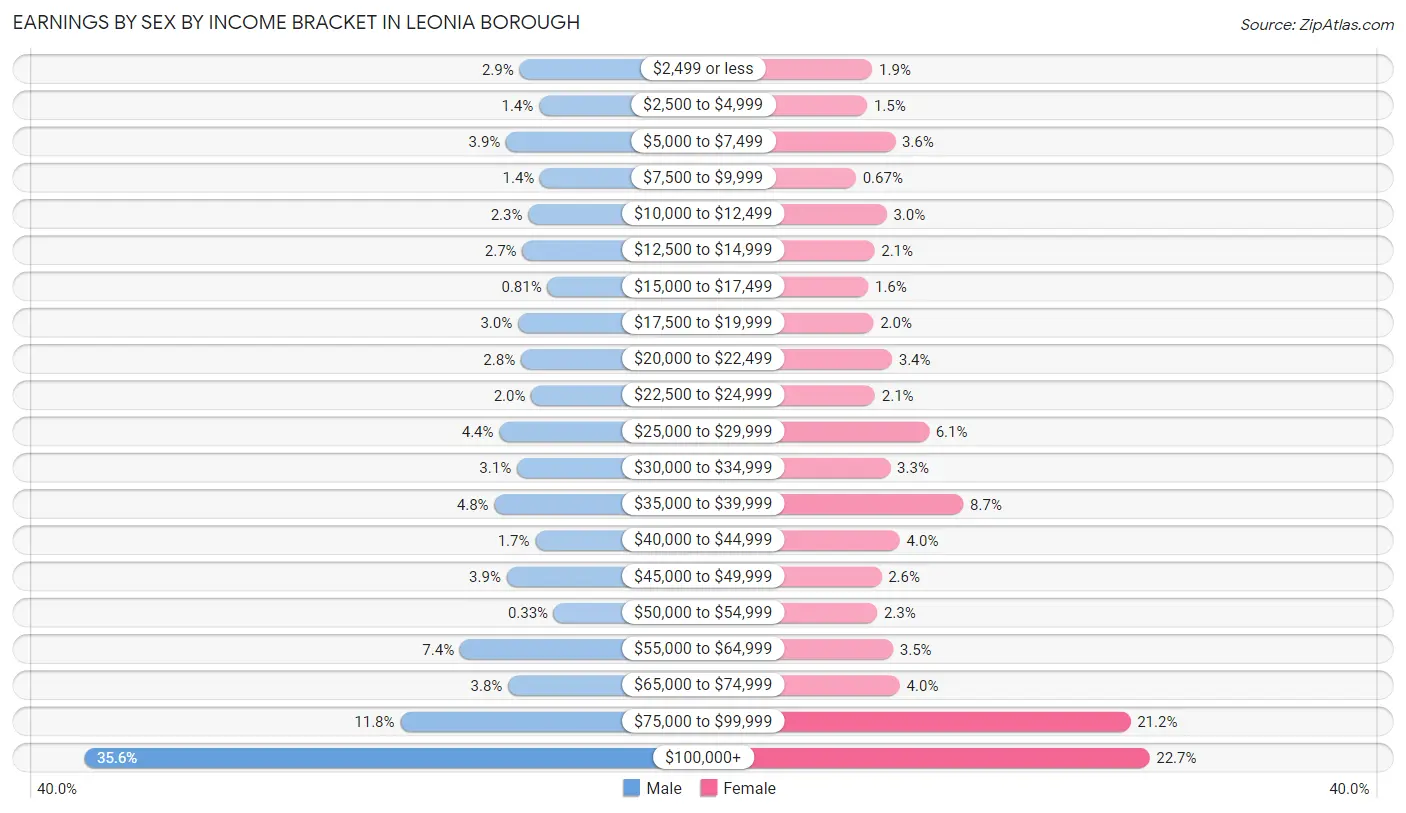
Earnings by Sex by Income Bracket in Leonia borough
The most common earnings brackets in Leonia borough are $100,000+ for men (964 | 35.5%) and $100,000+ for women (572 | 22.7%).
| Income | Male | Female |
| $2,499 or less | 79 (2.9%) | 48 (1.9%) |
| $2,500 to $4,999 | 39 (1.4%) | 38 (1.5%) |
| $5,000 to $7,499 | 106 (3.9%) | 91 (3.6%) |
| $7,500 to $9,999 | 37 (1.4%) | 17 (0.7%) |
| $10,000 to $12,499 | 61 (2.2%) | 75 (3.0%) |
| $12,500 to $14,999 | 73 (2.7%) | 52 (2.1%) |
| $15,000 to $17,499 | 22 (0.8%) | 40 (1.6%) |
| $17,500 to $19,999 | 82 (3.0%) | 50 (2.0%) |
| $20,000 to $22,499 | 76 (2.8%) | 85 (3.4%) |
| $22,500 to $24,999 | 55 (2.0%) | 53 (2.1%) |
| $25,000 to $29,999 | 120 (4.4%) | 155 (6.1%) |
| $30,000 to $34,999 | 84 (3.1%) | 82 (3.3%) |
| $35,000 to $39,999 | 130 (4.8%) | 220 (8.7%) |
| $40,000 to $44,999 | 47 (1.7%) | 100 (4.0%) |
| $45,000 to $49,999 | 105 (3.9%) | 65 (2.6%) |
| $50,000 to $54,999 | 9 (0.3%) | 57 (2.3%) |
| $55,000 to $64,999 | 200 (7.4%) | 87 (3.5%) |
| $65,000 to $74,999 | 102 (3.8%) | 100 (4.0%) |
| $75,000 to $99,999 | 321 (11.8%) | 536 (21.2%) |
| $100,000+ | 964 (35.5%) | 572 (22.7%) |
| Total | 2,712 (100.0%) | 2,523 (100.0%) |
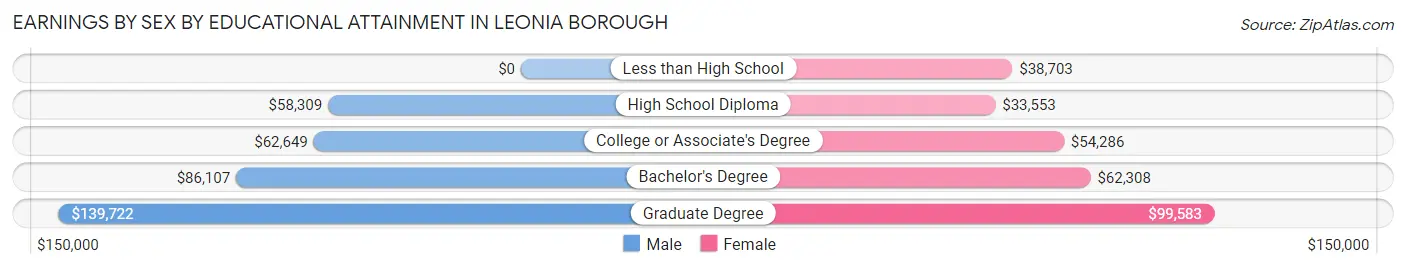
Earnings by Sex by Educational Attainment in Leonia borough
Average earnings in Leonia borough are $80,878 for men and $63,125 for women, a difference of 22.0%. Men with an educational attainment of graduate degree enjoy the highest average annual earnings of $139,722, while those with high school diploma education earn the least with $58,309. Women with an educational attainment of graduate degree earn the most with the average annual earnings of $99,583, while those with high school diploma education have the smallest earnings of $33,553.
| Educational Attainment | Male Income | Female Income |
| Less than High School | - | - |
| High School Diploma | $58,309 | $33,553 |
| College or Associate's Degree | $62,649 | $54,286 |
| Bachelor's Degree | $86,107 | $62,308 |
| Graduate Degree | $139,722 | $99,583 |
| Total | $80,878 | $63,125 |
Family Income in Leonia borough
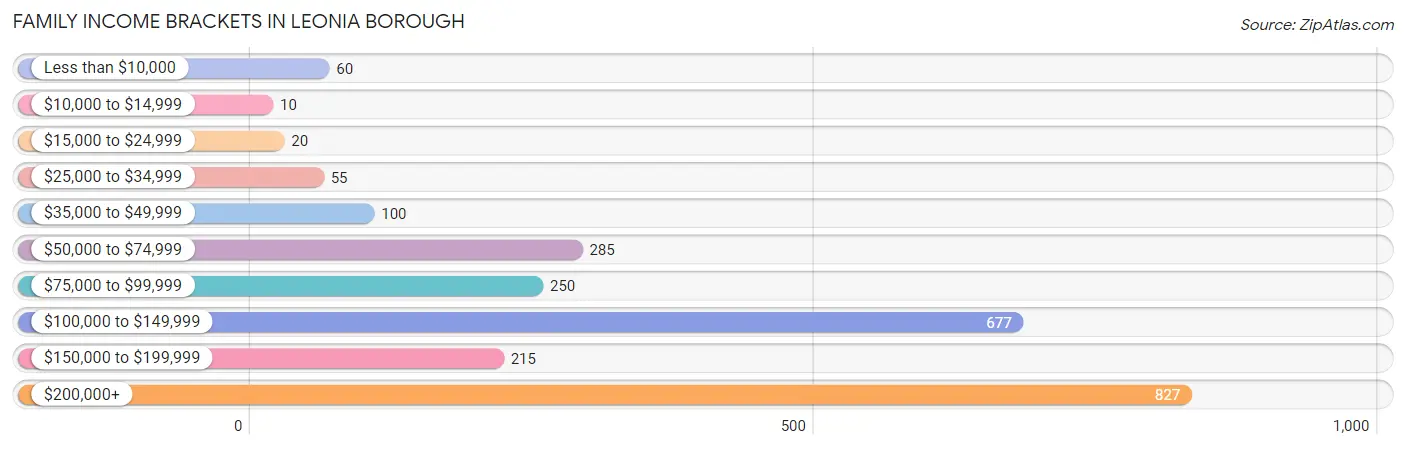
Family Income Brackets in Leonia borough
According to the Leonia borough family income data, there are 827 families falling into the $200,000+ income range, which is the most common income bracket and makes up 33.1% of all families. Conversely, the $10,000 to $14,999 income bracket is the least frequent group with only 10 families (0.4%) belonging to this category.
| Income Bracket | # Families | % Families |
| Less than $10,000 | 60 | 2.4% |
| $10,000 to $14,999 | 10 | 0.4% |
| $15,000 to $24,999 | 20 | 0.8% |
| $25,000 to $34,999 | 55 | 2.2% |
| $35,000 to $49,999 | 100 | 4.0% |
| $50,000 to $74,999 | 285 | 11.4% |
| $75,000 to $99,999 | 250 | 10.0% |
| $100,000 to $149,999 | 677 | 27.1% |
| $150,000 to $199,999 | 215 | 8.6% |
| $200,000+ | 827 | 33.1% |
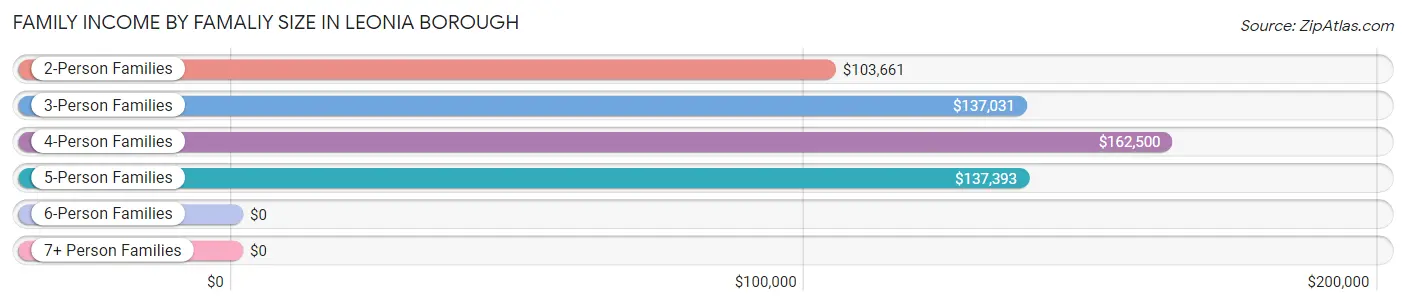
Family Income by Famaliy Size in Leonia borough
4-person families (614 | 24.6%) account for the highest median family income in Leonia borough with $162,500 per family, while 2-person families (891 | 35.7%) have the highest median income of $51,830 per family member.
| Income Bracket | # Families | Median Income |
| 2-Person Families | 891 (35.7%) | $103,661 |
| 3-Person Families | 795 (31.8%) | $137,031 |
| 4-Person Families | 614 (24.6%) | $162,500 |
| 5-Person Families | 181 (7.2%) | $137,393 |
| 6-Person Families | 0 (0.0%) | $0 |
| 7+ Person Families | 17 (0.7%) | $0 |
| Total | 2,498 (100.0%) | $128,571 |
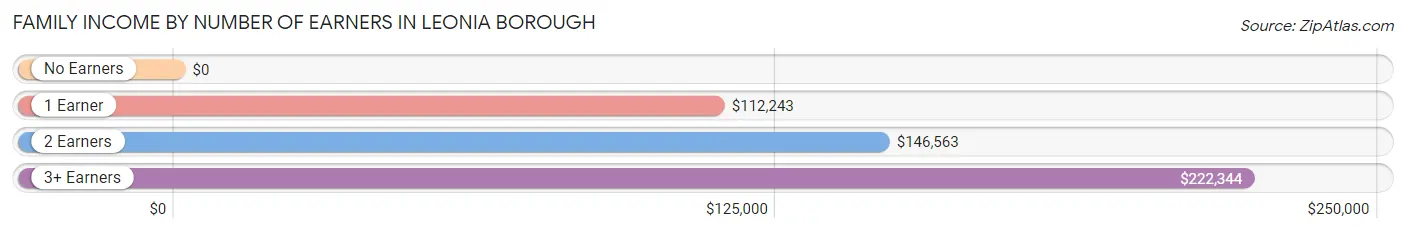
Family Income by Number of Earners in Leonia borough
| Number of Earners | # Families | Median Income |
| No Earners | 262 (10.5%) | $0 |
| 1 Earner | 711 (28.5%) | $112,243 |
| 2 Earners | 1,149 (46.0%) | $146,563 |
| 3+ Earners | 376 (15.0%) | $222,344 |
| Total | 2,498 (100.0%) | $128,571 |
Household Income in Leonia borough
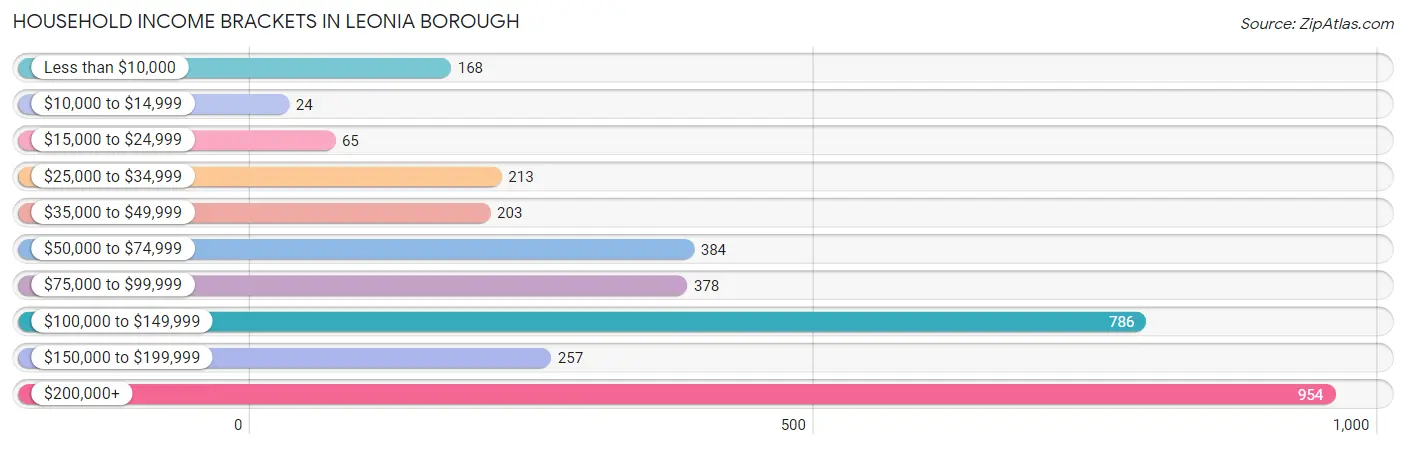
Household Income Brackets in Leonia borough
With 954 households falling in the category, the $200,000+ income range is the most frequent in Leonia borough, accounting for 27.8% of all households. In contrast, only 24 households (0.7%) fall into the $10,000 to $14,999 income bracket, making it the least populous group.
| Income Bracket | # Households | % Households |
| Less than $10,000 | 168 | 4.9% |
| $10,000 to $14,999 | 24 | 0.7% |
| $15,000 to $24,999 | 65 | 1.9% |
| $25,000 to $34,999 | 213 | 6.2% |
| $35,000 to $49,999 | 203 | 5.9% |
| $50,000 to $74,999 | 384 | 11.2% |
| $75,000 to $99,999 | 378 | 11.0% |
| $100,000 to $149,999 | 786 | 22.9% |
| $150,000 to $199,999 | 257 | 7.5% |
| $200,000+ | 954 | 27.8% |
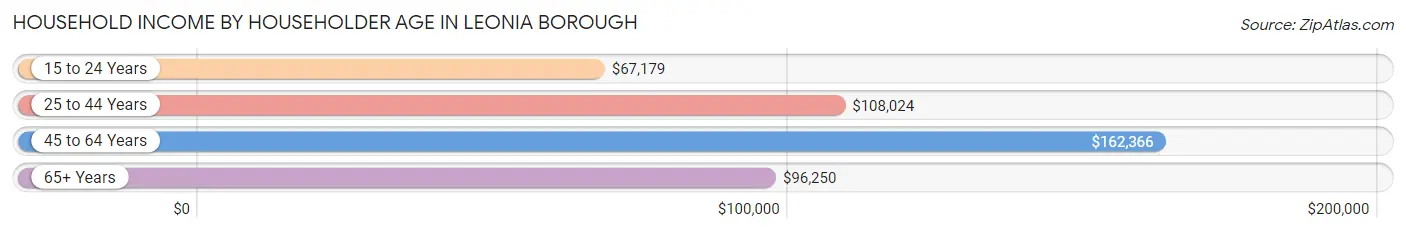
Household Income by Householder Age in Leonia borough
The median household income in Leonia borough is $110,679, with the highest median household income of $162,366 found in the 45 to 64 years age bracket for the primary householder. A total of 1,465 households (42.7%) fall into this category. Meanwhile, the 15 to 24 years age bracket for the primary householder has the lowest median household income of $67,179, with 91 households (2.6%) in this group.
| Income Bracket | # Households | Median Income |
| 15 to 24 Years | 91 (2.6%) | $67,179 |
| 25 to 44 Years | 799 (23.3%) | $108,024 |
| 45 to 64 Years | 1,465 (42.7%) | $162,366 |
| 65+ Years | 1,078 (31.4%) | $96,250 |
| Total | 3,433 (100.0%) | $110,679 |
Poverty in Leonia borough
Income Below Poverty by Sex and Age in Leonia borough
With 4.3% poverty level for males and 4.5% for females among the residents of Leonia borough, 16 and 17 year old males and 15 year old females are the most vulnerable to poverty, with 86 males (32.7%) and 18 females (26.5%) in their respective age groups living below the poverty level.
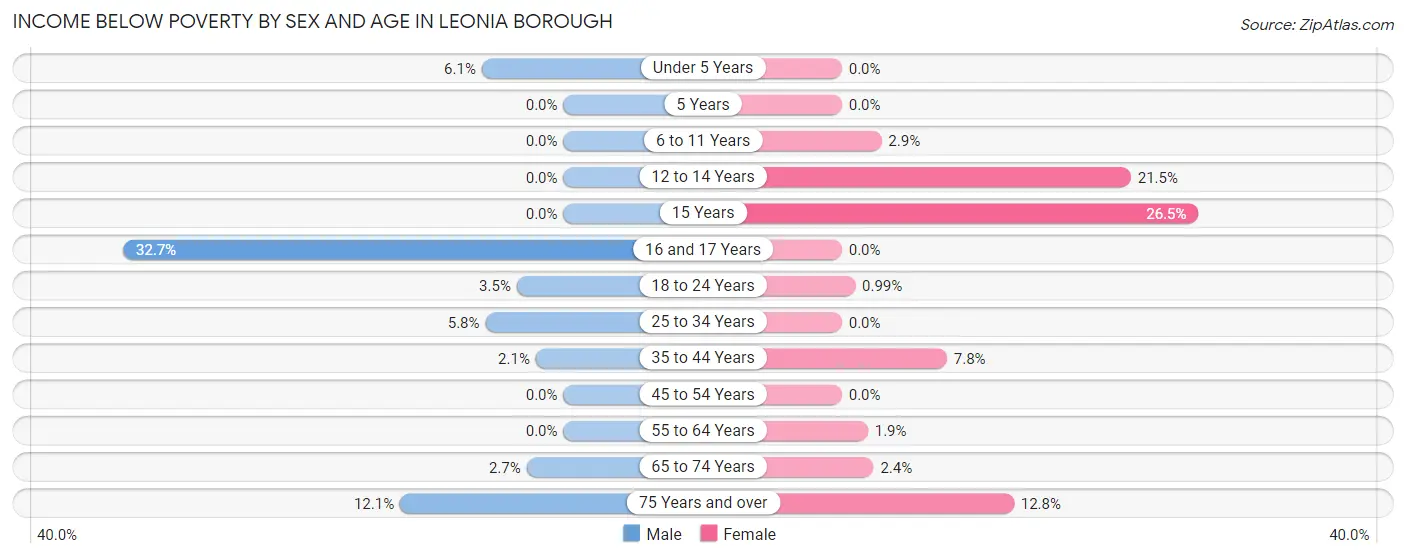
| Age Bracket | Male | Female |
| Under 5 Years | 12 (6.1%) | 0 (0.0%) |
| 5 Years | 0 (0.0%) | 0 (0.0%) |
| 6 to 11 Years | 0 (0.0%) | 9 (2.9%) |
| 12 to 14 Years | 0 (0.0%) | 50 (21.5%) |
| 15 Years | 0 (0.0%) | 18 (26.5%) |
| 16 and 17 Years | 86 (32.7%) | 0 (0.0%) |
| 18 to 24 Years | 15 (3.5%) | 2 (1.0%) |
| 25 to 34 Years | 22 (5.8%) | 0 (0.0%) |
| 35 to 44 Years | 11 (2.1%) | 51 (7.8%) |
| 45 to 54 Years | 0 (0.0%) | 0 (0.0%) |
| 55 to 64 Years | 0 (0.0%) | 18 (1.9%) |
| 65 to 74 Years | 12 (2.7%) | 12 (2.4%) |
| 75 Years and over | 33 (12.1%) | 54 (12.8%) |
| Total | 191 (4.3%) | 214 (4.5%) |
Income Above Poverty by Sex and Age in Leonia borough
According to the poverty statistics in Leonia borough, males aged 5 years and females aged under 5 years are the age groups that are most secure financially, with 100.0% of males and 100.0% of females in these age groups living above the poverty line.
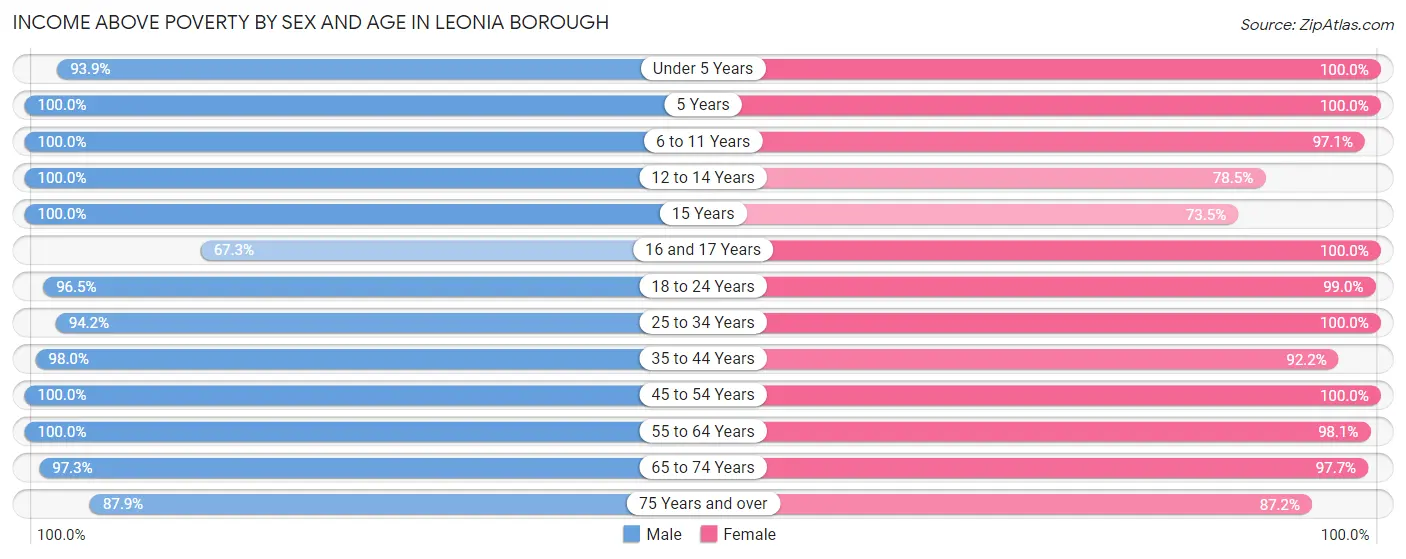
| Age Bracket | Male | Female |
| Under 5 Years | 186 (93.9%) | 341 (100.0%) |
| 5 Years | 67 (100.0%) | 5 (100.0%) |
| 6 to 11 Years | 338 (100.0%) | 297 (97.1%) |
| 12 to 14 Years | 69 (100.0%) | 183 (78.5%) |
| 15 Years | 33 (100.0%) | 50 (73.5%) |
| 16 and 17 Years | 177 (67.3%) | 86 (100.0%) |
| 18 to 24 Years | 419 (96.5%) | 201 (99.0%) |
| 25 to 34 Years | 358 (94.2%) | 354 (100.0%) |
| 35 to 44 Years | 525 (98.0%) | 603 (92.2%) |
| 45 to 54 Years | 708 (100.0%) | 639 (100.0%) |
| 55 to 64 Years | 742 (100.0%) | 916 (98.1%) |
| 65 to 74 Years | 428 (97.3%) | 499 (97.7%) |
| 75 Years and over | 239 (87.9%) | 369 (87.2%) |
| Total | 4,289 (95.7%) | 4,543 (95.5%) |
Income Below Poverty Among Married-Couple Families in Leonia borough
The poverty statistics for married-couple families in Leonia borough show that 0.6% or 12 of the total 2,123 families live below the poverty line. Families with no children have the highest poverty rate of 1.0%, comprising of 12 families. On the other hand, families with 1 or 2 children have the lowest poverty rate of 0.0%, which includes 0 families.
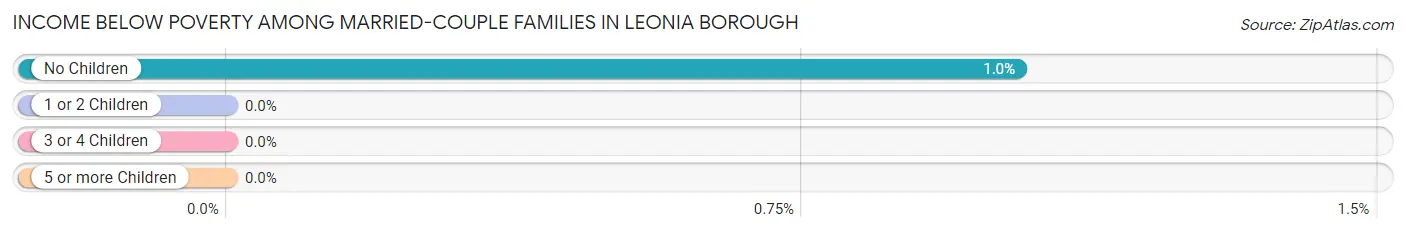
| Children | Above Poverty | Below Poverty |
| No Children | 1,156 (99.0%) | 12 (1.0%) |
| 1 or 2 Children | 906 (100.0%) | 0 (0.0%) |
| 3 or 4 Children | 49 (100.0%) | 0 (0.0%) |
| 5 or more Children | 0 (0.0%) | 0 (0.0%) |
| Total | 2,111 (99.4%) | 12 (0.6%) |
Income Below Poverty Among Single-Parent Households in Leonia borough
According to the poverty data in Leonia borough, 5.7% or 11 single-father households and 26.0% or 47 single-mother households are living below the poverty line. Among single-father households, those with 1 or 2 children have the highest poverty rate, with 11 households (12.5%) experiencing poverty. Likewise, among single-mother households, those with 1 or 2 children have the highest poverty rate, with 47 households (54.0%) falling below the poverty line.
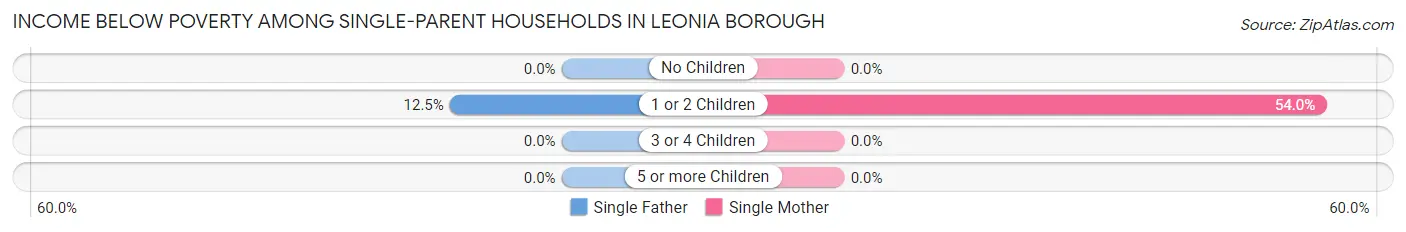
| Children | Single Father | Single Mother |
| No Children | 0 (0.0%) | 0 (0.0%) |
| 1 or 2 Children | 11 (12.5%) | 47 (54.0%) |
| 3 or 4 Children | 0 (0.0%) | 0 (0.0%) |
| 5 or more Children | 0 (0.0%) | 0 (0.0%) |
| Total | 11 (5.7%) | 47 (26.0%) |
Income Below Poverty Among Married-Couple vs Single-Parent Households in Leonia borough
The poverty data for Leonia borough shows that 12 of the married-couple family households (0.6%) and 58 of the single-parent households (15.5%) are living below the poverty level. Within the married-couple family households, those with no children have the highest poverty rate, with 12 households (1.0%) falling below the poverty line. Among the single-parent households, those with 1 or 2 children have the highest poverty rate, with 58 household (33.1%) living below poverty.
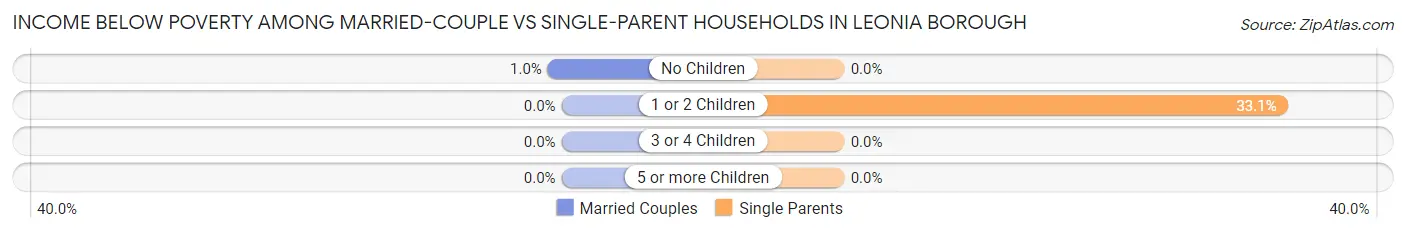
| Children | Married-Couple Families | Single-Parent Households |
| No Children | 12 (1.0%) | 0 (0.0%) |
| 1 or 2 Children | 0 (0.0%) | 58 (33.1%) |
| 3 or 4 Children | 0 (0.0%) | 0 (0.0%) |
| 5 or more Children | 0 (0.0%) | 0 (0.0%) |
| Total | 12 (0.6%) | 58 (15.5%) |
Race in Leonia borough
The most populous races in Leonia borough are White / Caucasian (3,922 | 42.3%), Asian (3,464 | 37.4%), and Hispanic or Latino (2,145 | 23.1%).
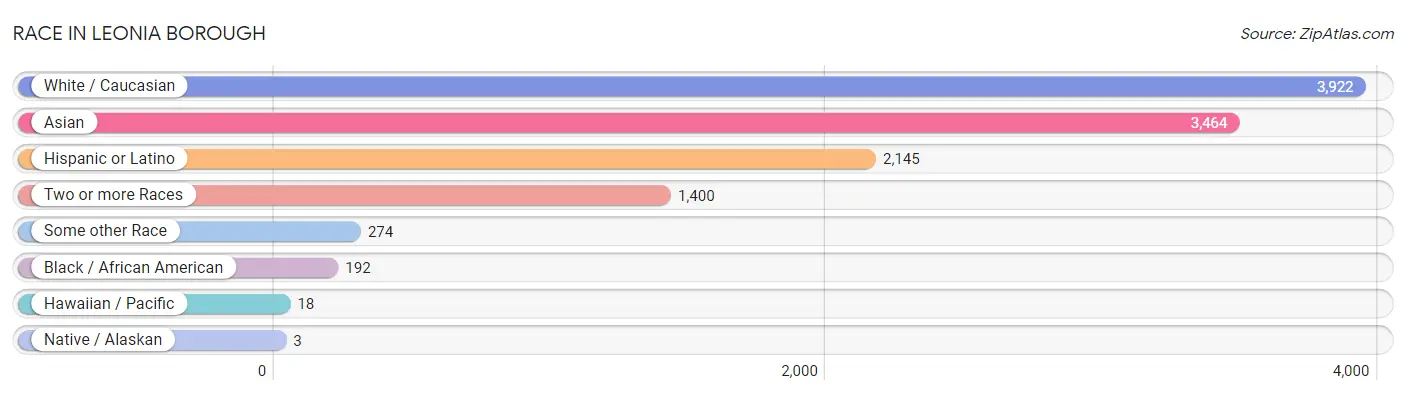
| Race | # Population | % Population |
| Asian | 3,464 | 37.4% |
| Black / African American | 192 | 2.1% |
| Hawaiian / Pacific | 18 | 0.2% |
| Hispanic or Latino | 2,145 | 23.1% |
| Native / Alaskan | 3 | 0.0% |
| White / Caucasian | 3,922 | 42.3% |
| Two or more Races | 1,400 | 15.1% |
| Some other Race | 274 | 2.9% |
| Total | 9,273 | 100.0% |
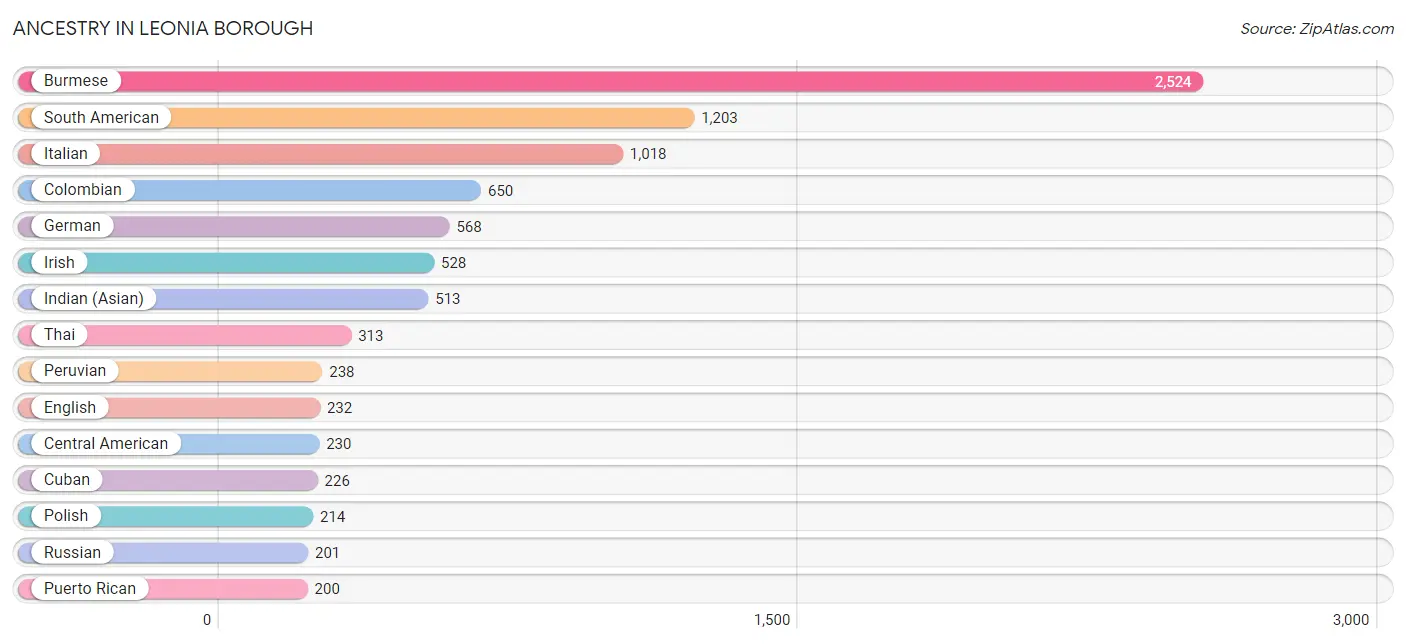
Ancestry in Leonia borough
The most populous ancestries reported in Leonia borough are Burmese (2,524 | 27.2%), South American (1,203 | 13.0%), Italian (1,018 | 11.0%), Colombian (650 | 7.0%), and German (568 | 6.1%), together accounting for 64.3% of all Leonia borough residents.
| Ancestry | # Population | % Population |
| African | 56 | 0.6% |
| American | 168 | 1.8% |
| Arab | 49 | 0.5% |
| Armenian | 174 | 1.9% |
| Austrian | 9 | 0.1% |
| Belgian | 29 | 0.3% |
| Bhutanese | 181 | 1.9% |
| Bolivian | 49 | 0.5% |
| Brazilian | 14 | 0.2% |
| British | 11 | 0.1% |
| Burmese | 2,524 | 27.2% |
| Canadian | 31 | 0.3% |
| Central American | 230 | 2.5% |
| Cherokee | 34 | 0.4% |
| Chilean | 18 | 0.2% |
| Colombian | 650 | 7.0% |
| Costa Rican | 5 | 0.1% |
| Cuban | 226 | 2.4% |
| Cypriot | 17 | 0.2% |
| Czech | 11 | 0.1% |
| Danish | 11 | 0.1% |
| Dominican | 190 | 2.1% |
| Dutch | 31 | 0.3% |
| Eastern European | 46 | 0.5% |
| Ecuadorian | 185 | 2.0% |
| English | 232 | 2.5% |
| European | 37 | 0.4% |
| Filipino | 8 | 0.1% |
| French | 11 | 0.1% |
| French Canadian | 34 | 0.4% |
| German | 568 | 6.1% |
| Greek | 114 | 1.2% |
| Guatemalan | 144 | 1.5% |
| Haitian | 13 | 0.1% |
| Indian (Asian) | 513 | 5.5% |
| Iranian | 5 | 0.1% |
| Irish | 528 | 5.7% |
| Israeli | 28 | 0.3% |
| Italian | 1,018 | 11.0% |
| Jamaican | 35 | 0.4% |
| Korean | 119 | 1.3% |
| Laotian | 37 | 0.4% |
| Lebanese | 9 | 0.1% |
| Lithuanian | 9 | 0.1% |
| Macedonian | 11 | 0.1% |
| Mexican | 85 | 0.9% |
| Nigerian | 26 | 0.3% |
| Norwegian | 48 | 0.5% |
| Palestinian | 8 | 0.1% |
| Peruvian | 238 | 2.6% |
| Polish | 214 | 2.3% |
| Portuguese | 14 | 0.2% |
| Puerto Rican | 200 | 2.2% |
| Romanian | 48 | 0.5% |
| Russian | 201 | 2.2% |
| Salvadoran | 81 | 0.9% |
| Samoan | 18 | 0.2% |
| Scotch-Irish | 18 | 0.2% |
| Scottish | 69 | 0.7% |
| Sioux | 3 | 0.0% |
| Slavic | 7 | 0.1% |
| South African | 23 | 0.3% |
| South American | 1,203 | 13.0% |
| South American Indian | 48 | 0.5% |
| Sri Lankan | 30 | 0.3% |
| Subsaharan African | 105 | 1.1% |
| Swedish | 49 | 0.5% |
| Swiss | 11 | 0.1% |
| Thai | 313 | 3.4% |
| Trinidadian and Tobagonian | 32 | 0.4% |
| Ukrainian | 46 | 0.5% |
| Venezuelan | 63 | 0.7% |
| Welsh | 7 | 0.1% |
| West Indian | 10 | 0.1% | View All 74 Rows |
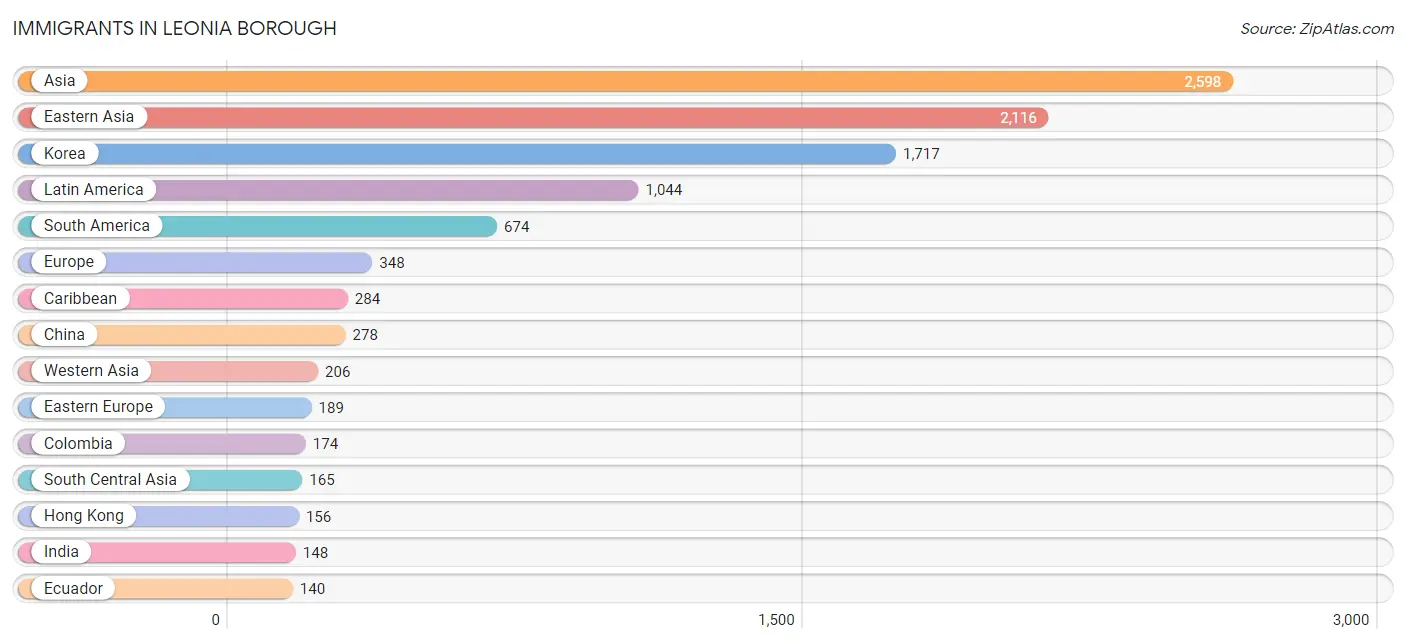
Immigrants in Leonia borough
The most numerous immigrant groups reported in Leonia borough came from Asia (2,598 | 28.0%), Eastern Asia (2,116 | 22.8%), Korea (1,717 | 18.5%), Latin America (1,044 | 11.3%), and South America (674 | 7.3%), together accounting for 87.9% of all Leonia borough residents.
| Immigration Origin | # Population | % Population |
| Africa | 31 | 0.3% |
| Argentina | 7 | 0.1% |
| Armenia | 36 | 0.4% |
| Asia | 2,598 | 28.0% |
| Barbados | 10 | 0.1% |
| Belgium | 12 | 0.1% |
| Bolivia | 101 | 1.1% |
| Brazil | 20 | 0.2% |
| Canada | 30 | 0.3% |
| Caribbean | 284 | 3.1% |
| Central America | 86 | 0.9% |
| Chile | 18 | 0.2% |
| China | 278 | 3.0% |
| Colombia | 174 | 1.9% |
| Costa Rica | 5 | 0.1% |
| Croatia | 41 | 0.4% |
| Cuba | 131 | 1.4% |
| Dominica | 33 | 0.4% |
| Dominican Republic | 78 | 0.8% |
| Eastern Africa | 12 | 0.1% |
| Eastern Asia | 2,116 | 22.8% |
| Eastern Europe | 189 | 2.0% |
| Ecuador | 140 | 1.5% |
| El Salvador | 81 | 0.9% |
| Europe | 348 | 3.7% |
| France | 7 | 0.1% |
| Germany | 15 | 0.2% |
| Guyana | 11 | 0.1% |
| Hong Kong | 156 | 1.7% |
| India | 148 | 1.6% |
| Indonesia | 18 | 0.2% |
| Iran | 5 | 0.1% |
| Iraq | 10 | 0.1% |
| Ireland | 21 | 0.2% |
| Israel | 50 | 0.5% |
| Italy | 17 | 0.2% |
| Japan | 121 | 1.3% |
| Korea | 1,717 | 18.5% |
| Latin America | 1,044 | 11.3% |
| Lebanon | 10 | 0.1% |
| Northern Europe | 108 | 1.2% |
| Pakistan | 12 | 0.1% |
| Peru | 140 | 1.5% |
| Philippines | 21 | 0.2% |
| Poland | 35 | 0.4% |
| Romania | 19 | 0.2% |
| Russia | 59 | 0.6% |
| Singapore | 13 | 0.1% |
| South Africa | 19 | 0.2% |
| South America | 674 | 7.3% |
| South Central Asia | 165 | 1.8% |
| South Eastern Asia | 111 | 1.2% |
| Southern Europe | 17 | 0.2% |
| Sweden | 23 | 0.3% |
| Taiwan | 35 | 0.4% |
| Trinidad and Tobago | 32 | 0.4% |
| Turkey | 71 | 0.8% |
| Ukraine | 35 | 0.4% |
| Venezuela | 63 | 0.7% |
| Vietnam | 59 | 0.6% |
| Western Asia | 206 | 2.2% |
| Western Europe | 34 | 0.4% | View All 62 Rows |
Sex and Age in Leonia borough
Sex and Age in Leonia borough
The most populous age groups in Leonia borough are 15 to 19 Years (417 | 9.2%) for men and 60 to 64 Years (573 | 12.0%) for women.
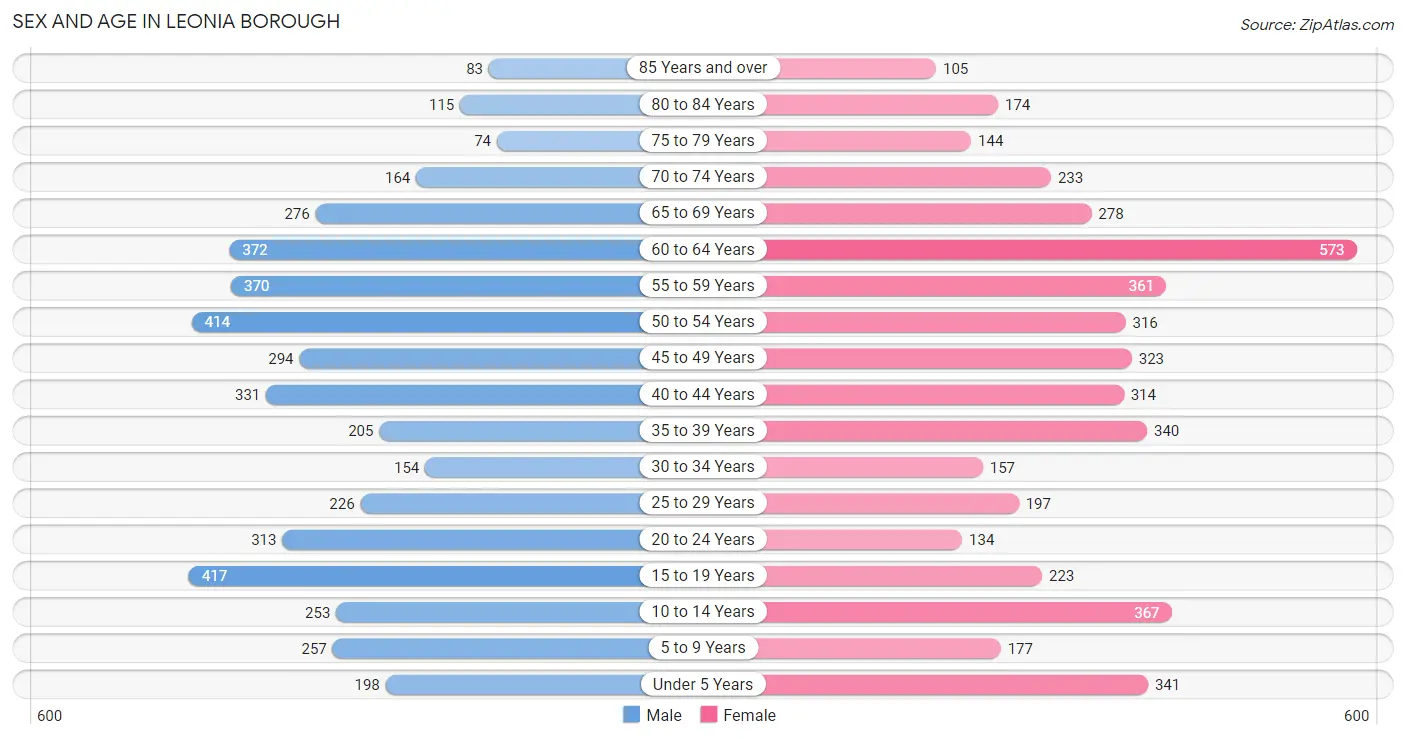
| Age Bracket | Male | Female |
| Under 5 Years | 198 (4.4%) | 341 (7.2%) |
| 5 to 9 Years | 257 (5.7%) | 177 (3.7%) |
| 10 to 14 Years | 253 (5.6%) | 367 (7.7%) |
| 15 to 19 Years | 417 (9.2%) | 223 (4.7%) |
| 20 to 24 Years | 313 (6.9%) | 134 (2.8%) |
| 25 to 29 Years | 226 (5.0%) | 197 (4.1%) |
| 30 to 34 Years | 154 (3.4%) | 157 (3.3%) |
| 35 to 39 Years | 205 (4.5%) | 340 (7.1%) |
| 40 to 44 Years | 331 (7.3%) | 314 (6.6%) |
| 45 to 49 Years | 294 (6.5%) | 323 (6.8%) |
| 50 to 54 Years | 414 (9.2%) | 316 (6.6%) |
| 55 to 59 Years | 370 (8.2%) | 361 (7.6%) |
| 60 to 64 Years | 372 (8.2%) | 573 (12.0%) |
| 65 to 69 Years | 276 (6.1%) | 278 (5.8%) |
| 70 to 74 Years | 164 (3.6%) | 233 (4.9%) |
| 75 to 79 Years | 74 (1.6%) | 144 (3.0%) |
| 80 to 84 Years | 115 (2.5%) | 174 (3.7%) |
| 85 Years and over | 83 (1.8%) | 105 (2.2%) |
| Total | 4,516 (100.0%) | 4,757 (100.0%) |
Families and Households in Leonia borough
Median Family Size in Leonia borough
The median family size in Leonia borough is 3.23 persons per family, with married-couple families (2,123 | 85.0%) accounting for the largest median family size of 3.28 persons per family. On the other hand, single male/father families (194 | 7.8%) represent the smallest median family size with 2.92 persons per family.
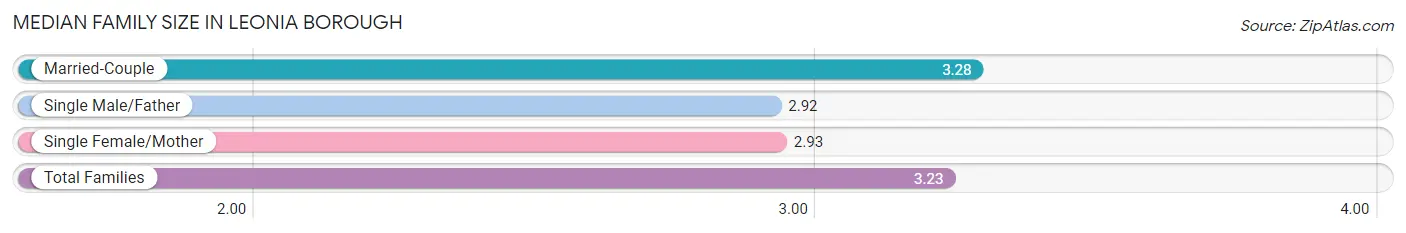
| Family Type | # Families | Family Size |
| Married-Couple | 2,123 (85.0%) | 3.28 |
| Single Male/Father | 194 (7.8%) | 2.92 |
| Single Female/Mother | 181 (7.2%) | 2.93 |
| Total Families | 2,498 (100.0%) | 3.23 |
Median Household Size in Leonia borough
The median household size in Leonia borough is 2.70 persons per household, with single female/mother households (181 | 5.3%) accounting for the largest median household size of 3.34 persons per household. non-family households (935 | 27.2%) represent the smallest median household size with 1.18 persons per household.
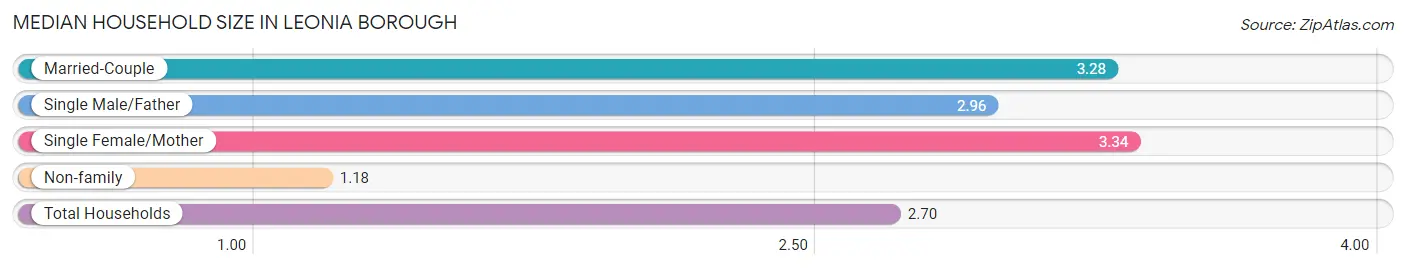
| Household Type | # Households | Household Size |
| Married-Couple | 2,123 (61.8%) | 3.28 |
| Single Male/Father | 194 (5.7%) | 2.96 |
| Single Female/Mother | 181 (5.3%) | 3.34 |
| Non-family | 935 (27.2%) | 1.18 |
| Total Households | 3,433 (100.0%) | 2.70 |
Household Size by Marriage Status in Leonia borough
Out of a total of 3,433 households in Leonia borough, 2,498 (72.8%) are family households, while 935 (27.2%) are nonfamily households. The most numerous type of family households are 2-person households, comprising 863, and the most common type of nonfamily households are 1-person households, comprising 811.
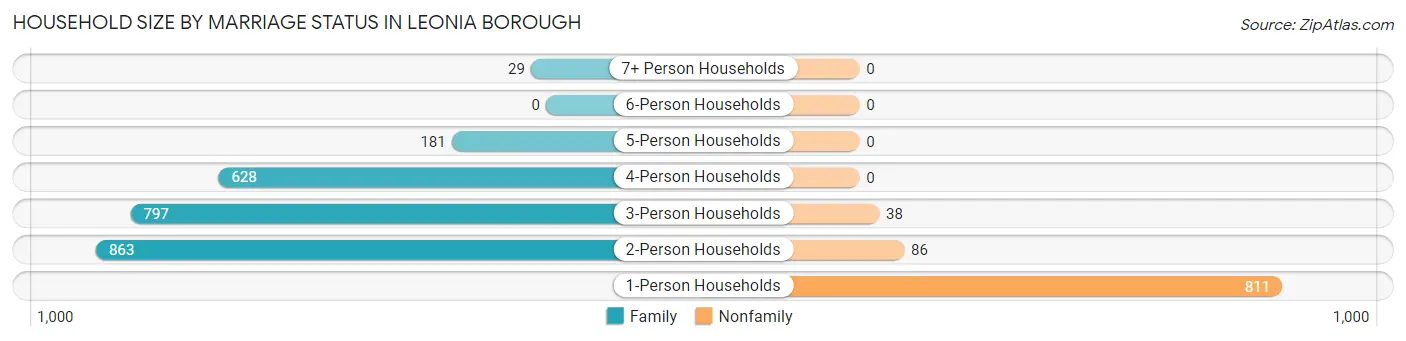
| Household Size | Family Households | Nonfamily Households |
| 1-Person Households | - | 811 (23.6%) |
| 2-Person Households | 863 (25.1%) | 86 (2.5%) |
| 3-Person Households | 797 (23.2%) | 38 (1.1%) |
| 4-Person Households | 628 (18.3%) | 0 (0.0%) |
| 5-Person Households | 181 (5.3%) | 0 (0.0%) |
| 6-Person Households | 0 (0.0%) | 0 (0.0%) |
| 7+ Person Households | 29 (0.8%) | 0 (0.0%) |
| Total | 2,498 (72.8%) | 935 (27.2%) |
Female Fertility in Leonia borough
Fertility by Age in Leonia borough
Average fertility rate in Leonia borough is 33.0 births per 1,000 women. Women in the age bracket of 15 to 19 years have the highest fertility rate with 54.0 births per 1,000 women. Women in the age bracket of 35 to 50 years acount for 63.2% of all women with births.
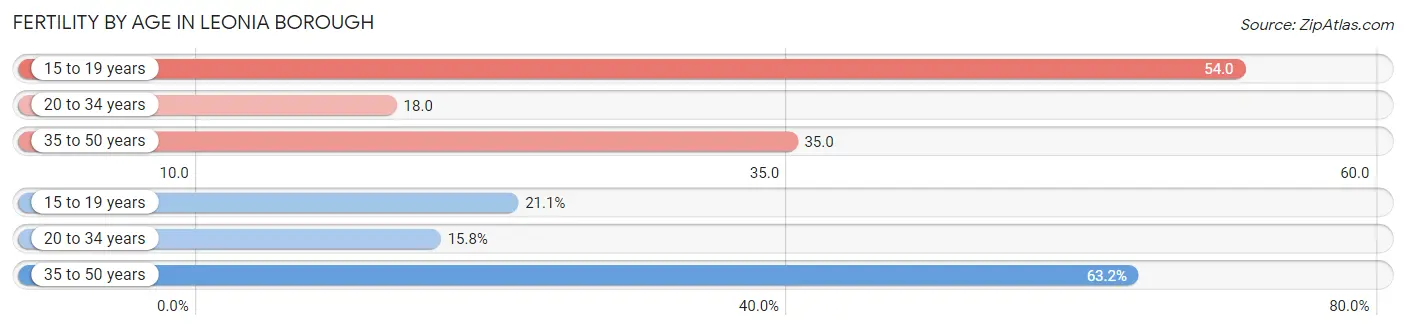
| Age Bracket | Women with Births | Births / 1,000 Women |
| 15 to 19 years | 12 (21.0%) | 54.0 |
| 20 to 34 years | 9 (15.8%) | 18.0 |
| 35 to 50 years | 36 (63.2%) | 35.0 |
| Total | 57 (100.0%) | 33.0 |
Fertility by Age by Marriage Status in Leonia borough
78.9% of women with births (57) in Leonia borough are married. The highest percentage of unmarried women with births falls into 15 to 19 years age bracket with 100.0% of them unmarried at the time of birth, while the lowest percentage of unmarried women with births belong to 20 to 34 years age bracket with 0.0% of them unmarried.
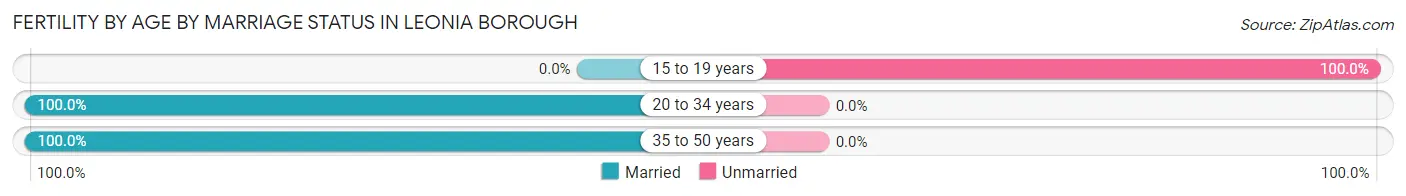
| Age Bracket | Married | Unmarried |
| 15 to 19 years | 0 (0.0%) | 12 (100.0%) |
| 20 to 34 years | 9 (100.0%) | 0 (0.0%) |
| 35 to 50 years | 36 (100.0%) | 0 (0.0%) |
| Total | 45 (78.9%) | 12 (21.0%) |
Fertility by Education in Leonia borough
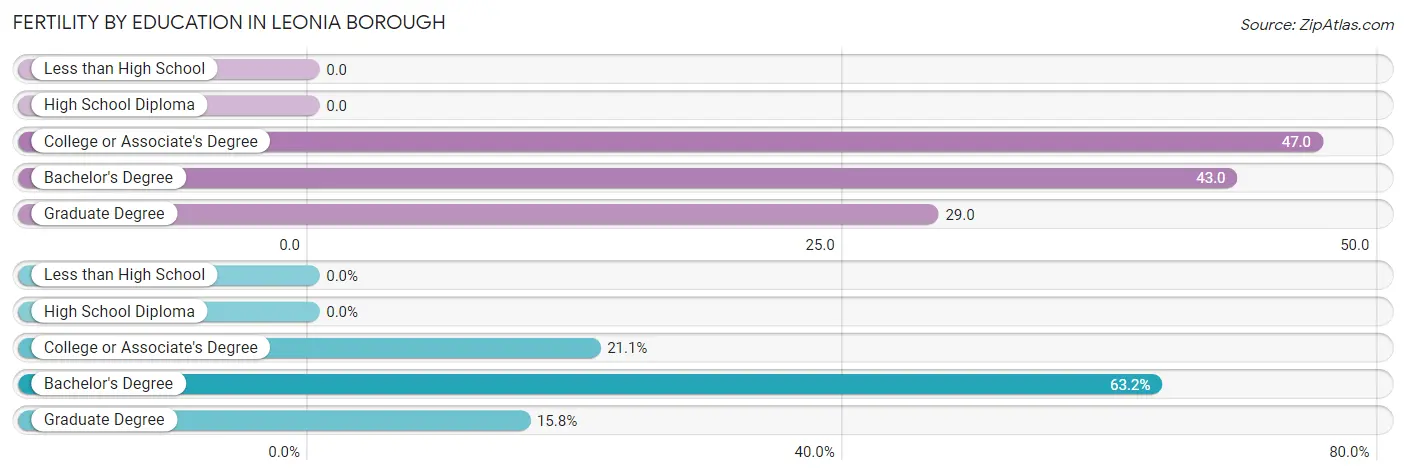
| Educational Attainment | Women with Births | Births / 1,000 Women |
| Less than High School | 0 (0.0%) | 0.0 |
| High School Diploma | 0 (0.0%) | 0.0 |
| College or Associate's Degree | 12 (21.0%) | 47.0 |
| Bachelor's Degree | 36 (63.2%) | 43.0 |
| Graduate Degree | 9 (15.8%) | 29.0 |
| Total | 57 (100.0%) | 33.0 |
Fertility by Education by Marriage Status in Leonia borough
21.0% of women with births in Leonia borough are unmarried. Women with the educational attainment of bachelor's degree are most likely to be married with 100.0% of them married at childbirth, while women with the educational attainment of college or associate's degree are least likely to be married with 100.0% of them unmarried at childbirth.
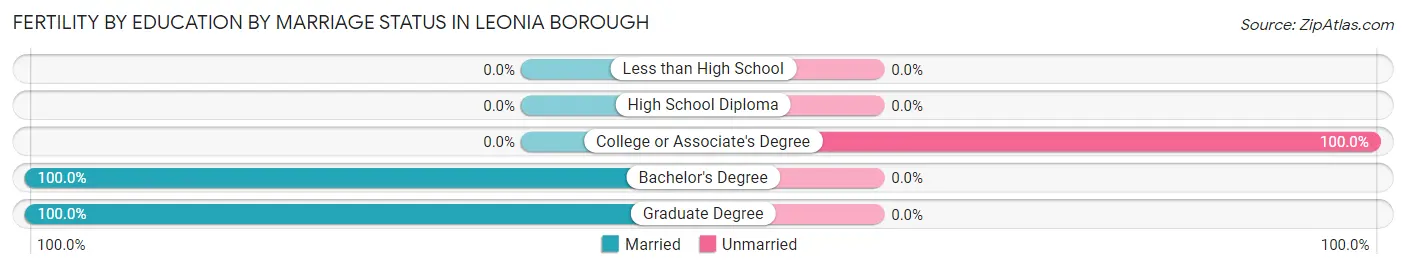
| Educational Attainment | Married | Unmarried |
| Less than High School | 0 (0.0%) | 0 (0.0%) |
| High School Diploma | 0 (0.0%) | 0 (0.0%) |
| College or Associate's Degree | 0 (0.0%) | 12 (100.0%) |
| Bachelor's Degree | 36 (100.0%) | 0 (0.0%) |
| Graduate Degree | 9 (100.0%) | 0 (0.0%) |
| Total | 45 (78.9%) | 12 (21.0%) |
Employment Characteristics in Leonia borough
Employment by Class of Employer in Leonia borough
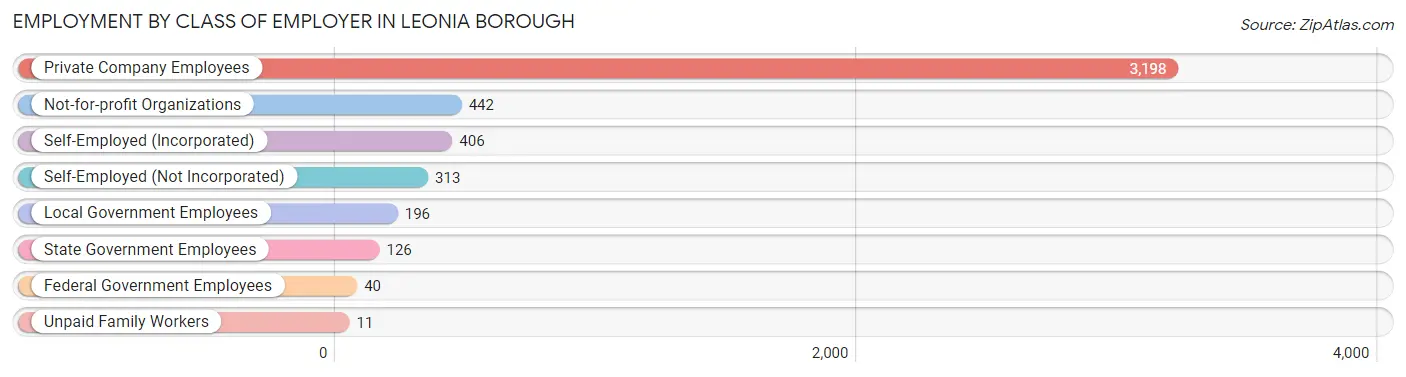
Among the 4,732 employed individuals in Leonia borough, private company employees (3,198 | 67.6%), not-for-profit organizations (442 | 9.3%), and self-employed (incorporated) (406 | 8.6%) make up the most common classes of employment.
| Employer Class | # Employees | % Employees |
| Private Company Employees | 3,198 | 67.6% |
| Self-Employed (Incorporated) | 406 | 8.6% |
| Self-Employed (Not Incorporated) | 313 | 6.6% |
| Not-for-profit Organizations | 442 | 9.3% |
| Local Government Employees | 196 | 4.1% |
| State Government Employees | 126 | 2.7% |
| Federal Government Employees | 40 | 0.9% |
| Unpaid Family Workers | 11 | 0.2% |
| Total | 4,732 | 100.0% |
Employment Status by Age in Leonia borough
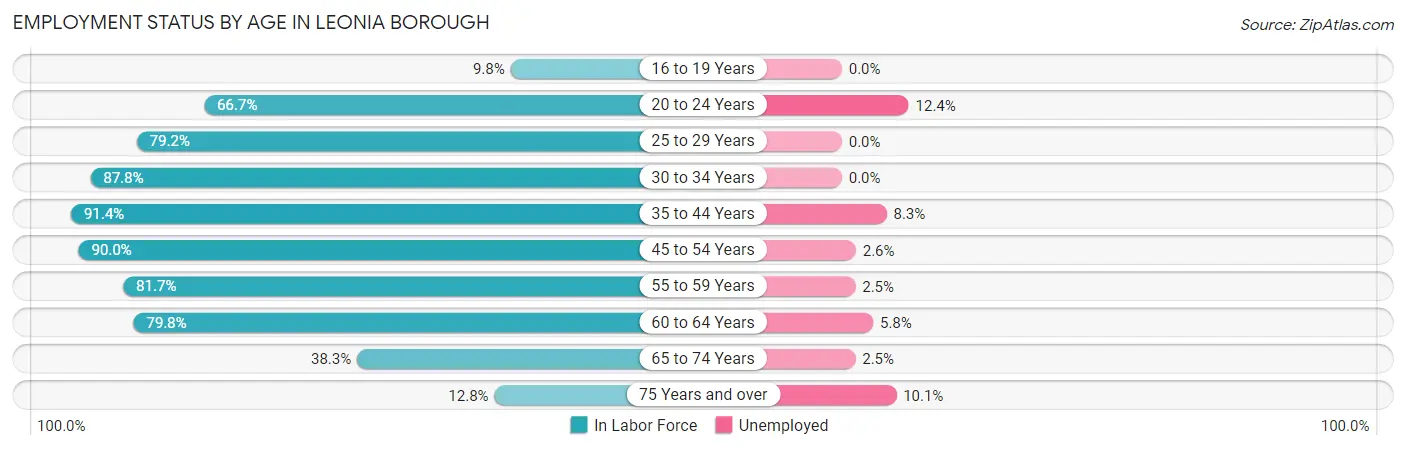
According to the labor force statistics for Leonia borough, out of the total population over 16 years of age (7,579), 66.8% or 5,063 individuals are in the labor force, with 4.6% or 233 of them unemployed. The age group with the highest labor force participation rate is 35 to 44 years, with 91.4% or 1,088 individuals in the labor force. Within the labor force, the 20 to 24 years age range has the highest percentage of unemployed individuals, with 12.4% or 37 of them being unemployed.
| Age Bracket | In Labor Force | Unemployed |
| 16 to 19 Years | 53 (9.8%) | 0 (0.0%) |
| 20 to 24 Years | 298 (66.7%) | 37 (12.4%) |
| 25 to 29 Years | 335 (79.2%) | 0 (0.0%) |
| 30 to 34 Years | 273 (87.8%) | 0 (0.0%) |
| 35 to 44 Years | 1,088 (91.4%) | 90 (8.3%) |
| 45 to 54 Years | 1,212 (90.0%) | 32 (2.6%) |
| 55 to 59 Years | 597 (81.7%) | 15 (2.5%) |
| 60 to 64 Years | 754 (79.8%) | 44 (5.8%) |
| 65 to 74 Years | 364 (38.3%) | 9 (2.5%) |
| 75 Years and over | 89 (12.8%) | 9 (10.1%) |
| Total | 5,063 (66.8%) | 233 (4.6%) |
Employment Status by Educational Attainment in Leonia borough
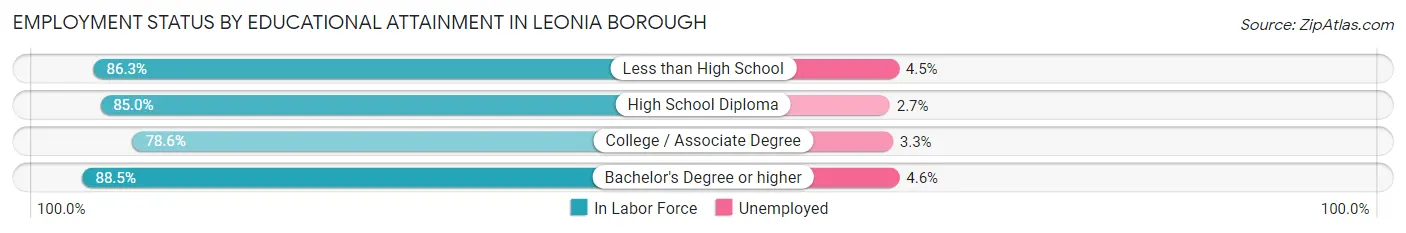
According to labor force statistics for Leonia borough, 86.1% of individuals (4,259) out of the total population between 25 and 64 years of age (4,947) are in the labor force, with 4.2% or 179 of them being unemployed. The group with the highest labor force participation rate are those with the educational attainment of bachelor's degree or higher, with 88.5% or 2,959 individuals in the labor force. Within the labor force, individuals with bachelor's degree or higher education have the highest percentage of unemployment, with 4.6% or 136 of them being unemployed.
| Educational Attainment | In Labor Force | Unemployed |
| Less than High School | 202 (86.3%) | 11 (4.5%) |
| High School Diploma | 301 (85.0%) | 10 (2.7%) |
| College / Associate Degree | 798 (78.6%) | 33 (3.3%) |
| Bachelor's Degree or higher | 2,959 (88.5%) | 154 (4.6%) |
| Total | 4,259 (86.1%) | 208 (4.2%) |
Employment Occupations by Sex in Leonia borough
Management, Business, Science and Arts Occupations
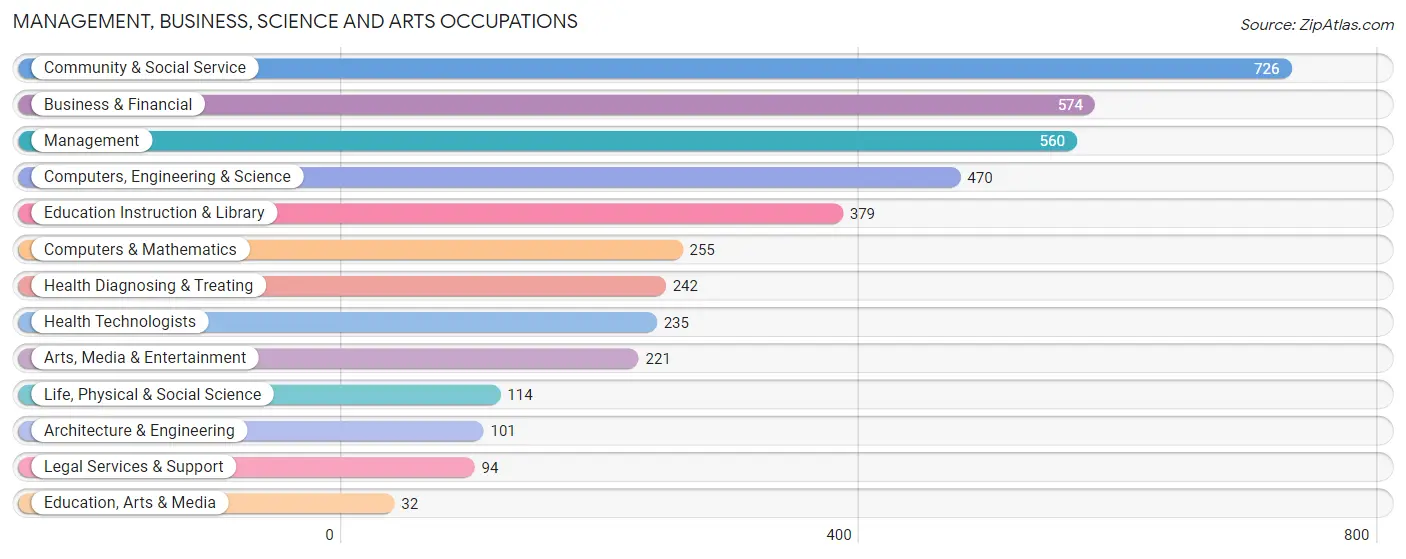
The most common Management, Business, Science and Arts occupations in Leonia borough are Community & Social Service (726 | 15.0%), Business & Financial (574 | 11.9%), Management (560 | 11.6%), Computers, Engineering & Science (470 | 9.7%), and Education Instruction & Library (379 | 7.9%).
Management, Business, Science and Arts Occupations by Sex
Within the Management, Business, Science and Arts occupations in Leonia borough, the most male-oriented occupations are Architecture & Engineering (100.0%), Computers, Engineering & Science (79.8%), and Legal Services & Support (78.7%), while the most female-oriented occupations are Health Technologists (65.1%), Arts, Media & Entertainment (64.2%), and Health Diagnosing & Treating (63.2%).
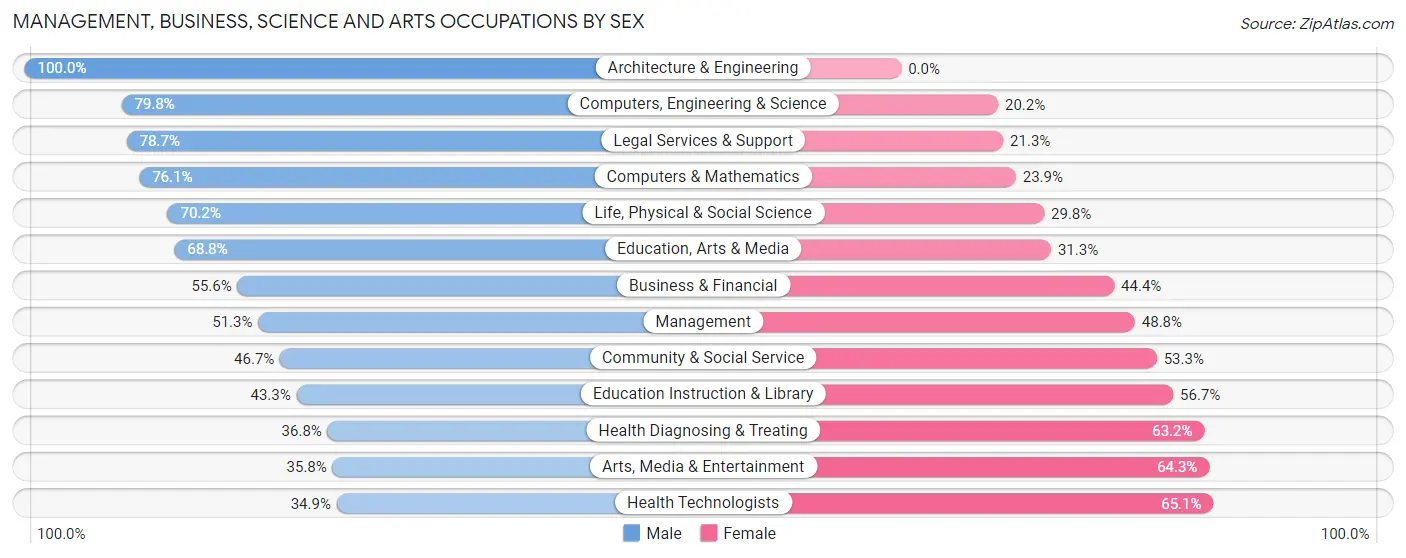
| Occupation | Male | Female |
| Management | 287 (51.2%) | 273 (48.7%) |
| Business & Financial | 319 (55.6%) | 255 (44.4%) |
| Computers, Engineering & Science | 375 (79.8%) | 95 (20.2%) |
| Computers & Mathematics | 194 (76.1%) | 61 (23.9%) |
| Architecture & Engineering | 101 (100.0%) | 0 (0.0%) |
| Life, Physical & Social Science | 80 (70.2%) | 34 (29.8%) |
| Community & Social Service | 339 (46.7%) | 387 (53.3%) |
| Education, Arts & Media | 22 (68.8%) | 10 (31.2%) |
| Legal Services & Support | 74 (78.7%) | 20 (21.3%) |
| Education Instruction & Library | 164 (43.3%) | 215 (56.7%) |
| Arts, Media & Entertainment | 79 (35.7%) | 142 (64.2%) |
| Health Diagnosing & Treating | 89 (36.8%) | 153 (63.2%) |
| Health Technologists | 82 (34.9%) | 153 (65.1%) |
| Total (Category) | 1,409 (54.8%) | 1,163 (45.2%) |
| Total (Overall) | 2,531 (52.4%) | 2,297 (47.6%) |
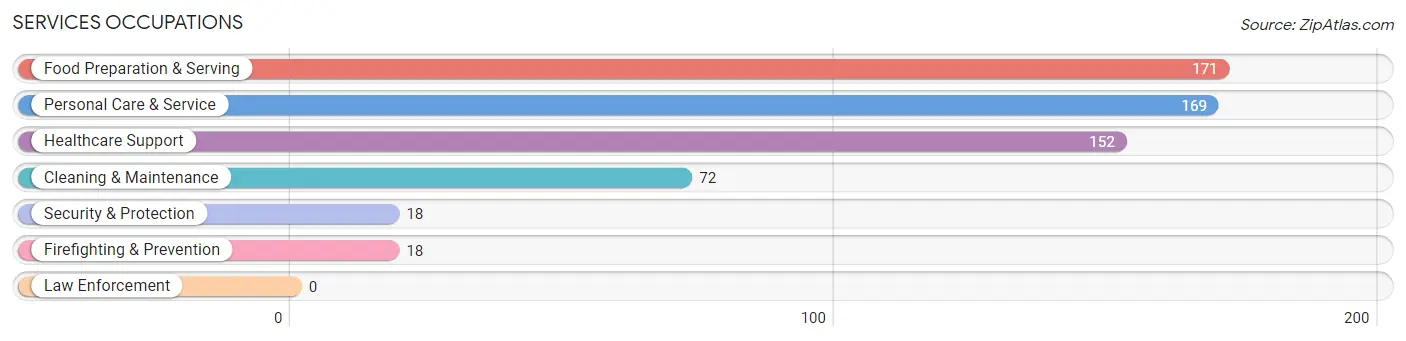
Services Occupations
The most common Services occupations in Leonia borough are Food Preparation & Serving (171 | 3.5%), Personal Care & Service (169 | 3.5%), Healthcare Support (152 | 3.2%), Cleaning & Maintenance (72 | 1.5%), and Security & Protection (18 | 0.4%).
Services Occupations by Sex
Within the Services occupations in Leonia borough, the most male-oriented occupations are Food Preparation & Serving (69.6%), Cleaning & Maintenance (55.6%), and Security & Protection (50.0%), while the most female-oriented occupations are Healthcare Support (92.1%), Personal Care & Service (68.6%), and Security & Protection (50.0%).
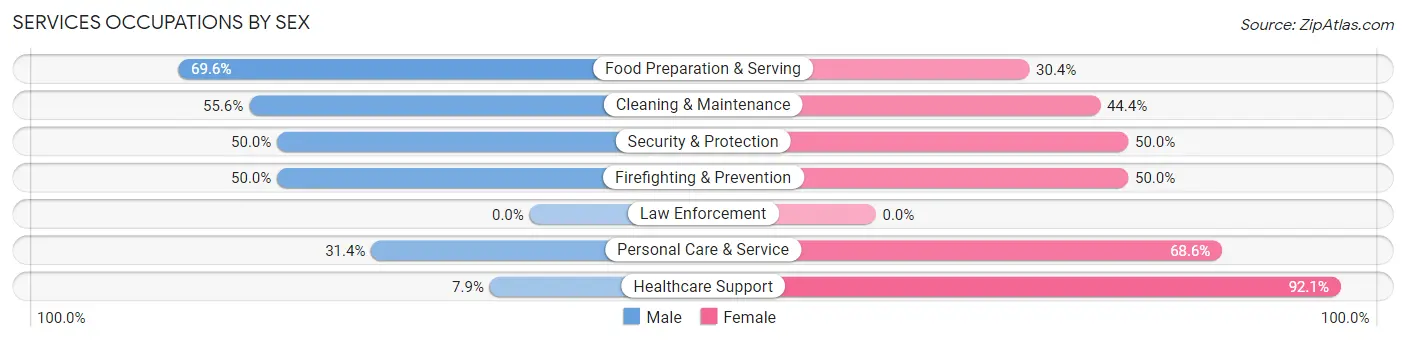
| Occupation | Male | Female |
| Healthcare Support | 12 (7.9%) | 140 (92.1%) |
| Security & Protection | 9 (50.0%) | 9 (50.0%) |
| Firefighting & Prevention | 9 (50.0%) | 9 (50.0%) |
| Law Enforcement | 0 (0.0%) | 0 (0.0%) |
| Food Preparation & Serving | 119 (69.6%) | 52 (30.4%) |
| Cleaning & Maintenance | 40 (55.6%) | 32 (44.4%) |
| Personal Care & Service | 53 (31.4%) | 116 (68.6%) |
| Total (Category) | 233 (40.0%) | 349 (60.0%) |
| Total (Overall) | 2,531 (52.4%) | 2,297 (47.6%) |
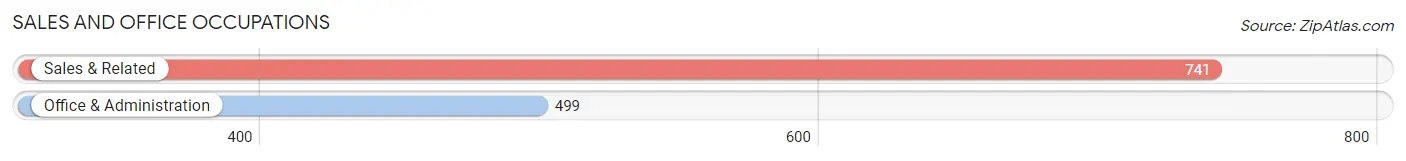
Sales and Office Occupations
The most common Sales and Office occupations in Leonia borough are Sales & Related (741 | 15.3%), and Office & Administration (499 | 10.3%).
Sales and Office Occupations by Sex

| Occupation | Male | Female |
| Sales & Related | 336 (45.3%) | 405 (54.7%) |
| Office & Administration | 141 (28.3%) | 358 (71.7%) |
| Total (Category) | 477 (38.5%) | 763 (61.5%) |
| Total (Overall) | 2,531 (52.4%) | 2,297 (47.6%) |
Natural Resources, Construction and Maintenance Occupations
The most common Natural Resources, Construction and Maintenance occupations in Leonia borough are Construction & Extraction (134 | 2.8%), and Installation, Maintenance & Repair (17 | 0.4%).
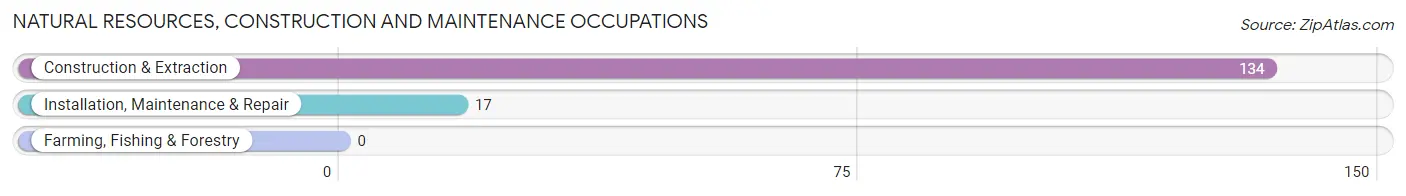
Natural Resources, Construction and Maintenance Occupations by Sex
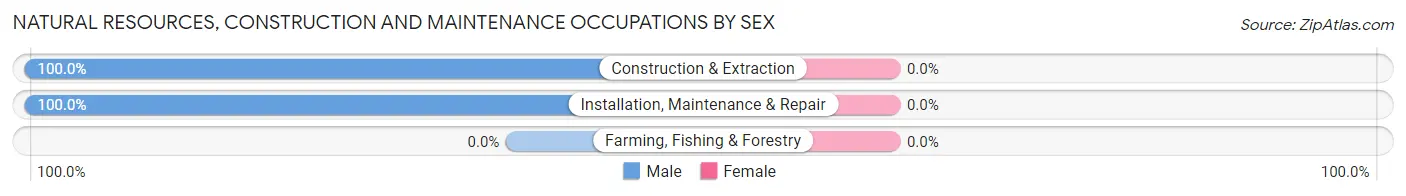
| Occupation | Male | Female |
| Farming, Fishing & Forestry | 0 (0.0%) | 0 (0.0%) |
| Construction & Extraction | 134 (100.0%) | 0 (0.0%) |
| Installation, Maintenance & Repair | 17 (100.0%) | 0 (0.0%) |
| Total (Category) | 151 (100.0%) | 0 (0.0%) |
| Total (Overall) | 2,531 (52.4%) | 2,297 (47.6%) |
Production, Transportation and Moving Occupations
The most common Production, Transportation and Moving occupations in Leonia borough are Transportation (169 | 3.5%), Production (80 | 1.7%), and Material Moving (34 | 0.7%).
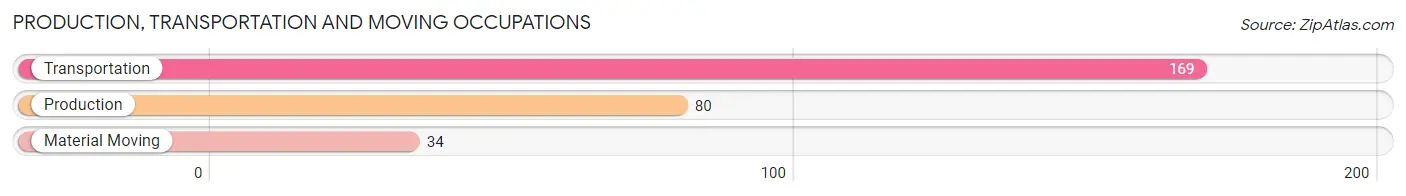
Production, Transportation and Moving Occupations by Sex
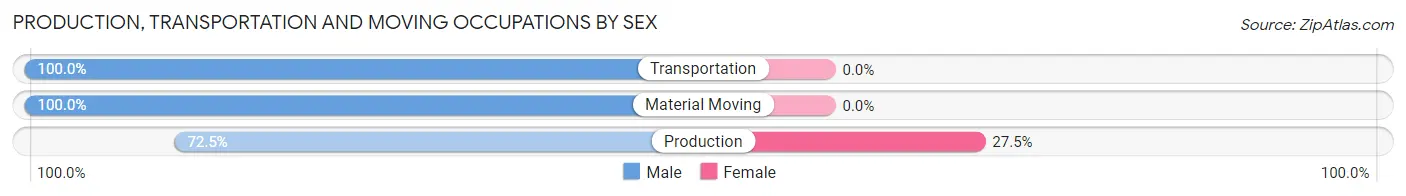
| Occupation | Male | Female |
| Production | 58 (72.5%) | 22 (27.5%) |
| Transportation | 169 (100.0%) | 0 (0.0%) |
| Material Moving | 34 (100.0%) | 0 (0.0%) |
| Total (Category) | 261 (92.2%) | 22 (7.8%) |
| Total (Overall) | 2,531 (52.4%) | 2,297 (47.6%) |
Employment Industries by Sex in Leonia borough
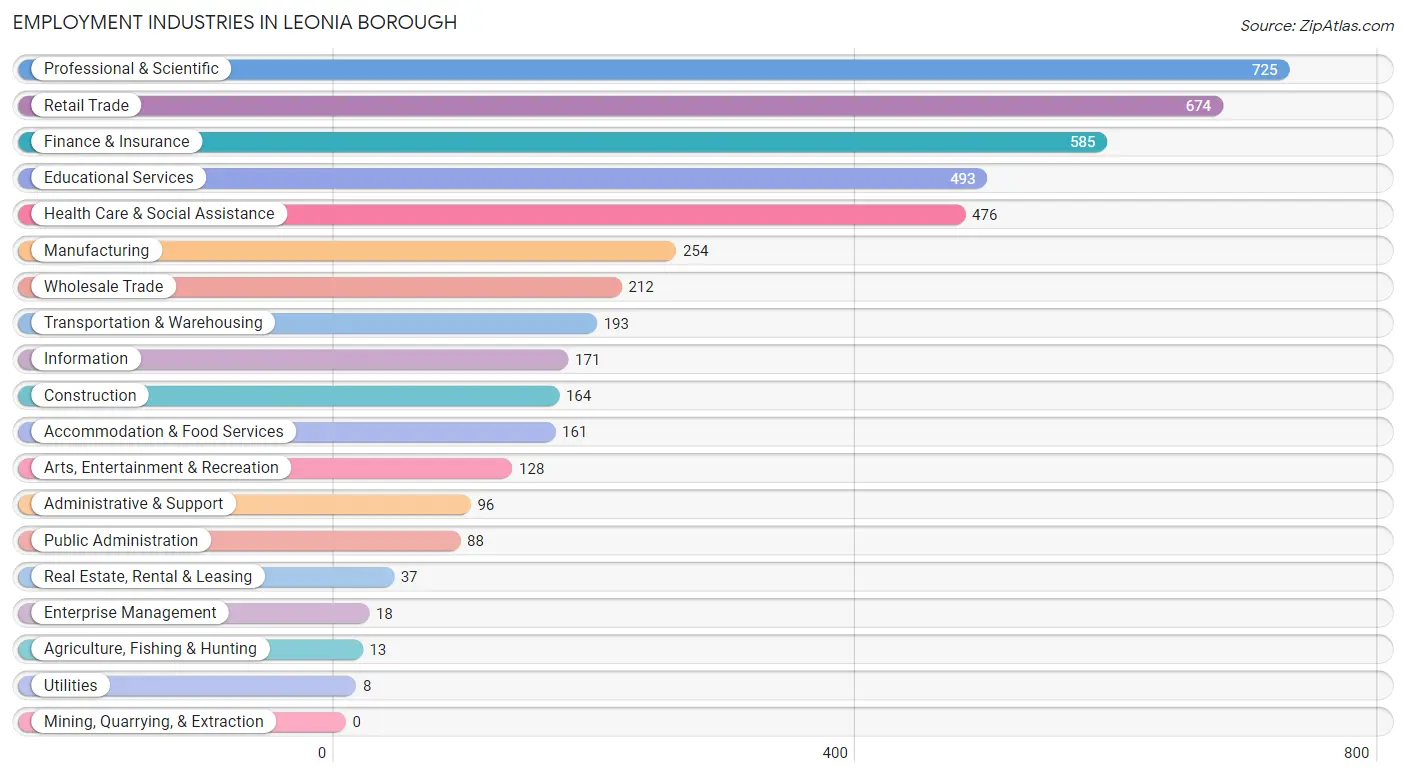
Employment Industries in Leonia borough
The major employment industries in Leonia borough include Professional & Scientific (725 | 15.0%), Retail Trade (674 | 14.0%), Finance & Insurance (585 | 12.1%), Educational Services (493 | 10.2%), and Health Care & Social Assistance (476 | 9.9%).
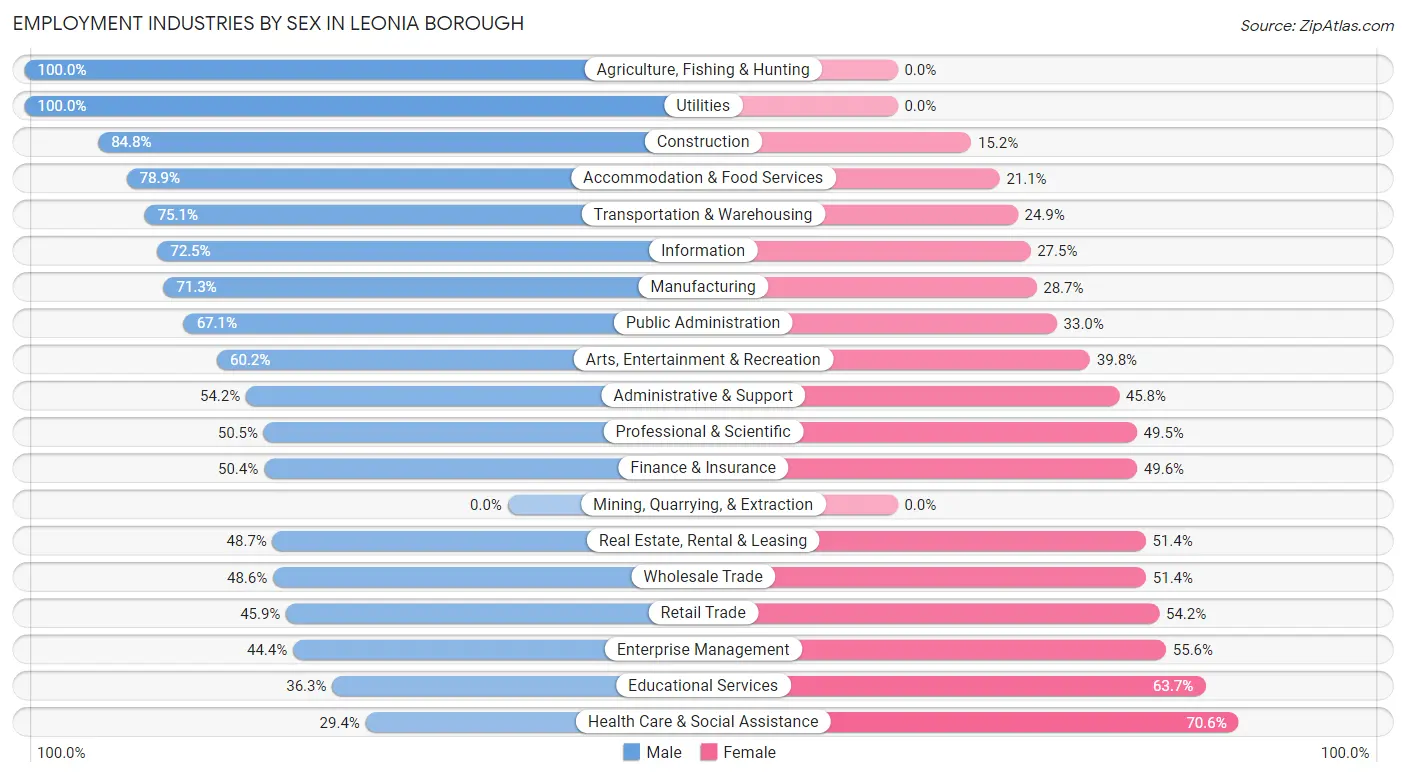
Employment Industries by Sex in Leonia borough
The Leonia borough industries that see more men than women are Agriculture, Fishing & Hunting (100.0%), Utilities (100.0%), and Construction (84.8%), whereas the industries that tend to have a higher number of women are Health Care & Social Assistance (70.6%), Educational Services (63.7%), and Enterprise Management (55.6%).
| Industry | Male | Female |
| Agriculture, Fishing & Hunting | 13 (100.0%) | 0 (0.0%) |
| Mining, Quarrying, & Extraction | 0 (0.0%) | 0 (0.0%) |
| Construction | 139 (84.8%) | 25 (15.2%) |
| Manufacturing | 181 (71.3%) | 73 (28.7%) |
| Wholesale Trade | 103 (48.6%) | 109 (51.4%) |
| Retail Trade | 309 (45.9%) | 365 (54.1%) |
| Transportation & Warehousing | 145 (75.1%) | 48 (24.9%) |
| Utilities | 8 (100.0%) | 0 (0.0%) |
| Information | 124 (72.5%) | 47 (27.5%) |
| Finance & Insurance | 295 (50.4%) | 290 (49.6%) |
| Real Estate, Rental & Leasing | 18 (48.6%) | 19 (51.3%) |
| Professional & Scientific | 366 (50.5%) | 359 (49.5%) |
| Enterprise Management | 8 (44.4%) | 10 (55.6%) |
| Administrative & Support | 52 (54.2%) | 44 (45.8%) |
| Educational Services | 179 (36.3%) | 314 (63.7%) |
| Health Care & Social Assistance | 140 (29.4%) | 336 (70.6%) |
| Arts, Entertainment & Recreation | 77 (60.2%) | 51 (39.8%) |
| Accommodation & Food Services | 127 (78.9%) | 34 (21.1%) |
| Public Administration | 59 (67.0%) | 29 (33.0%) |
| Total | 2,531 (52.4%) | 2,297 (47.6%) |
Education in Leonia borough
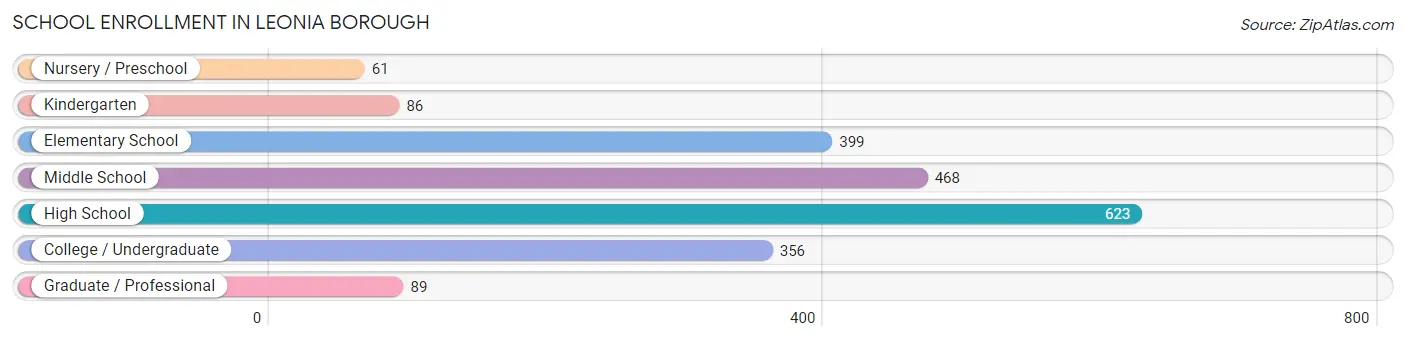
School Enrollment in Leonia borough
The most common levels of schooling among the 2,082 students in Leonia borough are high school (623 | 29.9%), middle school (468 | 22.5%), and elementary school (399 | 19.2%).
| School Level | # Students | % Students |
| Nursery / Preschool | 61 | 2.9% |
| Kindergarten | 86 | 4.1% |
| Elementary School | 399 | 19.2% |
| Middle School | 468 | 22.5% |
| High School | 623 | 29.9% |
| College / Undergraduate | 356 | 17.1% |
| Graduate / Professional | 89 | 4.3% |
| Total | 2,082 | 100.0% |
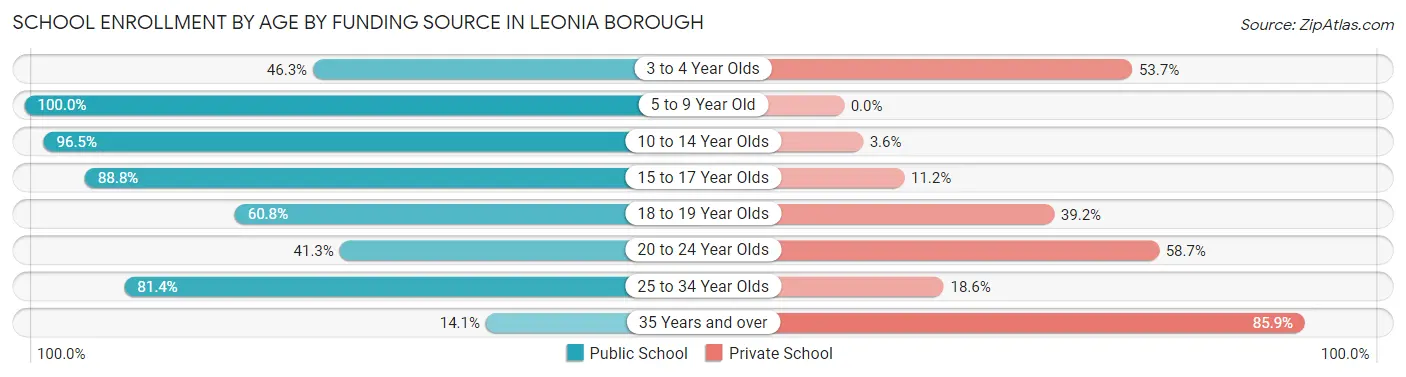
School Enrollment by Age by Funding Source in Leonia borough
Out of a total of 2,082 students who are enrolled in schools in Leonia borough, 383 (18.4%) attend a private institution, while the remaining 1,699 (81.6%) are enrolled in public schools. The age group of 35 years and over has the highest likelihood of being enrolled in private schools, with 67 (85.9% in the age bracket) enrolled. Conversely, the age group of 5 to 9 year old has the lowest likelihood of being enrolled in a private school, with 434 (100.0% in the age bracket) attending a public institution.
| Age Bracket | Public School | Private School |
| 3 to 4 Year Olds | 25 (46.3%) | 29 (53.7%) |
| 5 to 9 Year Old | 434 (100.0%) | 0 (0.0%) |
| 10 to 14 Year Olds | 598 (96.5%) | 22 (3.5%) |
| 15 to 17 Year Olds | 395 (88.8%) | 50 (11.2%) |
| 18 to 19 Year Olds | 101 (60.8%) | 65 (39.2%) |
| 20 to 24 Year Olds | 100 (41.3%) | 142 (58.7%) |
| 25 to 34 Year Olds | 35 (81.4%) | 8 (18.6%) |
| 35 Years and over | 11 (14.1%) | 67 (85.9%) |
| Total | 1,699 (81.6%) | 383 (18.4%) |
Educational Attainment by Field of Study in Leonia borough
Business (815 | 19.7%), visual & performing arts (516 | 12.4%), literature & languages (379 | 9.1%), social sciences (352 | 8.5%), and computers & mathematics (316 | 7.6%) are the most common fields of study among 4,148 individuals in Leonia borough who have obtained a bachelor's degree or higher.
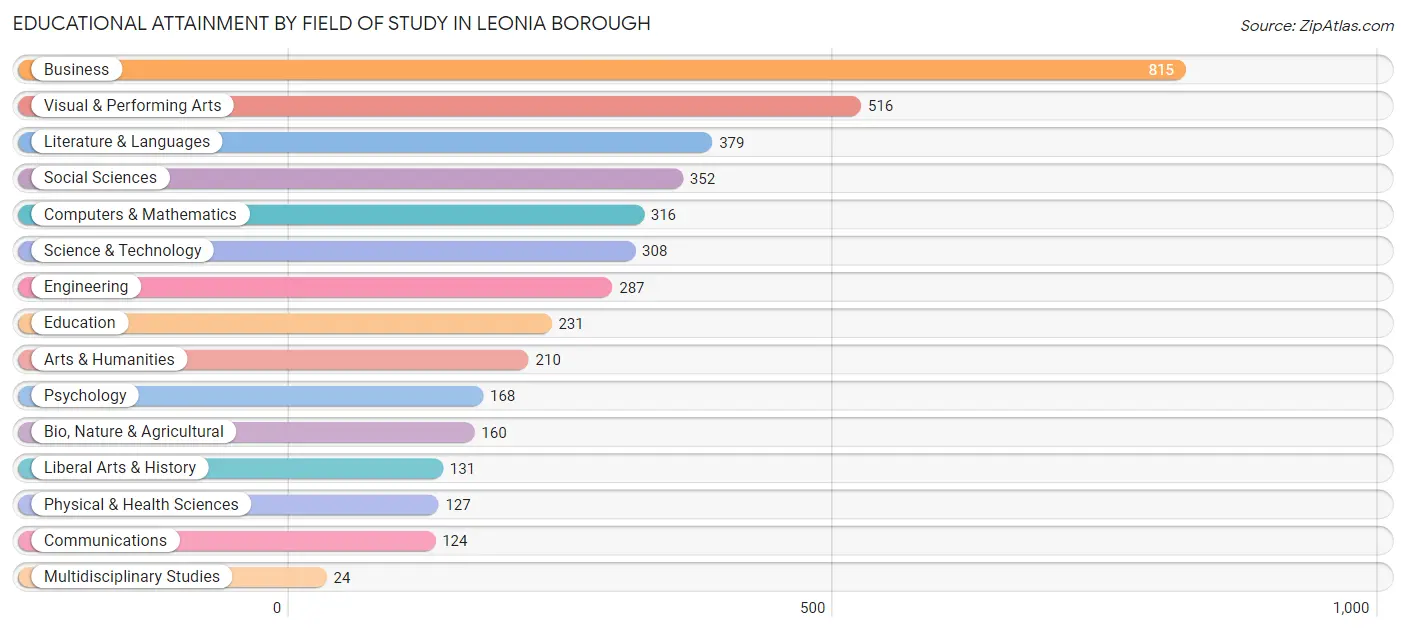
| Field of Study | # Graduates | % Graduates |
| Computers & Mathematics | 316 | 7.6% |
| Bio, Nature & Agricultural | 160 | 3.9% |
| Physical & Health Sciences | 127 | 3.1% |
| Psychology | 168 | 4.1% |
| Social Sciences | 352 | 8.5% |
| Engineering | 287 | 6.9% |
| Multidisciplinary Studies | 24 | 0.6% |
| Science & Technology | 308 | 7.4% |
| Business | 815 | 19.7% |
| Education | 231 | 5.6% |
| Literature & Languages | 379 | 9.1% |
| Liberal Arts & History | 131 | 3.2% |
| Visual & Performing Arts | 516 | 12.4% |
| Communications | 124 | 3.0% |
| Arts & Humanities | 210 | 5.1% |
| Total | 4,148 | 100.0% |
Transportation & Commute in Leonia borough
Vehicle Availability by Sex in Leonia borough
The most prevalent vehicle ownership categories in Leonia borough are males with 2 vehicles (1,103, accounting for 44.9%) and females with 2 vehicles (857, making up 48.6%).
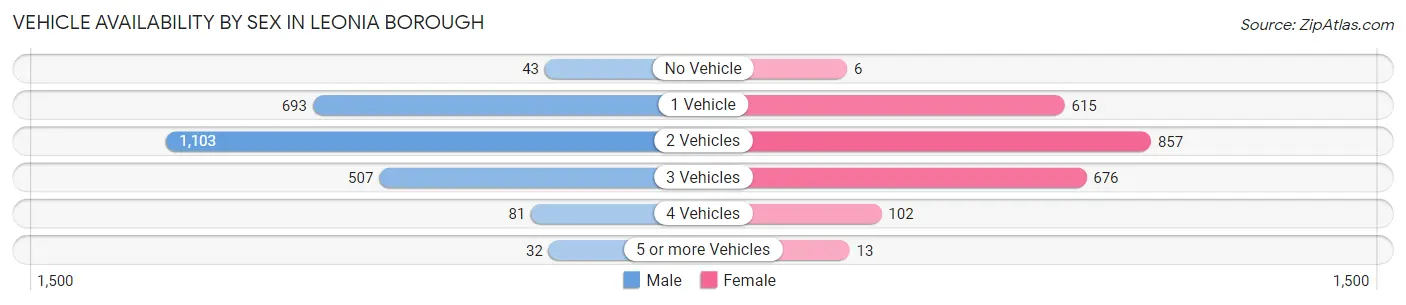
| Vehicles Available | Male | Female |
| No Vehicle | 43 (1.8%) | 6 (0.3%) |
| 1 Vehicle | 693 (28.2%) | 615 (27.1%) |
| 2 Vehicles | 1,103 (44.9%) | 857 (37.8%) |
| 3 Vehicles | 507 (20.6%) | 676 (29.8%) |
| 4 Vehicles | 81 (3.3%) | 102 (4.5%) |
| 5 or more Vehicles | 32 (1.3%) | 13 (0.6%) |
| Total | 2,459 (100.0%) | 2,269 (100.0%) |
Commute Time in Leonia borough
The most frequently occuring commute durations in Leonia borough are 60 to 89 minutes (661 commuters, 16.0%), 10 to 14 minutes (615 commuters, 14.8%), and 15 to 19 minutes (548 commuters, 13.2%).
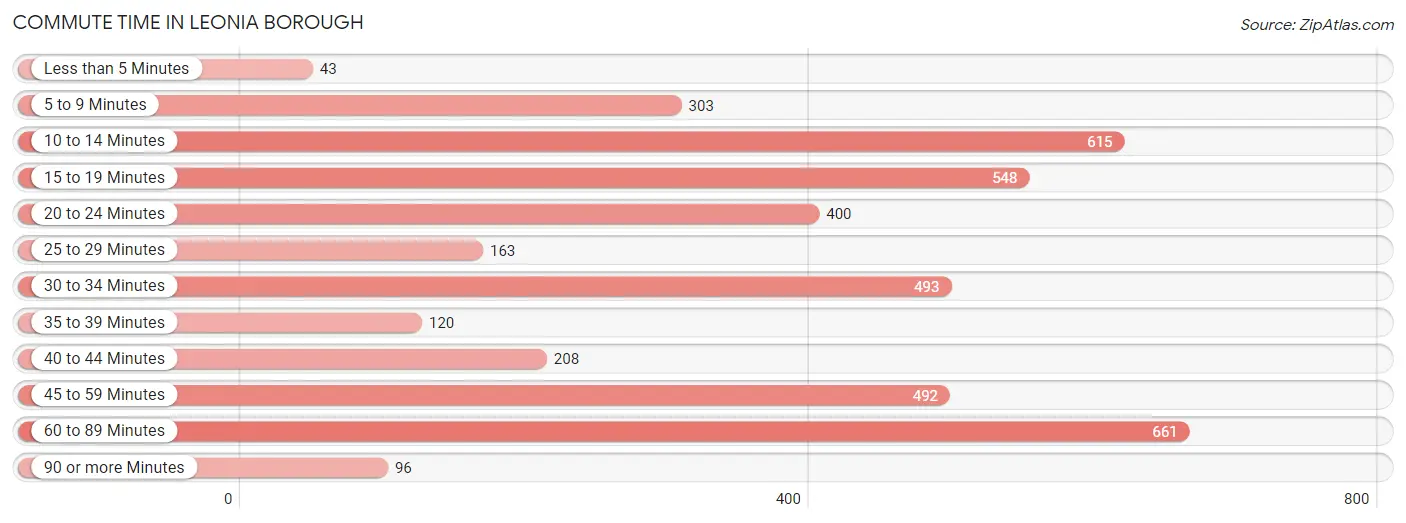
| Commute Time | # Commuters | % Commuters |
| Less than 5 Minutes | 43 | 1.0% |
| 5 to 9 Minutes | 303 | 7.3% |
| 10 to 14 Minutes | 615 | 14.8% |
| 15 to 19 Minutes | 548 | 13.2% |
| 20 to 24 Minutes | 400 | 9.7% |
| 25 to 29 Minutes | 163 | 3.9% |
| 30 to 34 Minutes | 493 | 11.9% |
| 35 to 39 Minutes | 120 | 2.9% |
| 40 to 44 Minutes | 208 | 5.0% |
| 45 to 59 Minutes | 492 | 11.9% |
| 60 to 89 Minutes | 661 | 16.0% |
| 90 or more Minutes | 96 | 2.3% |
Commute Time by Sex in Leonia borough
The most common commute times in Leonia borough are 10 to 14 minutes (384 commuters, 17.2%) for males and 15 to 19 minutes (343 commuters, 18.0%) for females.
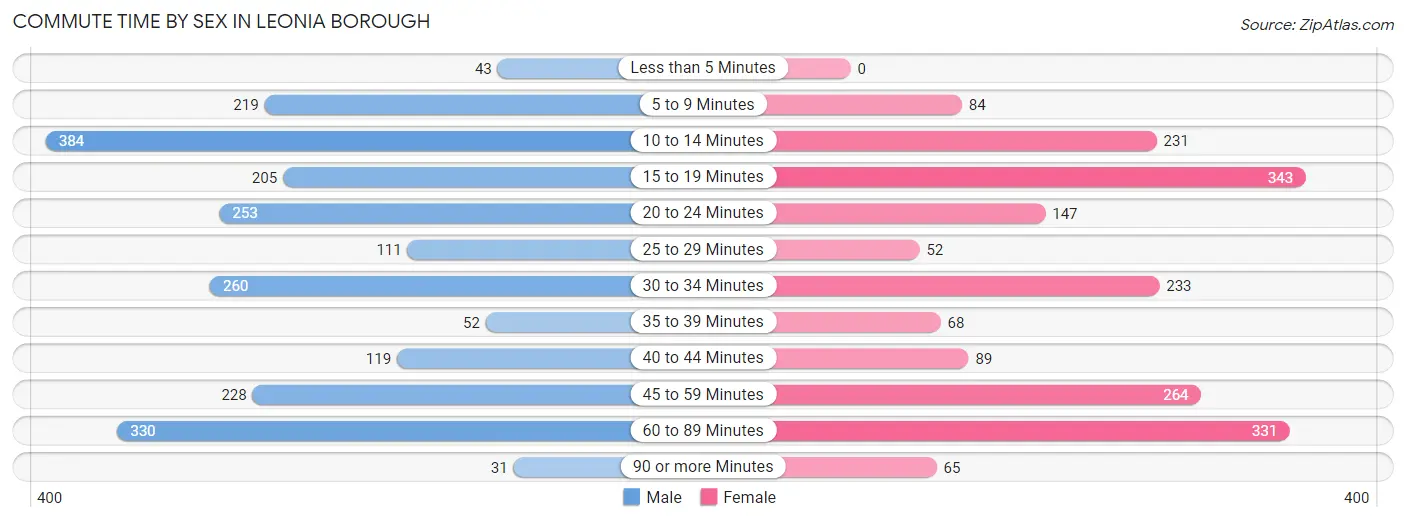
| Commute Time | Male | Female |
| Less than 5 Minutes | 43 (1.9%) | 0 (0.0%) |
| 5 to 9 Minutes | 219 (9.8%) | 84 (4.4%) |
| 10 to 14 Minutes | 384 (17.2%) | 231 (12.1%) |
| 15 to 19 Minutes | 205 (9.2%) | 343 (18.0%) |
| 20 to 24 Minutes | 253 (11.3%) | 147 (7.7%) |
| 25 to 29 Minutes | 111 (5.0%) | 52 (2.7%) |
| 30 to 34 Minutes | 260 (11.6%) | 233 (12.2%) |
| 35 to 39 Minutes | 52 (2.3%) | 68 (3.6%) |
| 40 to 44 Minutes | 119 (5.3%) | 89 (4.7%) |
| 45 to 59 Minutes | 228 (10.2%) | 264 (13.8%) |
| 60 to 89 Minutes | 330 (14.8%) | 331 (17.4%) |
| 90 or more Minutes | 31 (1.4%) | 65 (3.4%) |
Time of Departure to Work by Sex in Leonia borough
The most frequent times of departure to work in Leonia borough are 7:30 AM to 7:59 AM (362, 16.2%) for males and 8:00 AM to 8:29 AM (426, 22.3%) for females.
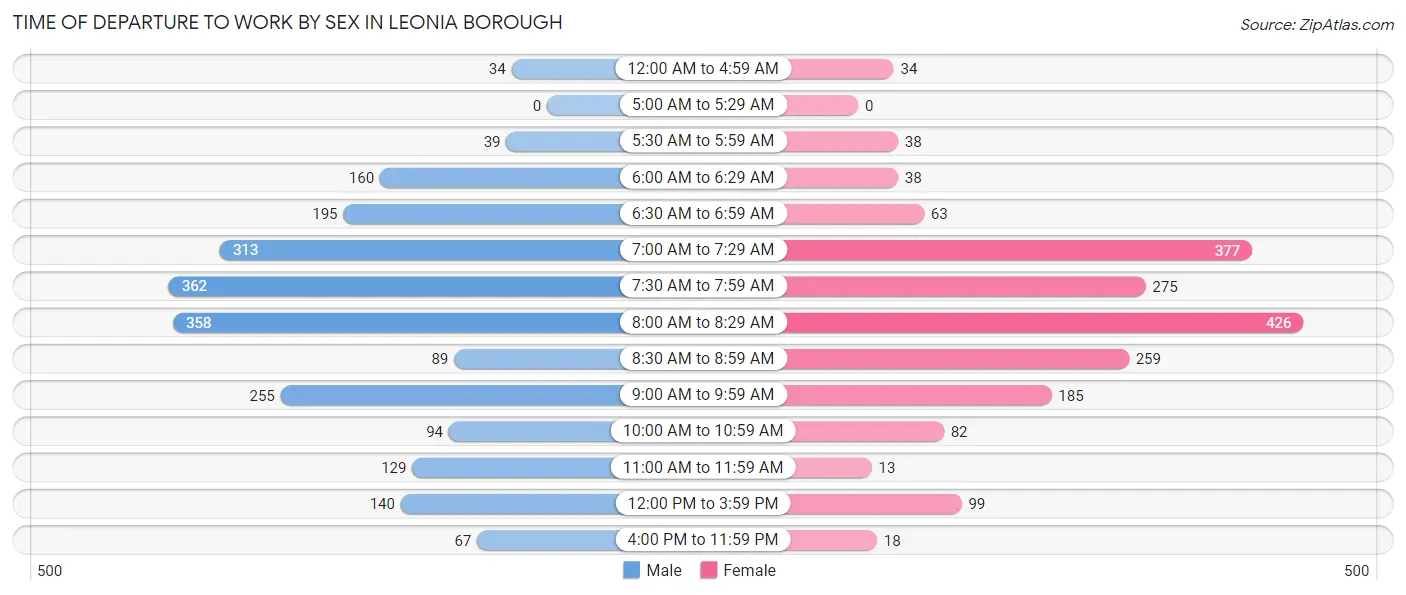
| Time of Departure | Male | Female |
| 12:00 AM to 4:59 AM | 34 (1.5%) | 34 (1.8%) |
| 5:00 AM to 5:29 AM | 0 (0.0%) | 0 (0.0%) |
| 5:30 AM to 5:59 AM | 39 (1.7%) | 38 (2.0%) |
| 6:00 AM to 6:29 AM | 160 (7.2%) | 38 (2.0%) |
| 6:30 AM to 6:59 AM | 195 (8.7%) | 63 (3.3%) |
| 7:00 AM to 7:29 AM | 313 (14.0%) | 377 (19.8%) |
| 7:30 AM to 7:59 AM | 362 (16.2%) | 275 (14.4%) |
| 8:00 AM to 8:29 AM | 358 (16.0%) | 426 (22.3%) |
| 8:30 AM to 8:59 AM | 89 (4.0%) | 259 (13.6%) |
| 9:00 AM to 9:59 AM | 255 (11.4%) | 185 (9.7%) |
| 10:00 AM to 10:59 AM | 94 (4.2%) | 82 (4.3%) |
| 11:00 AM to 11:59 AM | 129 (5.8%) | 13 (0.7%) |
| 12:00 PM to 3:59 PM | 140 (6.3%) | 99 (5.2%) |
| 4:00 PM to 11:59 PM | 67 (3.0%) | 18 (0.9%) |
| Total | 2,235 (100.0%) | 1,907 (100.0%) |
Housing Occupancy in Leonia borough
Occupancy by Ownership in Leonia borough
Of the total 3,433 dwellings in Leonia borough, owner-occupied units account for 2,310 (67.3%), while renter-occupied units make up 1,123 (32.7%).
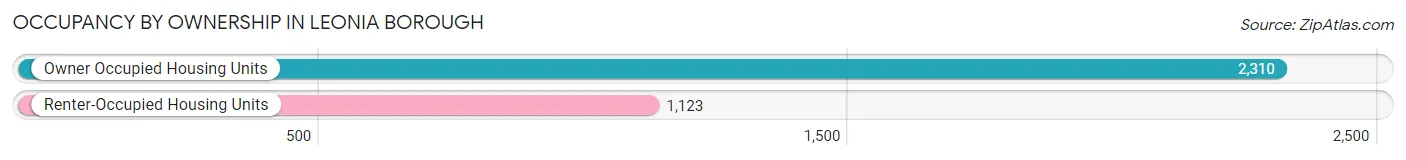
| Occupancy | # Housing Units | % Housing Units |
| Owner Occupied Housing Units | 2,310 | 67.3% |
| Renter-Occupied Housing Units | 1,123 | 32.7% |
| Total Occupied Housing Units | 3,433 | 100.0% |
Occupancy by Household Size in Leonia borough
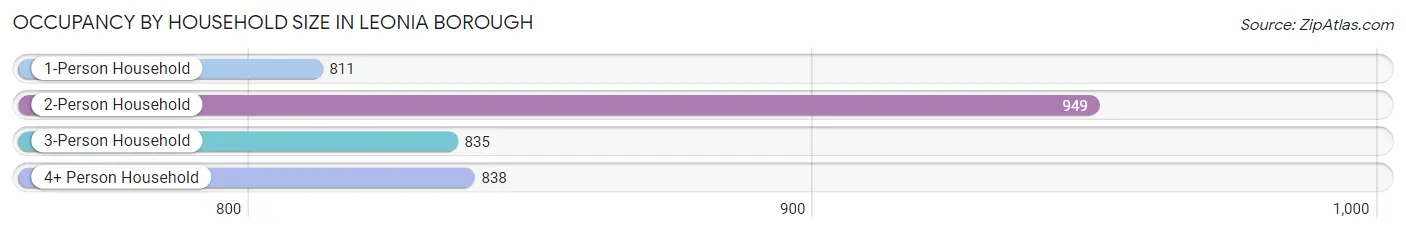
| Household Size | # Housing Units | % Housing Units |
| 1-Person Household | 811 | 23.6% |
| 2-Person Household | 949 | 27.6% |
| 3-Person Household | 835 | 24.3% |
| 4+ Person Household | 838 | 24.4% |
| Total Housing Units | 3,433 | 100.0% |
Occupancy by Ownership by Household Size in Leonia borough
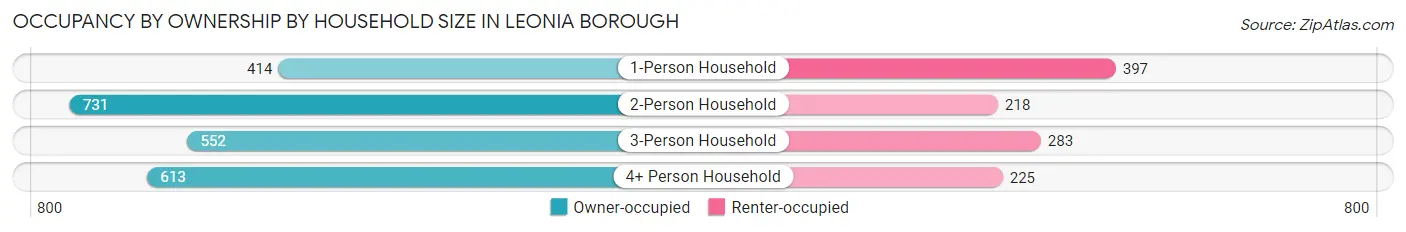
| Household Size | Owner-occupied | Renter-occupied |
| 1-Person Household | 414 (51.0%) | 397 (48.9%) |
| 2-Person Household | 731 (77.0%) | 218 (23.0%) |
| 3-Person Household | 552 (66.1%) | 283 (33.9%) |
| 4+ Person Household | 613 (73.2%) | 225 (26.9%) |
| Total Housing Units | 2,310 (67.3%) | 1,123 (32.7%) |
Occupancy by Educational Attainment in Leonia borough
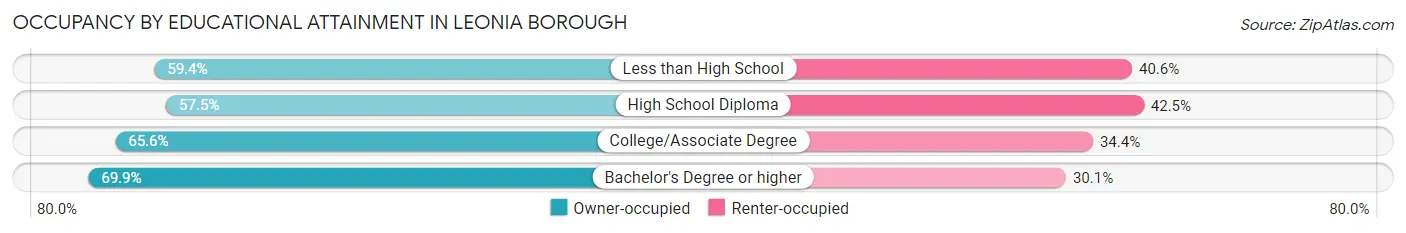
| Household Size | Owner-occupied | Renter-occupied |
| Less than High School | 123 (59.4%) | 84 (40.6%) |
| High School Diploma | 164 (57.5%) | 121 (42.5%) |
| College/Associate Degree | 498 (65.6%) | 261 (34.4%) |
| Bachelor's Degree or higher | 1,525 (69.9%) | 657 (30.1%) |
Occupancy by Age of Householder in Leonia borough
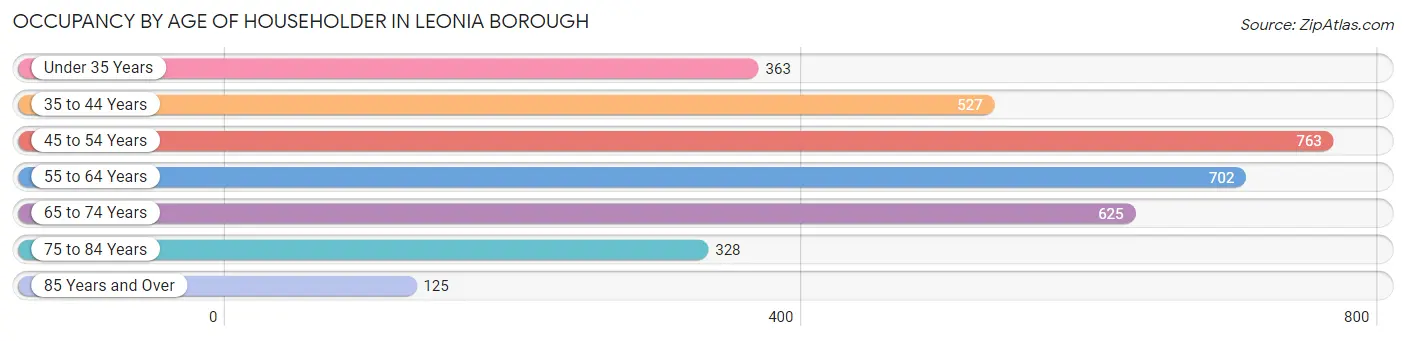
| Age Bracket | # Households | % Households |
| Under 35 Years | 363 | 10.6% |
| 35 to 44 Years | 527 | 15.3% |
| 45 to 54 Years | 763 | 22.2% |
| 55 to 64 Years | 702 | 20.4% |
| 65 to 74 Years | 625 | 18.2% |
| 75 to 84 Years | 328 | 9.6% |
| 85 Years and Over | 125 | 3.6% |
| Total | 3,433 | 100.0% |
Housing Finances in Leonia borough
Median Income by Occupancy in Leonia borough
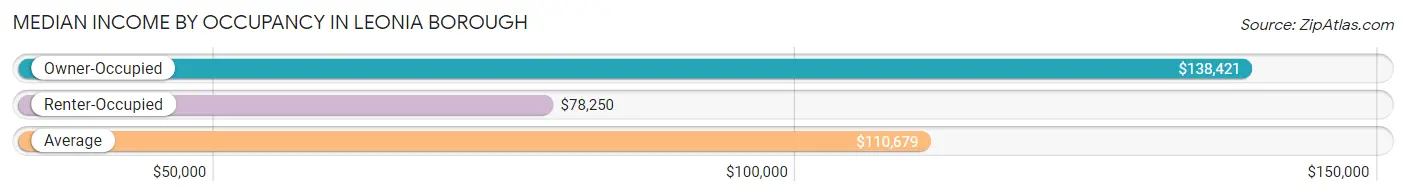
| Occupancy Type | # Households | Median Income |
| Owner-Occupied | 2,310 (67.3%) | $138,421 |
| Renter-Occupied | 1,123 (32.7%) | $78,250 |
| Average | 3,433 (100.0%) | $110,679 |
Occupancy by Householder Income Bracket in Leonia borough
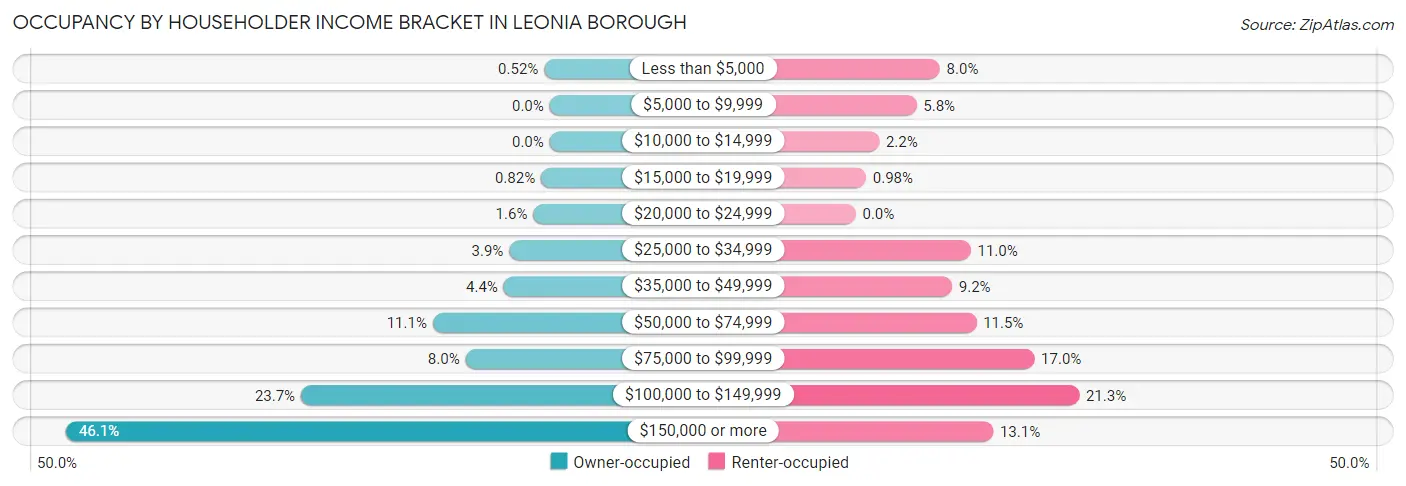
| Income Bracket | Owner-occupied | Renter-occupied |
| Less than $5,000 | 12 (0.5%) | 90 (8.0%) |
| $5,000 to $9,999 | 0 (0.0%) | 65 (5.8%) |
| $10,000 to $14,999 | 0 (0.0%) | 25 (2.2%) |
| $15,000 to $19,999 | 19 (0.8%) | 11 (1.0%) |
| $20,000 to $24,999 | 36 (1.6%) | 0 (0.0%) |
| $25,000 to $34,999 | 89 (3.8%) | 123 (11.0%) |
| $35,000 to $49,999 | 101 (4.4%) | 103 (9.2%) |
| $50,000 to $74,999 | 257 (11.1%) | 129 (11.5%) |
| $75,000 to $99,999 | 185 (8.0%) | 191 (17.0%) |
| $100,000 to $149,999 | 547 (23.7%) | 239 (21.3%) |
| $150,000 or more | 1,064 (46.1%) | 147 (13.1%) |
| Total | 2,310 (100.0%) | 1,123 (100.0%) |
Monthly Housing Cost Tiers in Leonia borough
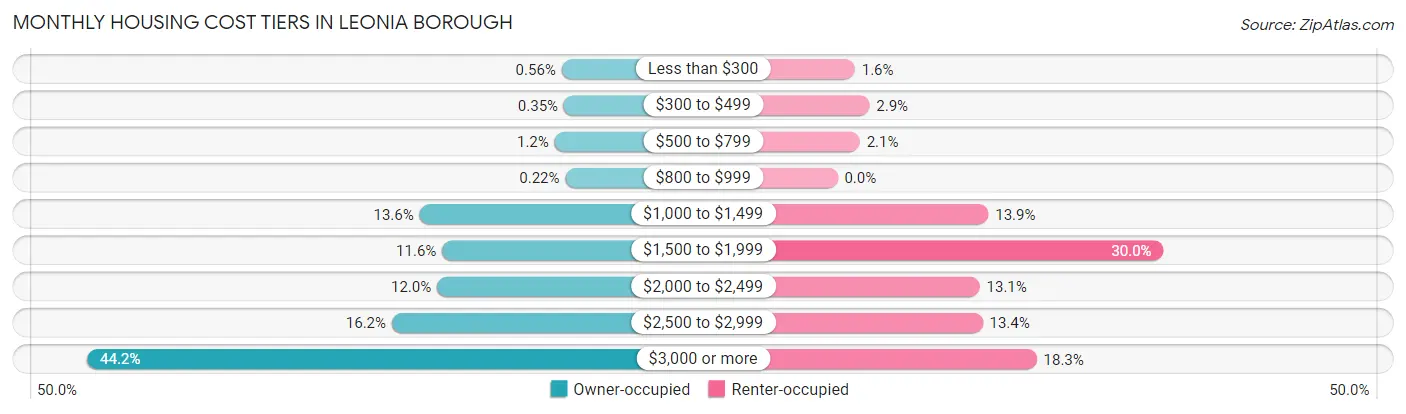
| Monthly Cost | Owner-occupied | Renter-occupied |
| Less than $300 | 13 (0.6%) | 18 (1.6%) |
| $300 to $499 | 8 (0.4%) | 33 (2.9%) |
| $500 to $799 | 28 (1.2%) | 23 (2.1%) |
| $800 to $999 | 5 (0.2%) | 0 (0.0%) |
| $1,000 to $1,499 | 315 (13.6%) | 156 (13.9%) |
| $1,500 to $1,999 | 267 (11.6%) | 337 (30.0%) |
| $2,000 to $2,499 | 278 (12.0%) | 147 (13.1%) |
| $2,500 to $2,999 | 374 (16.2%) | 150 (13.4%) |
| $3,000 or more | 1,022 (44.2%) | 206 (18.3%) |
| Total | 2,310 (100.0%) | 1,123 (100.0%) |
Physical Housing Characteristics in Leonia borough
Housing Structures in Leonia borough
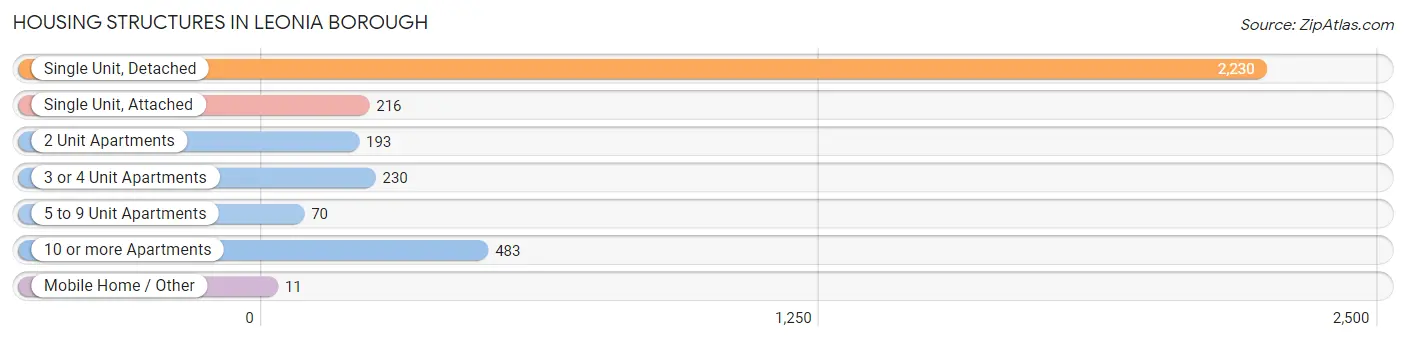
| Structure Type | # Housing Units | % Housing Units |
| Single Unit, Detached | 2,230 | 65.0% |
| Single Unit, Attached | 216 | 6.3% |
| 2 Unit Apartments | 193 | 5.6% |
| 3 or 4 Unit Apartments | 230 | 6.7% |
| 5 to 9 Unit Apartments | 70 | 2.0% |
| 10 or more Apartments | 483 | 14.1% |
| Mobile Home / Other | 11 | 0.3% |
| Total | 3,433 | 100.0% |
Housing Structures by Occupancy in Leonia borough
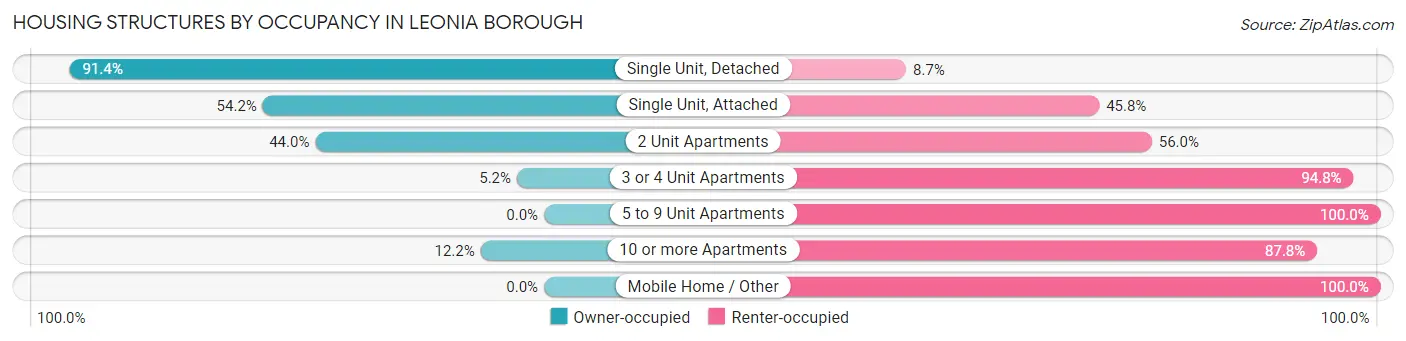
| Structure Type | Owner-occupied | Renter-occupied |
| Single Unit, Detached | 2,037 (91.3%) | 193 (8.6%) |
| Single Unit, Attached | 117 (54.2%) | 99 (45.8%) |
| 2 Unit Apartments | 85 (44.0%) | 108 (56.0%) |
| 3 or 4 Unit Apartments | 12 (5.2%) | 218 (94.8%) |
| 5 to 9 Unit Apartments | 0 (0.0%) | 70 (100.0%) |
| 10 or more Apartments | 59 (12.2%) | 424 (87.8%) |
| Mobile Home / Other | 0 (0.0%) | 11 (100.0%) |
| Total | 2,310 (67.3%) | 1,123 (32.7%) |
Housing Structures by Number of Rooms in Leonia borough
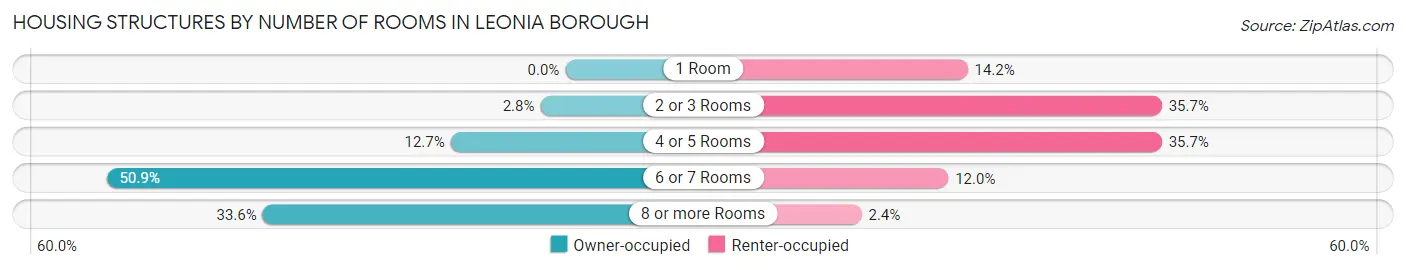
| Number of Rooms | Owner-occupied | Renter-occupied |
| 1 Room | 0 (0.0%) | 159 (14.2%) |
| 2 or 3 Rooms | 64 (2.8%) | 401 (35.7%) |
| 4 or 5 Rooms | 294 (12.7%) | 401 (35.7%) |
| 6 or 7 Rooms | 1,176 (50.9%) | 135 (12.0%) |
| 8 or more Rooms | 776 (33.6%) | 27 (2.4%) |
| Total | 2,310 (100.0%) | 1,123 (100.0%) |
Housing Structure by Heating Type in Leonia borough
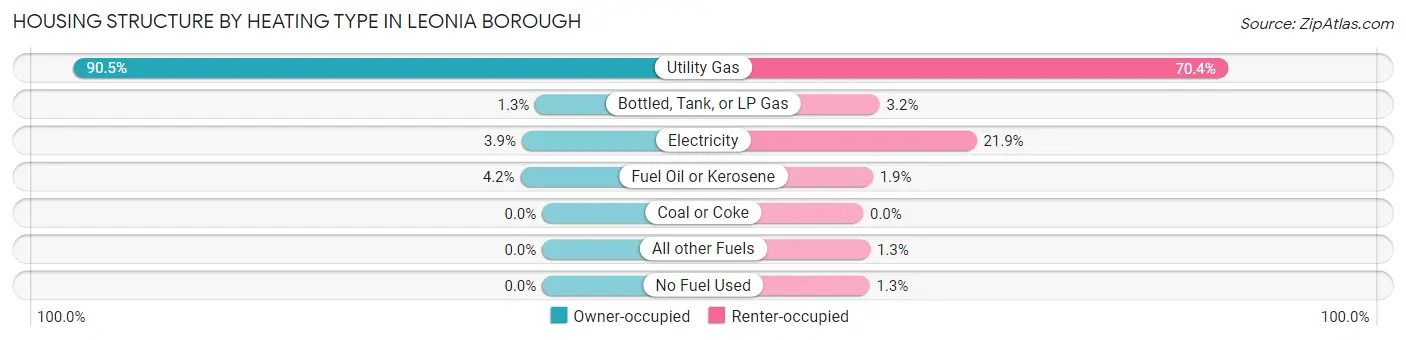
| Heating Type | Owner-occupied | Renter-occupied |
| Utility Gas | 2,091 (90.5%) | 791 (70.4%) |
| Bottled, Tank, or LP Gas | 31 (1.3%) | 36 (3.2%) |
| Electricity | 91 (3.9%) | 246 (21.9%) |
| Fuel Oil or Kerosene | 97 (4.2%) | 21 (1.9%) |
| Coal or Coke | 0 (0.0%) | 0 (0.0%) |
| All other Fuels | 0 (0.0%) | 15 (1.3%) |
| No Fuel Used | 0 (0.0%) | 14 (1.3%) |
| Total | 2,310 (100.0%) | 1,123 (100.0%) |
Household Vehicle Usage in Leonia borough
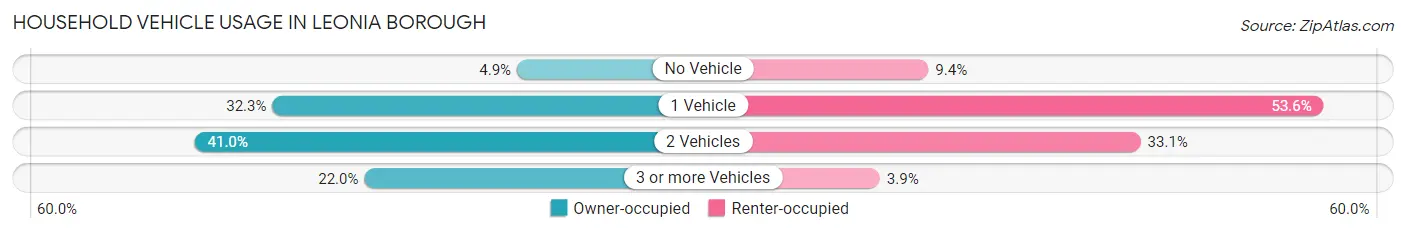
| Vehicles per Household | Owner-occupied | Renter-occupied |
| No Vehicle | 112 (4.9%) | 105 (9.3%) |
| 1 Vehicle | 745 (32.3%) | 602 (53.6%) |
| 2 Vehicles | 946 (40.9%) | 372 (33.1%) |
| 3 or more Vehicles | 507 (22.0%) | 44 (3.9%) |
| Total | 2,310 (100.0%) | 1,123 (100.0%) |
Real Estate & Mortgages in Leonia borough
Real Estate and Mortgage Overview in Leonia borough
| Characteristic | Without Mortgage | With Mortgage |
| Housing Units | 767 | 1,543 |
| Median Property Value | $577,200 | $638,900 |
| Median Household Income | $101,250 | $842 |
| Monthly Housing Costs | $1,501 | $1,011 |
| Real Estate Taxes | $10,001 | $0 |
Property Value by Mortgage Status in Leonia borough
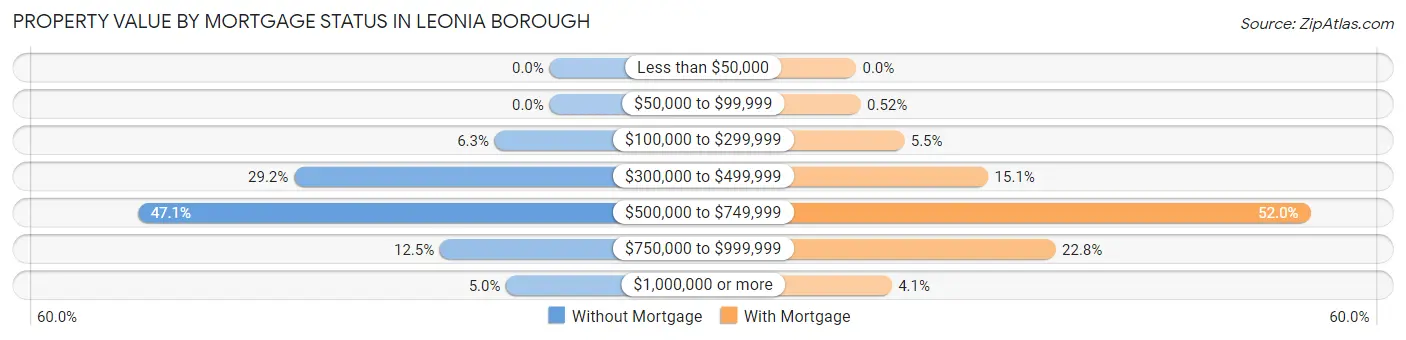
| Property Value | Without Mortgage | With Mortgage |
| Less than $50,000 | 0 (0.0%) | 0 (0.0%) |
| $50,000 to $99,999 | 0 (0.0%) | 8 (0.5%) |
| $100,000 to $299,999 | 48 (6.3%) | 85 (5.5%) |
| $300,000 to $499,999 | 224 (29.2%) | 233 (15.1%) |
| $500,000 to $749,999 | 361 (47.1%) | 802 (52.0%) |
| $750,000 to $999,999 | 96 (12.5%) | 352 (22.8%) |
| $1,000,000 or more | 38 (5.0%) | 63 (4.1%) |
| Total | 767 (100.0%) | 1,543 (100.0%) |
Household Income by Mortgage Status in Leonia borough
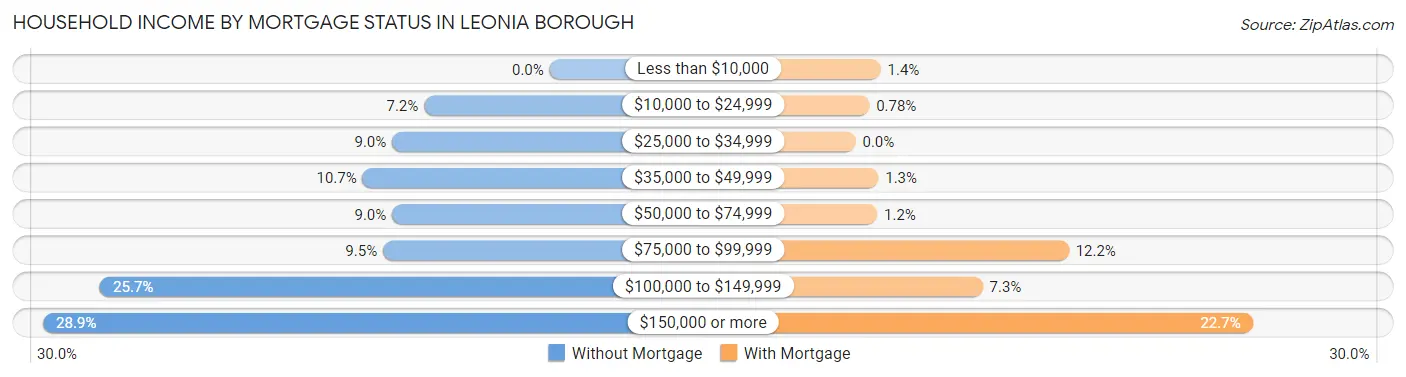
| Household Income | Without Mortgage | With Mortgage |
| Less than $10,000 | 0 (0.0%) | 22 (1.4%) |
| $10,000 to $24,999 | 55 (7.2%) | 12 (0.8%) |
| $25,000 to $34,999 | 69 (9.0%) | 0 (0.0%) |
| $35,000 to $49,999 | 82 (10.7%) | 20 (1.3%) |
| $50,000 to $74,999 | 69 (9.0%) | 19 (1.2%) |
| $75,000 to $99,999 | 73 (9.5%) | 188 (12.2%) |
| $100,000 to $149,999 | 197 (25.7%) | 112 (7.3%) |
| $150,000 or more | 222 (28.9%) | 350 (22.7%) |
| Total | 767 (100.0%) | 1,543 (100.0%) |
Property Value to Household Income Ratio in Leonia borough
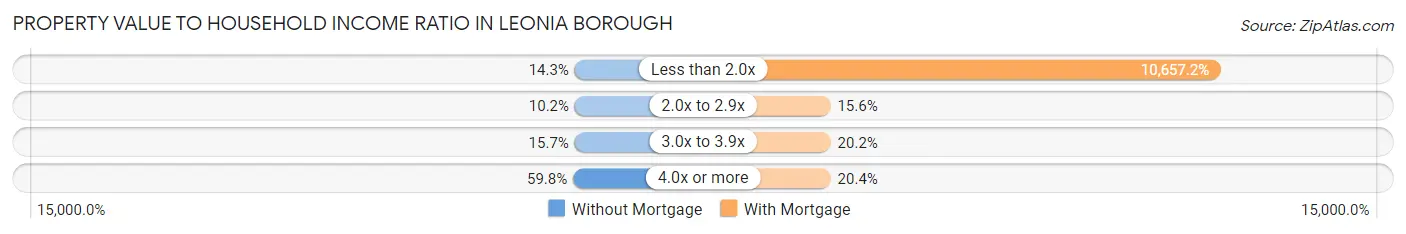
| Value-to-Income Ratio | Without Mortgage | With Mortgage |
| Less than 2.0x | 110 (14.3%) | 164,441 (10,657.2%) |
| 2.0x to 2.9x | 78 (10.2%) | 241 (15.6%) |
| 3.0x to 3.9x | 120 (15.7%) | 311 (20.2%) |
| 4.0x or more | 459 (59.8%) | 314 (20.3%) |
| Total | 767 (100.0%) | 1,543 (100.0%) |
Real Estate Taxes by Mortgage Status in Leonia borough
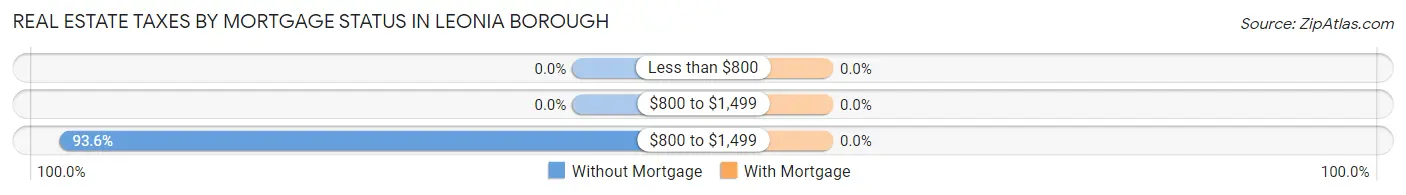
| Property Taxes | Without Mortgage | With Mortgage |
| Less than $800 | 0 (0.0%) | 0 (0.0%) |
| $800 to $1,499 | 0 (0.0%) | 0 (0.0%) |
| $800 to $1,499 | 718 (93.6%) | 0 (0.0%) |
| Total | 767 (100.0%) | 1,543 (100.0%) |
Health & Disability in Leonia borough
Health Insurance Coverage by Age in Leonia borough
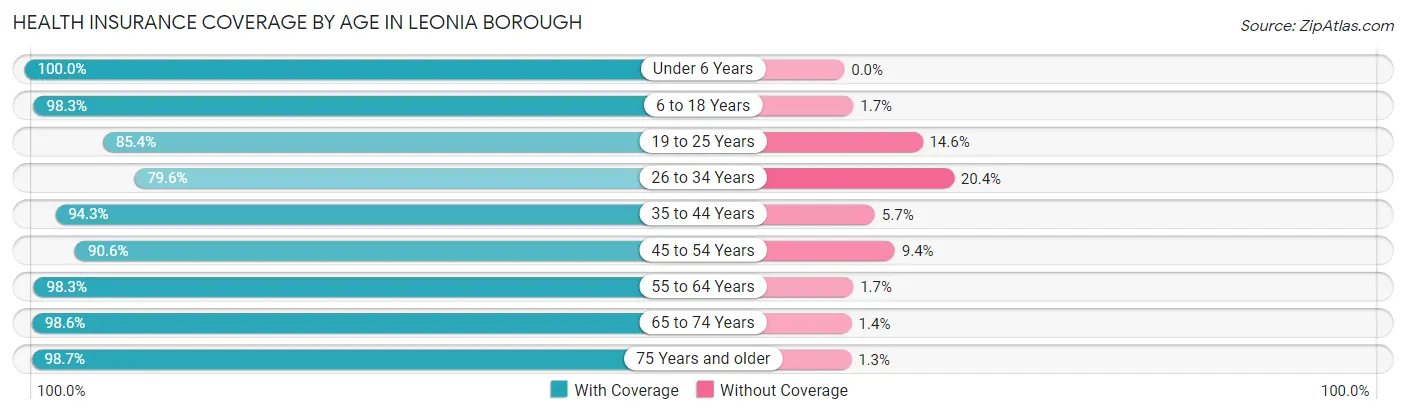
| Age Bracket | With Coverage | Without Coverage |
| Under 6 Years | 611 (100.0%) | 0 (0.0%) |
| 6 to 18 Years | 1,513 (98.3%) | 26 (1.7%) |
| 19 to 25 Years | 574 (85.4%) | 98 (14.6%) |
| 26 to 34 Years | 471 (79.6%) | 121 (20.4%) |
| 35 to 44 Years | 1,122 (94.3%) | 68 (5.7%) |
| 45 to 54 Years | 1,220 (90.6%) | 127 (9.4%) |
| 55 to 64 Years | 1,648 (98.3%) | 28 (1.7%) |
| 65 to 74 Years | 938 (98.6%) | 13 (1.4%) |
| 75 Years and older | 686 (98.7%) | 9 (1.3%) |
| Total | 8,783 (94.7%) | 490 (5.3%) |
Health Insurance Coverage by Citizenship Status in Leonia borough
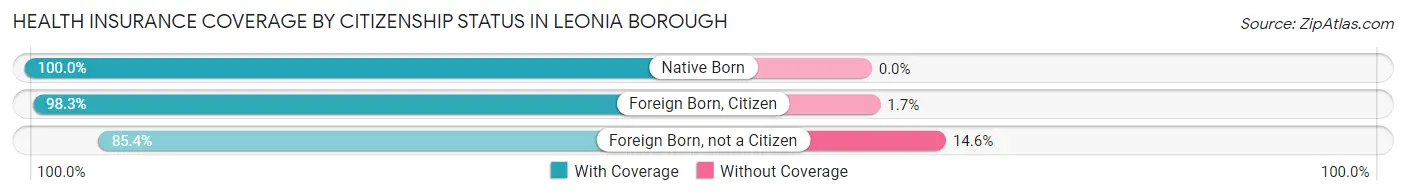
| Citizenship Status | With Coverage | Without Coverage |
| Native Born | 611 (100.0%) | 0 (0.0%) |
| Foreign Born, Citizen | 1,513 (98.3%) | 26 (1.7%) |
| Foreign Born, not a Citizen | 574 (85.4%) | 98 (14.6%) |
Health Insurance Coverage by Household Income in Leonia borough
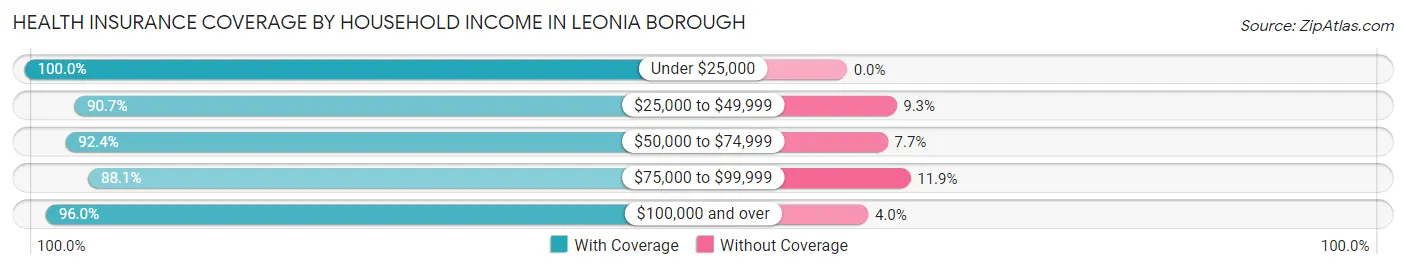
| Household Income | With Coverage | Without Coverage |
| Under $25,000 | 405 (100.0%) | 0 (0.0%) |
| $25,000 to $49,999 | 607 (90.7%) | 62 (9.3%) |
| $50,000 to $74,999 | 929 (92.3%) | 77 (7.6%) |
| $75,000 to $99,999 | 726 (88.1%) | 98 (11.9%) |
| $100,000 and over | 6,103 (96.0%) | 253 (4.0%) |
Public vs Private Health Insurance Coverage by Age in Leonia borough
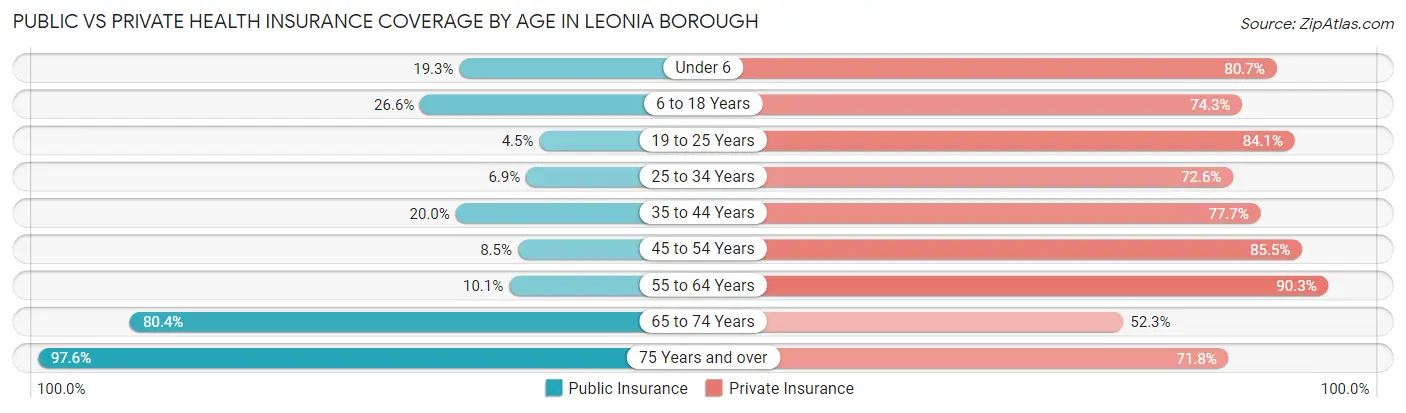
| Age Bracket | Public Insurance | Private Insurance |
| Under 6 | 118 (19.3%) | 493 (80.7%) |
| 6 to 18 Years | 409 (26.6%) | 1,144 (74.3%) |
| 19 to 25 Years | 30 (4.5%) | 565 (84.1%) |
| 25 to 34 Years | 41 (6.9%) | 430 (72.6%) |
| 35 to 44 Years | 238 (20.0%) | 925 (77.7%) |
| 45 to 54 Years | 114 (8.5%) | 1,151 (85.5%) |
| 55 to 64 Years | 169 (10.1%) | 1,514 (90.3%) |
| 65 to 74 Years | 765 (80.4%) | 497 (52.3%) |
| 75 Years and over | 678 (97.6%) | 499 (71.8%) |
| Total | 2,562 (27.6%) | 7,218 (77.8%) |
Disability Status by Sex by Age in Leonia borough
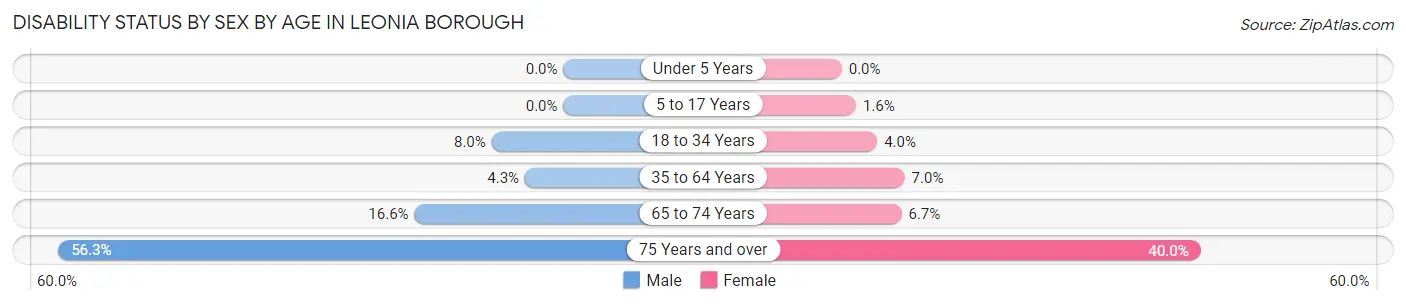
| Age Bracket | Male | Female |
| Under 5 Years | 0 (0.0%) | 0 (0.0%) |
| 5 to 17 Years | 0 (0.0%) | 11 (1.6%) |
| 18 to 34 Years | 65 (8.0%) | 22 (4.0%) |
| 35 to 64 Years | 85 (4.3%) | 156 (7.0%) |
| 65 to 74 Years | 73 (16.6%) | 34 (6.7%) |
| 75 Years and over | 153 (56.2%) | 169 (40.0%) |
Disability Class by Sex by Age in Leonia borough
Disability Class: Hearing Difficulty
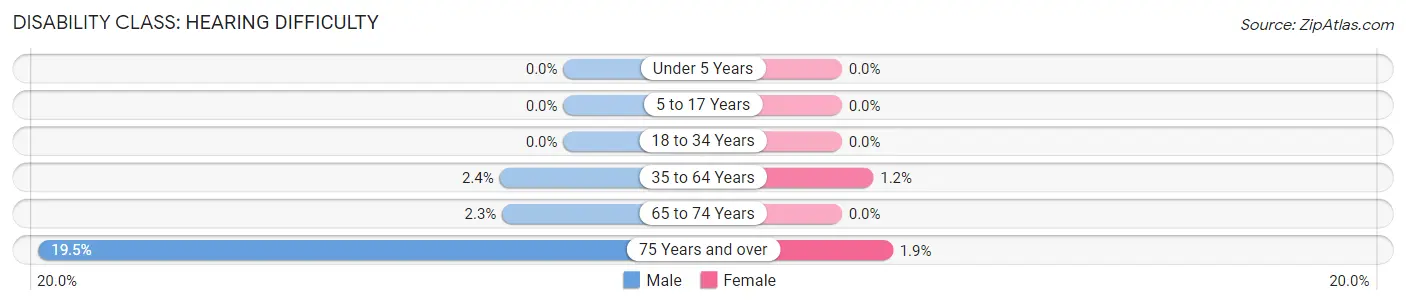
| Age Bracket | Male | Female |
| Under 5 Years | 0 (0.0%) | 0 (0.0%) |
| 5 to 17 Years | 0 (0.0%) | 0 (0.0%) |
| 18 to 34 Years | 0 (0.0%) | 0 (0.0%) |
| 35 to 64 Years | 47 (2.4%) | 26 (1.2%) |
| 65 to 74 Years | 10 (2.3%) | 0 (0.0%) |
| 75 Years and over | 53 (19.5%) | 8 (1.9%) |
Disability Class: Vision Difficulty
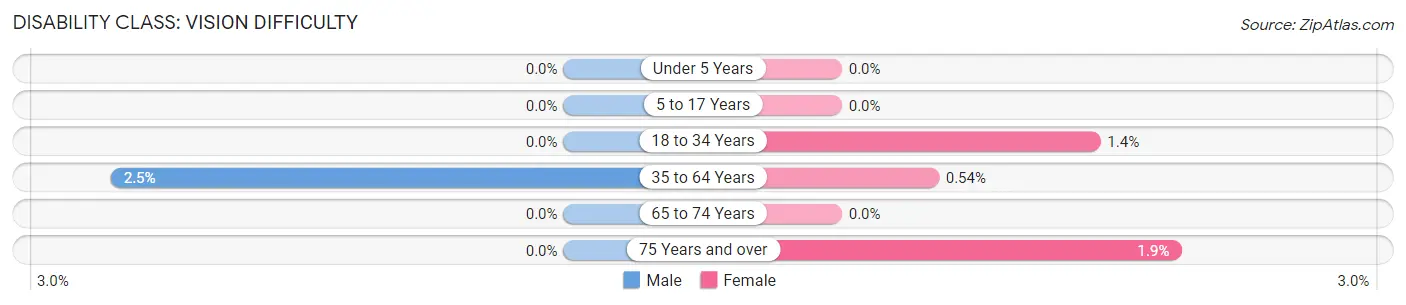
| Age Bracket | Male | Female |
| Under 5 Years | 0 (0.0%) | 0 (0.0%) |
| 5 to 17 Years | 0 (0.0%) | 0 (0.0%) |
| 18 to 34 Years | 0 (0.0%) | 8 (1.4%) |
| 35 to 64 Years | 50 (2.5%) | 12 (0.5%) |
| 65 to 74 Years | 0 (0.0%) | 0 (0.0%) |
| 75 Years and over | 0 (0.0%) | 8 (1.9%) |
Disability Class: Cognitive Difficulty
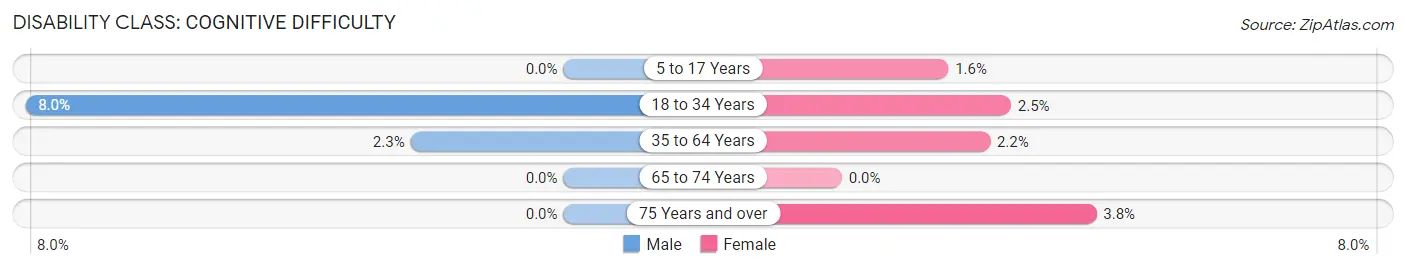
| Age Bracket | Male | Female |
| 5 to 17 Years | 0 (0.0%) | 11 (1.6%) |
| 18 to 34 Years | 65 (8.0%) | 14 (2.5%) |
| 35 to 64 Years | 45 (2.3%) | 49 (2.2%) |
| 65 to 74 Years | 0 (0.0%) | 0 (0.0%) |
| 75 Years and over | 0 (0.0%) | 16 (3.8%) |
Disability Class: Ambulatory Difficulty
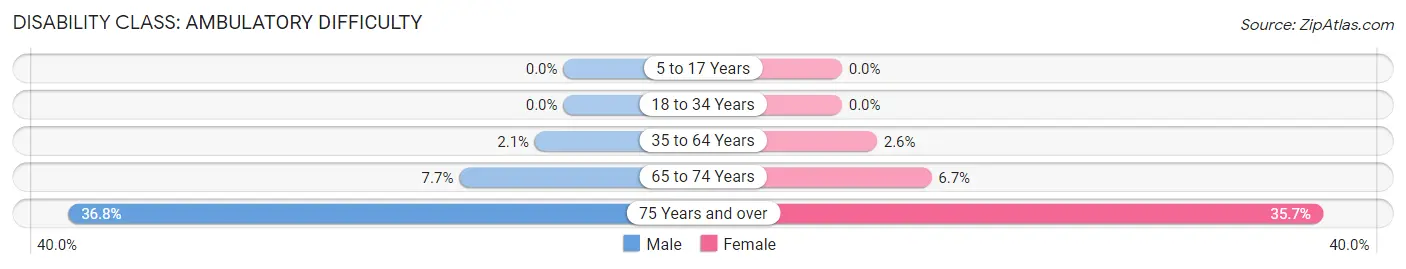
| Age Bracket | Male | Female |
| 5 to 17 Years | 0 (0.0%) | 0 (0.0%) |
| 18 to 34 Years | 0 (0.0%) | 0 (0.0%) |
| 35 to 64 Years | 42 (2.1%) | 58 (2.6%) |
| 65 to 74 Years | 34 (7.7%) | 34 (6.7%) |
| 75 Years and over | 100 (36.8%) | 151 (35.7%) |
Disability Class: Self-Care Difficulty
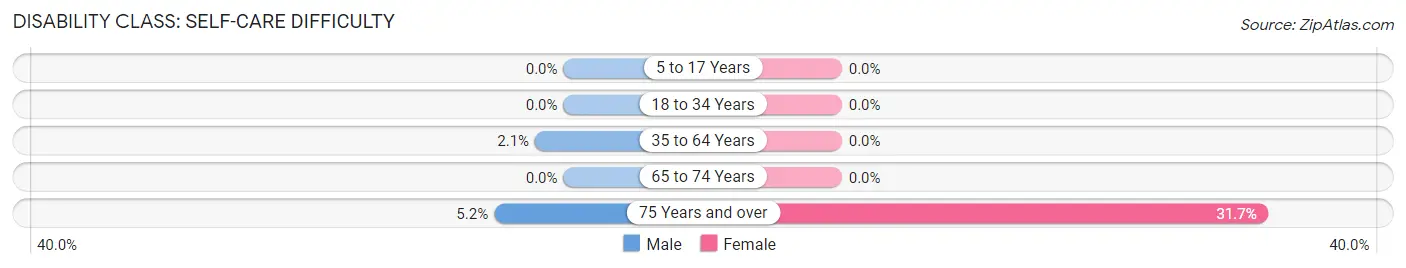
| Age Bracket | Male | Female |
| 5 to 17 Years | 0 (0.0%) | 0 (0.0%) |
| 18 to 34 Years | 0 (0.0%) | 0 (0.0%) |
| 35 to 64 Years | 42 (2.1%) | 0 (0.0%) |
| 65 to 74 Years | 0 (0.0%) | 0 (0.0%) |
| 75 Years and over | 14 (5.1%) | 134 (31.7%) |
Technology Access in Leonia borough
Computing Device Access in Leonia borough
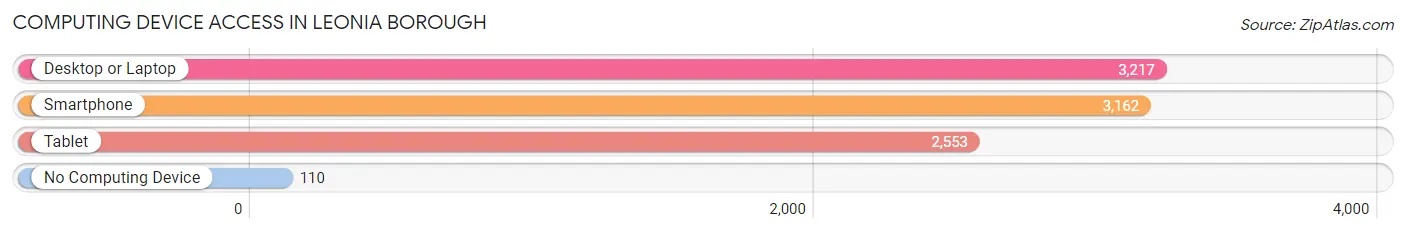
| Device Type | # Households | % Households |
| Desktop or Laptop | 3,217 | 93.7% |
| Smartphone | 3,162 | 92.1% |
| Tablet | 2,553 | 74.4% |
| No Computing Device | 110 | 3.2% |
| Total | 3,433 | 100.0% |
Internet Access in Leonia borough
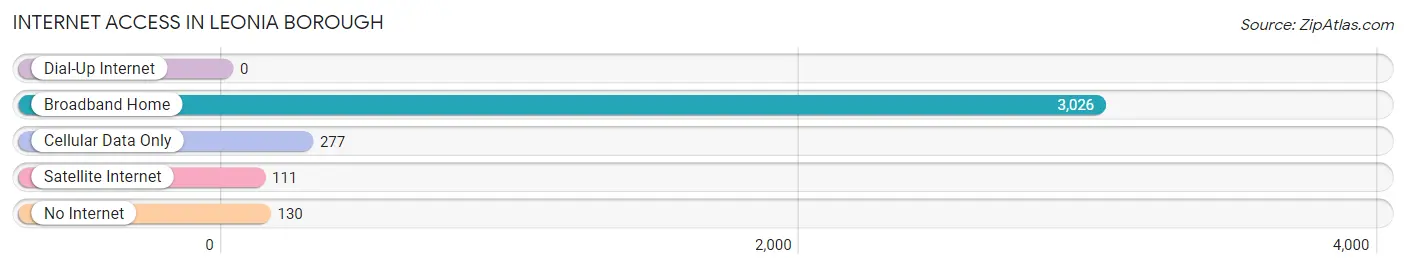
| Internet Type | # Households | % Households |
| Dial-Up Internet | 0 | 0.0% |
| Broadband Home | 3,026 | 88.1% |
| Cellular Data Only | 277 | 8.1% |
| Satellite Internet | 111 | 3.2% |
| No Internet | 130 | 3.8% |
| Total | 3,433 | 100.0% |
Leonia borough Summary
Leonia Borough is a small borough located in Bergen County, New Jersey. It is situated on the Hudson River, just north of the George Washington Bridge. The borough is home to a population of 8,937 people, according to the 2010 United States Census.
Geography
Leonia Borough is located in the northeastern corner of Bergen County, New Jersey. It is bordered by Fort Lee to the north, Englewood Cliffs to the east, Palisades Park to the south, and Ridgefield Park to the west. The borough is situated on the Hudson River, just north of the George Washington Bridge. The borough covers an area of 1.3 square miles, with a population density of 6,845 people per square mile.
The borough is divided into two distinct sections, the north and south sides. The north side is mostly residential, while the south side is mostly commercial. The borough is home to several parks, including Overpeck Park, which is located on the north side of the borough. The park features a variety of recreational activities, including a playground, basketball courts, and a walking path.
Climate
Leonia Borough has a humid subtropical climate, with hot, humid summers and cold, wet winters. The average temperature in the summer is around 75 degrees Fahrenheit, while the average temperature in the winter is around 35 degrees Fahrenheit. The average annual precipitation is around 45 inches.
Demographics
As of the 2010 United States Census, there were 8,937 people, 3,717 households, and 2,521 families residing in the borough. The population density was 6,845 people per square mile. The racial makeup of the borough was 79.2% White, 8.2% African American, 0.3% Native American, 5.7% Asian, 0.1% Pacific Islander, 4.2% from other races, and 2.3% from two or more races. Hispanic or Latino of any race were 11.7% of the population.
The median age in the borough was 41.7 years. 22.2% of residents were under the age of 18; 8.2% were between the ages of 18 and 24; 24.7% were from 25 to 44; 28.7% were from 45 to 64; and 16.2% were 65 years of age or older. The gender makeup of the borough was 48.2% male and 51.8% female.
Economy
Leonia Borough is home to a variety of businesses, including retail stores, restaurants, and professional services. The borough is also home to several corporate headquarters, including the headquarters of the New York Stock Exchange. The borough is also home to a number of manufacturing companies, including the Leonia Manufacturing Company, which produces a variety of products, including furniture, clothing, and electronics.
The median household income in the borough was $76,945, and the median family income was $90,945. The per capita income for the borough was $37,945. About 4.2% of families and 5.7% of the population were below the poverty line, including 6.3% of those under age 18 and 4.2% of those age 65 or over.
Conclusion
Leonia Borough is a small borough located in Bergen County, New Jersey. It is situated on the Hudson River, just north of the George Washington Bridge. The borough is home to a population of 8,937 people, according to the 2010 United States Census. The borough is divided into two distinct sections, the north and south sides. The north side is mostly residential, while the south side is mostly commercial. The borough is home to several parks, including Overpeck Park, which is located on the north side of the borough. The borough is home to a variety of businesses, including retail stores, restaurants, and professional services. The median household income in the borough was $76,945, and the median family income was $90,945. The per capita income for the borough was $37,945.
Common Questions
What is Per Capita Income in Leonia borough?
Per Capita income in Leonia borough is $62,031.
What is the Median Family Income in Leonia borough?
Median Family Income in Leonia borough is $128,571.
What is the Median Household income in Leonia borough?
Median Household Income in Leonia borough is $110,679.
What is Income or Wage Gap in Leonia borough?
Income or Wage Gap in Leonia borough is 13.7%.
Women in Leonia borough earn 86.3 cents for every dollar earned by a man.
What is Inequality or Gini Index in Leonia borough?
Inequality or Gini Index in Leonia borough is 0.48.
What is the Total Population of Leonia borough?
Total Population of Leonia borough is 9,273.
What is the Total Male Population of Leonia borough?
Total Male Population of Leonia borough is 4,516.
What is the Total Female Population of Leonia borough?
Total Female Population of Leonia borough is 4,757.
What is the Ratio of Males per 100 Females in Leonia borough?
There are 94.93 Males per 100 Females in Leonia borough.
What is the Ratio of Females per 100 Males in Leonia borough?
There are 105.34 Females per 100 Males in Leonia borough.
What is the Median Population Age in Leonia borough?
Median Population Age in Leonia borough is 45.4 Years.
What is the Average Family Size in Leonia borough
Average Family Size in Leonia borough is 3.2 People.
What is the Average Household Size in Leonia borough
Average Household Size in Leonia borough is 2.7 People.
How Large is the Labor Force in Leonia borough?
There are 5,063 People in the Labor Forcein in Leonia borough.
What is the Percentage of People in the Labor Force in Leonia borough?
66.8% of People are in the Labor Force in Leonia borough.
What is the Unemployment Rate in Leonia borough?
Unemployment Rate in Leonia borough is 4.6%.