Allendale borough, NJ Map & Demographics
Allendale borough Overview
$92,202
PER CAPITA INCOME
$206,615
AVG FAMILY INCOME
$163,875
AVG HOUSEHOLD INCOME
59.3%
WAGE / INCOME GAP [ % ]
40.7¢/ $1
WAGE / INCOME GAP [ $ ]
0.52
INEQUALITY / GINI INDEX
6,817
TOTAL POPULATION
3,186
MALE POPULATION
3,631
FEMALE POPULATION
87.74
MALES / 100 FEMALES
113.97
FEMALES / 100 MALES
45.7
MEDIAN AGE
3.5
AVG FAMILY SIZE
3.0
AVG HOUSEHOLD SIZE
3,089
LABOR FORCE [ PEOPLE ]
59.7%
PERCENT IN LABOR FORCE
3.6%
UNEMPLOYMENT RATE
Income in Allendale borough
Income Overview in Allendale borough
Per Capita Income in Allendale borough is $92,202, while median incomes of families and households are $206,615 and $163,875 respectively.
| Characteristic | Number | Measure |
| Per Capita Income | 6,817 | $92,202 |
| Median Family Income | 1,781 | $206,615 |
| Mean Family Income | 1,781 | $328,787 |
| Median Household Income | 2,271 | $163,875 |
| Mean Household Income | 2,271 | $271,151 |
| Income Deficit | 1,781 | $0 |
| Wage / Income Gap (%) | 6,817 | 59.27% |
| Wage / Income Gap ($) | 6,817 | 40.73¢ per $1 |
| Gini / Inequality Index | 6,817 | 0.52 |
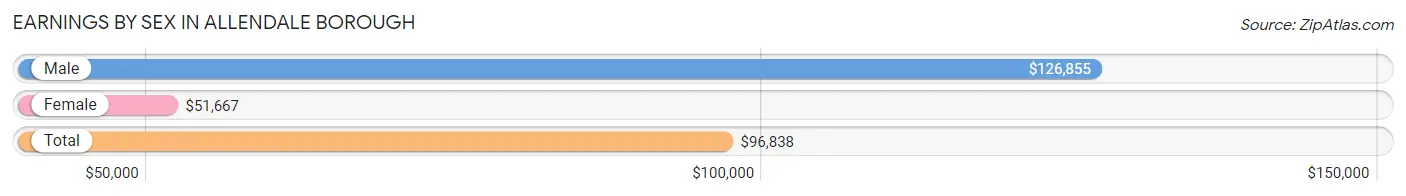
Earnings by Sex in Allendale borough
Average Earnings in Allendale borough are $96,838, $126,855 for men and $51,667 for women, a difference of 59.3%.
| Sex | Number | Average Earnings |
| Male | 1,720 (53.5%) | $126,855 |
| Female | 1,492 (46.5%) | $51,667 |
| Total | 3,212 (100.0%) | $96,838 |
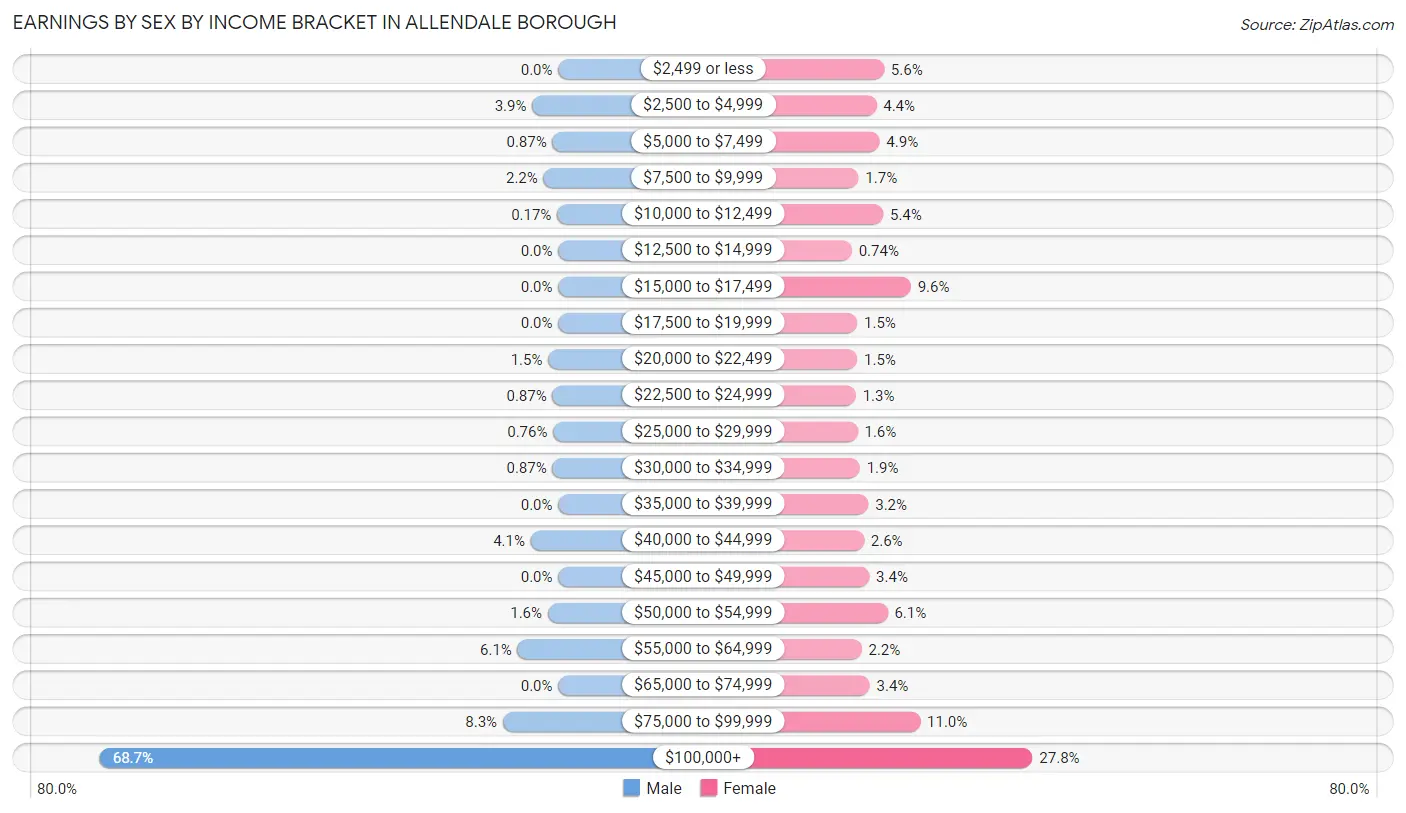
Earnings by Sex by Income Bracket in Allendale borough
The most common earnings brackets in Allendale borough are $100,000+ for men (1,182 | 68.7%) and $100,000+ for women (415 | 27.8%).
| Income | Male | Female |
| $2,499 or less | 0 (0.0%) | 83 (5.6%) |
| $2,500 to $4,999 | 67 (3.9%) | 66 (4.4%) |
| $5,000 to $7,499 | 15 (0.9%) | 73 (4.9%) |
| $7,500 to $9,999 | 38 (2.2%) | 26 (1.7%) |
| $10,000 to $12,499 | 3 (0.2%) | 81 (5.4%) |
| $12,500 to $14,999 | 0 (0.0%) | 11 (0.7%) |
| $15,000 to $17,499 | 0 (0.0%) | 143 (9.6%) |
| $17,500 to $19,999 | 0 (0.0%) | 23 (1.5%) |
| $20,000 to $22,499 | 26 (1.5%) | 23 (1.5%) |
| $22,500 to $24,999 | 15 (0.9%) | 20 (1.3%) |
| $25,000 to $29,999 | 13 (0.8%) | 24 (1.6%) |
| $30,000 to $34,999 | 15 (0.9%) | 29 (1.9%) |
| $35,000 to $39,999 | 0 (0.0%) | 48 (3.2%) |
| $40,000 to $44,999 | 71 (4.1%) | 38 (2.5%) |
| $45,000 to $49,999 | 0 (0.0%) | 50 (3.4%) |
| $50,000 to $54,999 | 27 (1.6%) | 91 (6.1%) |
| $55,000 to $64,999 | 105 (6.1%) | 33 (2.2%) |
| $65,000 to $74,999 | 0 (0.0%) | 51 (3.4%) |
| $75,000 to $99,999 | 143 (8.3%) | 164 (11.0%) |
| $100,000+ | 1,182 (68.7%) | 415 (27.8%) |
| Total | 1,720 (100.0%) | 1,492 (100.0%) |
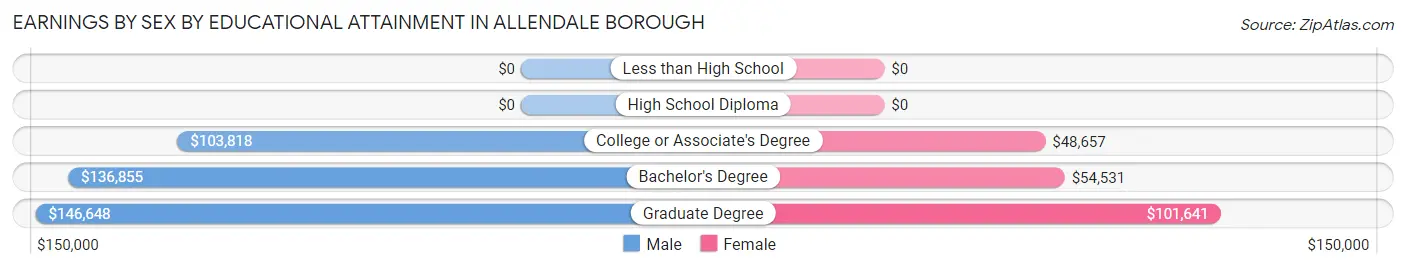
Earnings by Sex by Educational Attainment in Allendale borough
Average earnings in Allendale borough are $135,409 for men and $67,857 for women, a difference of 49.9%. Men with an educational attainment of graduate degree enjoy the highest average annual earnings of $146,648, while those with college or associate's degree education earn the least with $103,818. Women with an educational attainment of graduate degree earn the most with the average annual earnings of $101,641, while those with college or associate's degree education have the smallest earnings of $48,657.
| Educational Attainment | Male Income | Female Income |
| Less than High School | - | - |
| High School Diploma | - | - |
| College or Associate's Degree | $103,818 | $48,657 |
| Bachelor's Degree | $136,855 | $54,531 |
| Graduate Degree | $146,648 | $101,641 |
| Total | $135,409 | $67,857 |
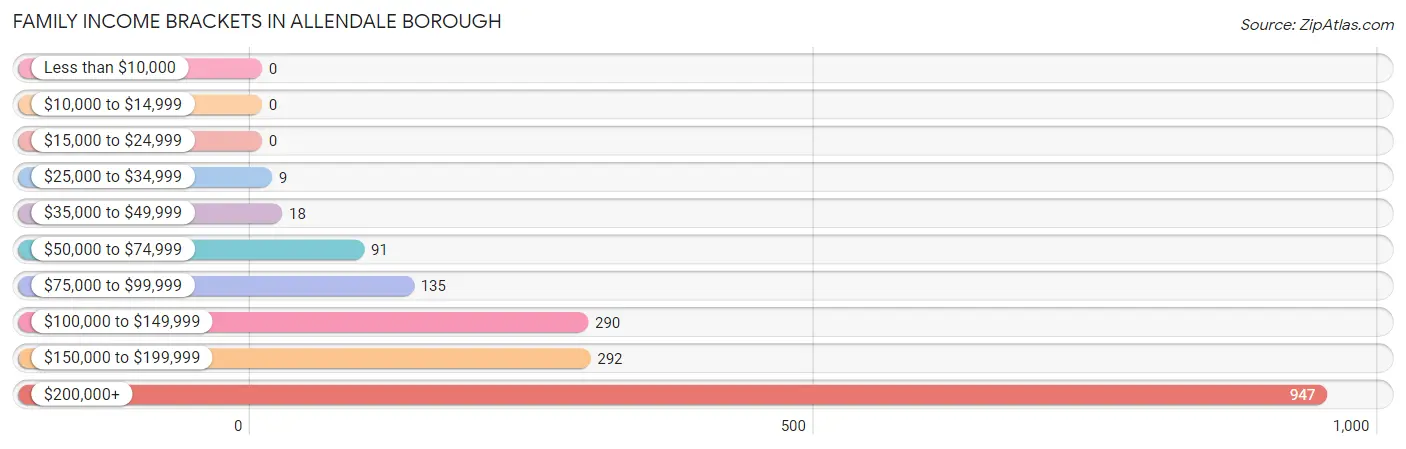
Family Income in Allendale borough
Family Income Brackets in Allendale borough
According to the Allendale borough family income data, there are 947 families falling into the $200,000+ income range, which is the most common income bracket and makes up 53.2% of all families.
| Income Bracket | # Families | % Families |
| Less than $10,000 | 0 | 0.0% |
| $10,000 to $14,999 | 0 | 0.0% |
| $15,000 to $24,999 | 0 | 0.0% |
| $25,000 to $34,999 | 9 | 0.5% |
| $35,000 to $49,999 | 18 | 1.0% |
| $50,000 to $74,999 | 91 | 5.1% |
| $75,000 to $99,999 | 135 | 7.6% |
| $100,000 to $149,999 | 290 | 16.3% |
| $150,000 to $199,999 | 292 | 16.4% |
| $200,000+ | 947 | 53.2% |
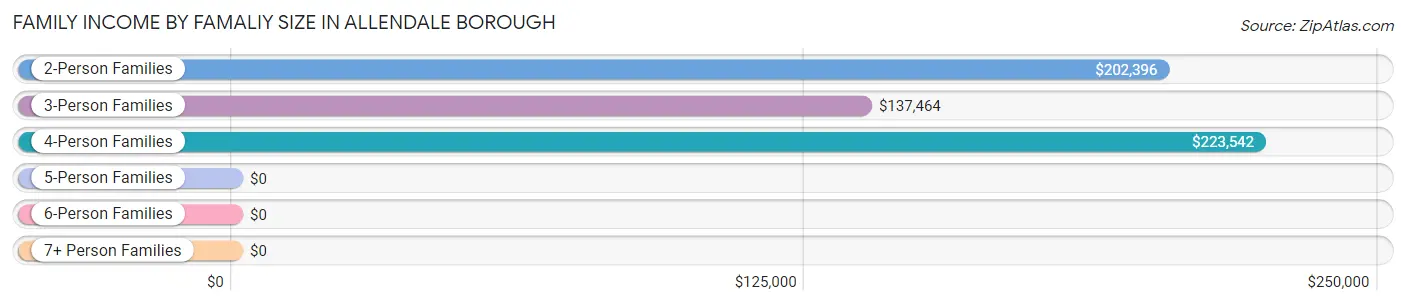
Family Income by Famaliy Size in Allendale borough
4-person families (576 | 32.3%) account for the highest median family income in Allendale borough with $223,542 per family, while 2-person families (463 | 26.0%) have the highest median income of $101,198 per family member.
| Income Bracket | # Families | Median Income |
| 2-Person Families | 463 (26.0%) | $202,396 |
| 3-Person Families | 478 (26.8%) | $137,464 |
| 4-Person Families | 576 (32.3%) | $223,542 |
| 5-Person Families | 233 (13.1%) | $0 |
| 6-Person Families | 31 (1.7%) | $0 |
| 7+ Person Families | 0 (0.0%) | $0 |
| Total | 1,781 (100.0%) | $206,615 |
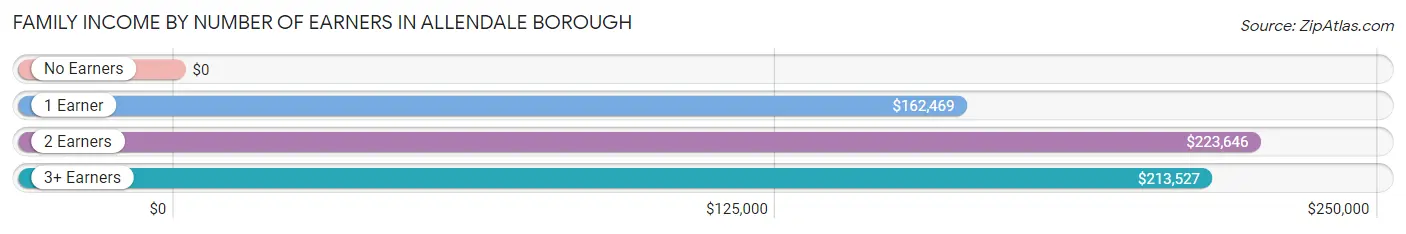
Family Income by Number of Earners in Allendale borough
| Number of Earners | # Families | Median Income |
| No Earners | 220 (12.3%) | $0 |
| 1 Earner | 587 (33.0%) | $162,469 |
| 2 Earners | 703 (39.5%) | $223,646 |
| 3+ Earners | 271 (15.2%) | $213,527 |
| Total | 1,781 (100.0%) | $206,615 |
Household Income in Allendale borough
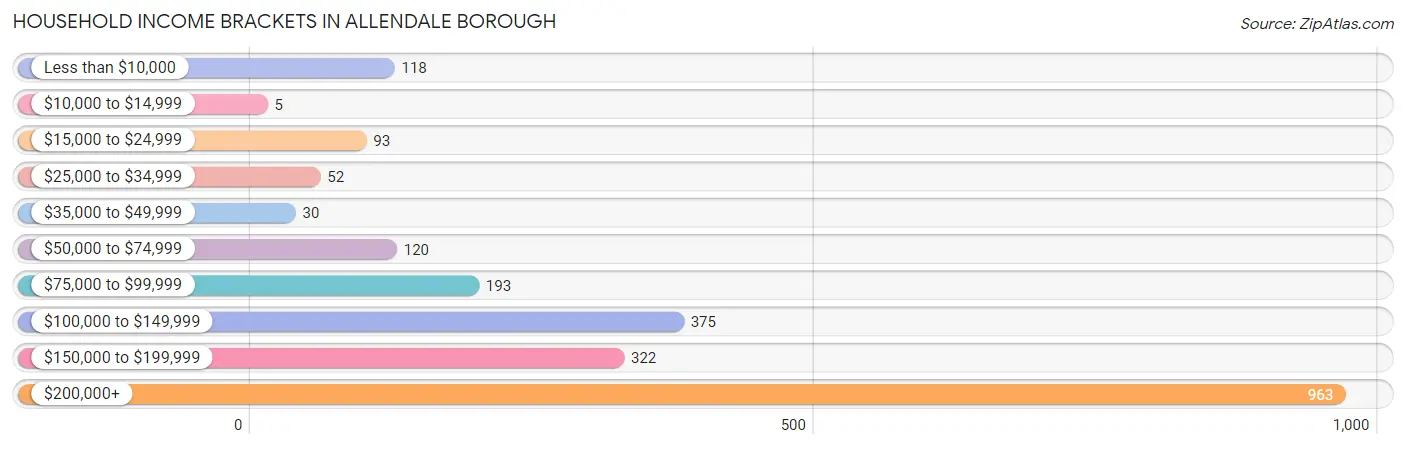
Household Income Brackets in Allendale borough
With 963 households falling in the category, the $200,000+ income range is the most frequent in Allendale borough, accounting for 42.4% of all households. In contrast, only 5 households (0.2%) fall into the $10,000 to $14,999 income bracket, making it the least populous group.
| Income Bracket | # Households | % Households |
| Less than $10,000 | 118 | 5.2% |
| $10,000 to $14,999 | 5 | 0.2% |
| $15,000 to $24,999 | 93 | 4.1% |
| $25,000 to $34,999 | 52 | 2.3% |
| $35,000 to $49,999 | 30 | 1.3% |
| $50,000 to $74,999 | 120 | 5.3% |
| $75,000 to $99,999 | 193 | 8.5% |
| $100,000 to $149,999 | 375 | 16.5% |
| $150,000 to $199,999 | 322 | 14.2% |
| $200,000+ | 963 | 42.4% |
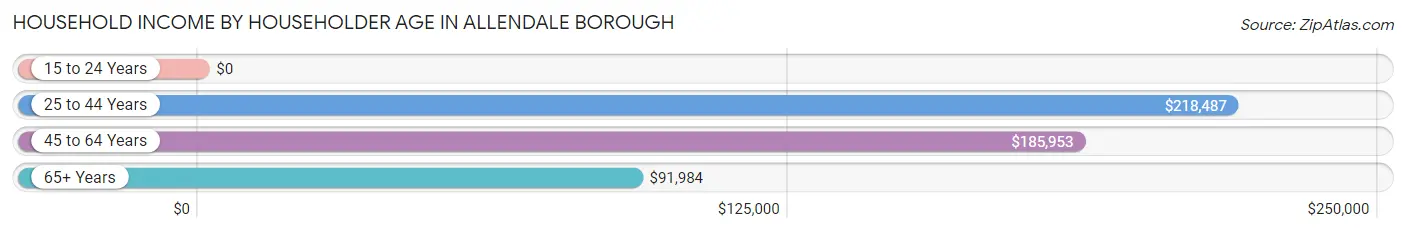
Household Income by Householder Age in Allendale borough
The median household income in Allendale borough is $163,875, with the highest median household income of $218,487 found in the 25 to 44 years age bracket for the primary householder. A total of 395 households (17.4%) fall into this category.
| Income Bracket | # Households | Median Income |
| 15 to 24 Years | 0 (0.0%) | $0 |
| 25 to 44 Years | 395 (17.4%) | $218,487 |
| 45 to 64 Years | 1,241 (54.6%) | $185,953 |
| 65+ Years | 635 (28.0%) | $91,984 |
| Total | 2,271 (100.0%) | $163,875 |
Poverty in Allendale borough
Income Below Poverty by Sex and Age in Allendale borough
With 2.1% poverty level for males and 2.8% for females among the residents of Allendale borough, 65 to 74 year old males and 75 year old and over females are the most vulnerable to poverty, with 58 males (21.1%) and 47 females (19.4%) in their respective age groups living below the poverty level.
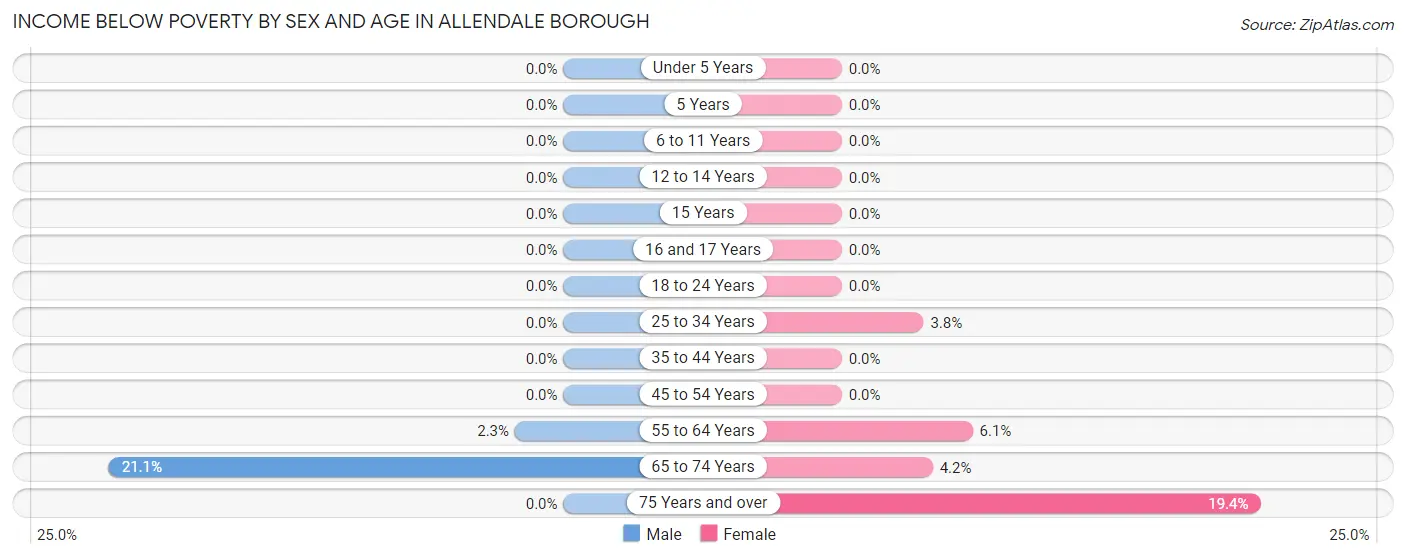
| Age Bracket | Male | Female |
| Under 5 Years | 0 (0.0%) | 0 (0.0%) |
| 5 Years | 0 (0.0%) | 0 (0.0%) |
| 6 to 11 Years | 0 (0.0%) | 0 (0.0%) |
| 12 to 14 Years | 0 (0.0%) | 0 (0.0%) |
| 15 Years | 0 (0.0%) | 0 (0.0%) |
| 16 and 17 Years | 0 (0.0%) | 0 (0.0%) |
| 18 to 24 Years | 0 (0.0%) | 0 (0.0%) |
| 25 to 34 Years | 0 (0.0%) | 5 (3.8%) |
| 35 to 44 Years | 0 (0.0%) | 0 (0.0%) |
| 45 to 54 Years | 0 (0.0%) | 0 (0.0%) |
| 55 to 64 Years | 10 (2.2%) | 32 (6.1%) |
| 65 to 74 Years | 58 (21.1%) | 17 (4.2%) |
| 75 Years and over | 0 (0.0%) | 47 (19.4%) |
| Total | 68 (2.1%) | 101 (2.8%) |
Income Above Poverty by Sex and Age in Allendale borough
According to the poverty statistics in Allendale borough, males aged under 5 years and females aged under 5 years are the age groups that are most secure financially, with 100.0% of males and 100.0% of females in these age groups living above the poverty line.
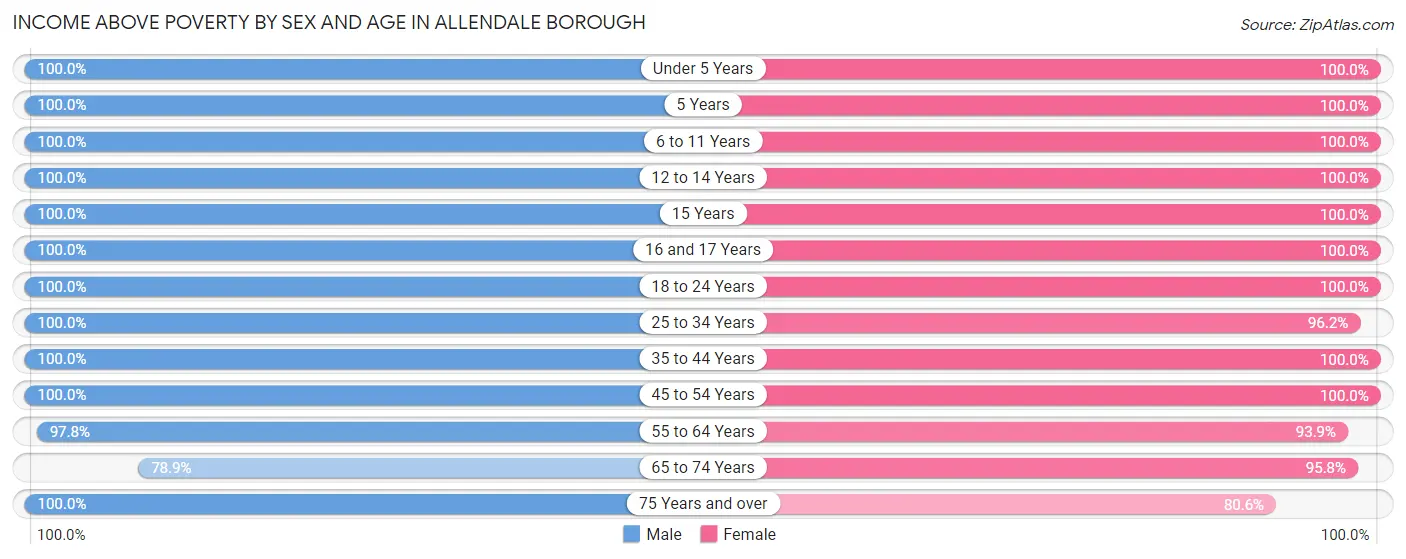
| Age Bracket | Male | Female |
| Under 5 Years | 314 (100.0%) | 73 (100.0%) |
| 5 Years | 64 (100.0%) | 38 (100.0%) |
| 6 to 11 Years | 249 (100.0%) | 447 (100.0%) |
| 12 to 14 Years | 112 (100.0%) | 210 (100.0%) |
| 15 Years | 41 (100.0%) | 95 (100.0%) |
| 16 and 17 Years | 134 (100.0%) | 157 (100.0%) |
| 18 to 24 Years | 138 (100.0%) | 196 (100.0%) |
| 25 to 34 Years | 147 (100.0%) | 127 (96.2%) |
| 35 to 44 Years | 298 (100.0%) | 403 (100.0%) |
| 45 to 54 Years | 749 (100.0%) | 657 (100.0%) |
| 55 to 64 Years | 434 (97.8%) | 495 (93.9%) |
| 65 to 74 Years | 217 (78.9%) | 386 (95.8%) |
| 75 Years and over | 195 (100.0%) | 195 (80.6%) |
| Total | 3,092 (97.9%) | 3,479 (97.2%) |
Income Below Poverty Among Married-Couple Families in Allendale borough
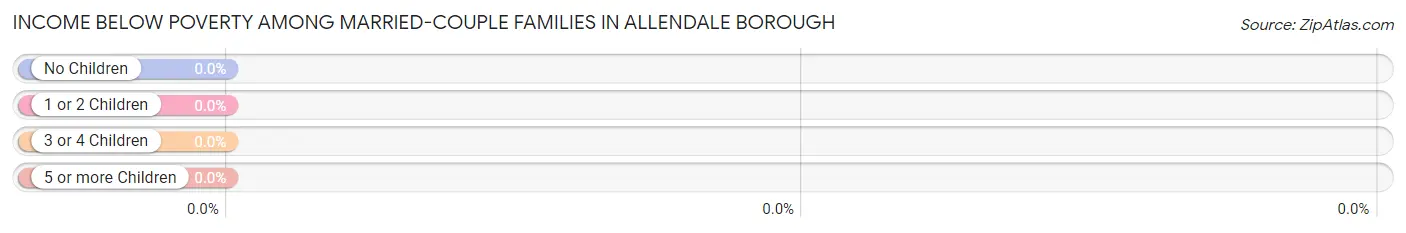
| Children | Above Poverty | Below Poverty |
| No Children | 611 (100.0%) | 0 (0.0%) |
| 1 or 2 Children | 968 (100.0%) | 0 (0.0%) |
| 3 or 4 Children | 95 (100.0%) | 0 (0.0%) |
| 5 or more Children | 0 (0.0%) | 0 (0.0%) |
| Total | 1,674 (100.0%) | 0 (0.0%) |
Income Below Poverty Among Single-Parent Households in Allendale borough
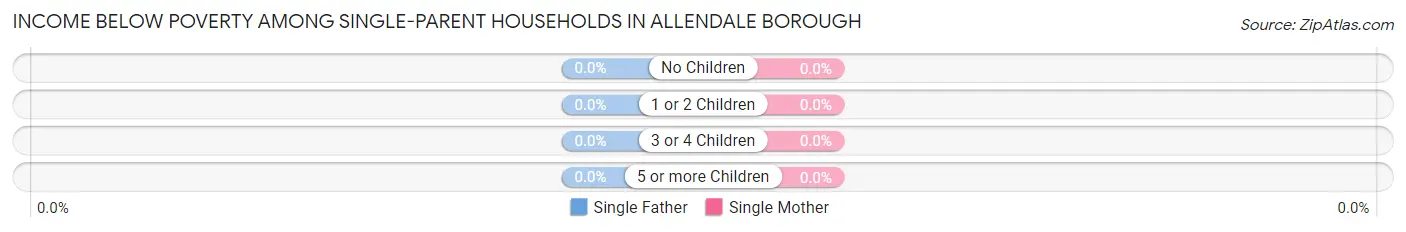
| Children | Single Father | Single Mother |
| No Children | 0 (0.0%) | 0 (0.0%) |
| 1 or 2 Children | 0 (0.0%) | 0 (0.0%) |
| 3 or 4 Children | 0 (0.0%) | 0 (0.0%) |
| 5 or more Children | 0 (0.0%) | 0 (0.0%) |
| Total | 0 (0.0%) | 0 (0.0%) |
Income Below Poverty Among Married-Couple vs Single-Parent Households in Allendale borough
| Children | Married-Couple Families | Single-Parent Households |
| No Children | 0 (0.0%) | 0 (0.0%) |
| 1 or 2 Children | 0 (0.0%) | 0 (0.0%) |
| 3 or 4 Children | 0 (0.0%) | 0 (0.0%) |
| 5 or more Children | 0 (0.0%) | 0 (0.0%) |
| Total | 0 (0.0%) | 0 (0.0%) |
Race in Allendale borough
The most populous races in Allendale borough are White / Caucasian (5,186 | 76.1%), Asian (1,094 | 16.1%), and Two or more Races (480 | 7.0%).
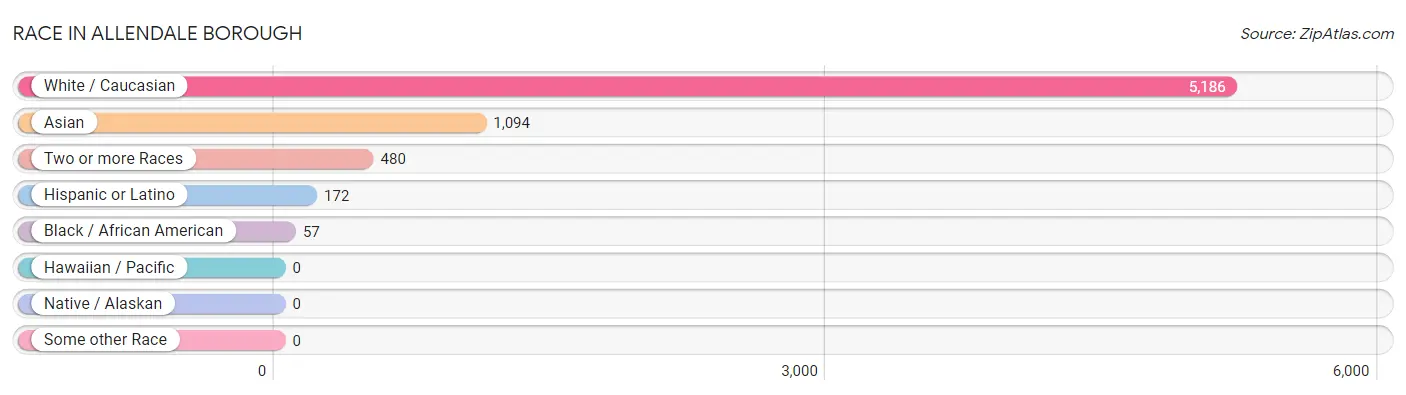
| Race | # Population | % Population |
| Asian | 1,094 | 16.1% |
| Black / African American | 57 | 0.8% |
| Hawaiian / Pacific | 0 | 0.0% |
| Hispanic or Latino | 172 | 2.5% |
| Native / Alaskan | 0 | 0.0% |
| White / Caucasian | 5,186 | 76.1% |
| Two or more Races | 480 | 7.0% |
| Some other Race | 0 | 0.0% |
| Total | 6,817 | 100.0% |
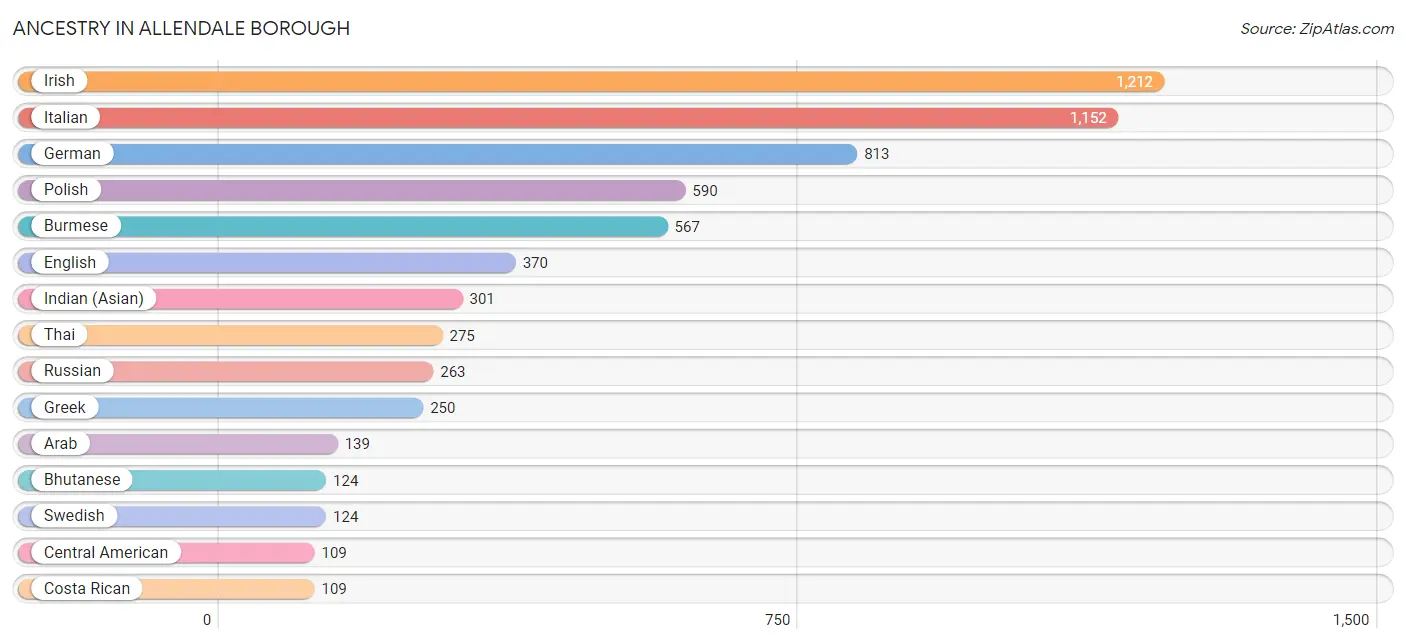
Ancestry in Allendale borough
The most populous ancestries reported in Allendale borough are Irish (1,212 | 17.8%), Italian (1,152 | 16.9%), German (813 | 11.9%), Polish (590 | 8.6%), and Burmese (567 | 8.3%), together accounting for 63.6% of all Allendale borough residents.
| Ancestry | # Population | % Population |
| American | 92 | 1.3% |
| Arab | 139 | 2.0% |
| Armenian | 25 | 0.4% |
| Austrian | 17 | 0.3% |
| Belgian | 9 | 0.1% |
| Bhutanese | 124 | 1.8% |
| Brazilian | 70 | 1.0% |
| British | 21 | 0.3% |
| Burmese | 567 | 8.3% |
| Central American | 109 | 1.6% |
| Colombian | 1 | 0.0% |
| Costa Rican | 109 | 1.6% |
| Creek | 3 | 0.0% |
| Croatian | 18 | 0.3% |
| Czech | 12 | 0.2% |
| Danish | 74 | 1.1% |
| Dominican | 19 | 0.3% |
| Dutch | 105 | 1.5% |
| Eastern European | 37 | 0.5% |
| Egyptian | 82 | 1.2% |
| English | 370 | 5.4% |
| Estonian | 10 | 0.2% |
| European | 48 | 0.7% |
| French | 102 | 1.5% |
| French Canadian | 22 | 0.3% |
| German | 813 | 11.9% |
| Greek | 250 | 3.7% |
| Hungarian | 31 | 0.4% |
| Indian (Asian) | 301 | 4.4% |
| Irish | 1,212 | 17.8% |
| Italian | 1,152 | 16.9% |
| Latvian | 9 | 0.1% |
| Lebanese | 57 | 0.8% |
| Macedonian | 48 | 0.7% |
| Northern European | 34 | 0.5% |
| Norwegian | 46 | 0.7% |
| Polish | 590 | 8.6% |
| Portuguese | 22 | 0.3% |
| Russian | 263 | 3.9% |
| Scotch-Irish | 26 | 0.4% |
| Scottish | 89 | 1.3% |
| Serbian | 72 | 1.1% |
| Slovak | 52 | 0.8% |
| South American | 15 | 0.2% |
| Spaniard | 29 | 0.4% |
| Swedish | 124 | 1.8% |
| Swiss | 15 | 0.2% |
| Thai | 275 | 4.0% |
| Ukrainian | 56 | 0.8% |
| Uruguayan | 14 | 0.2% |
| Welsh | 16 | 0.2% | View All 51 Rows |
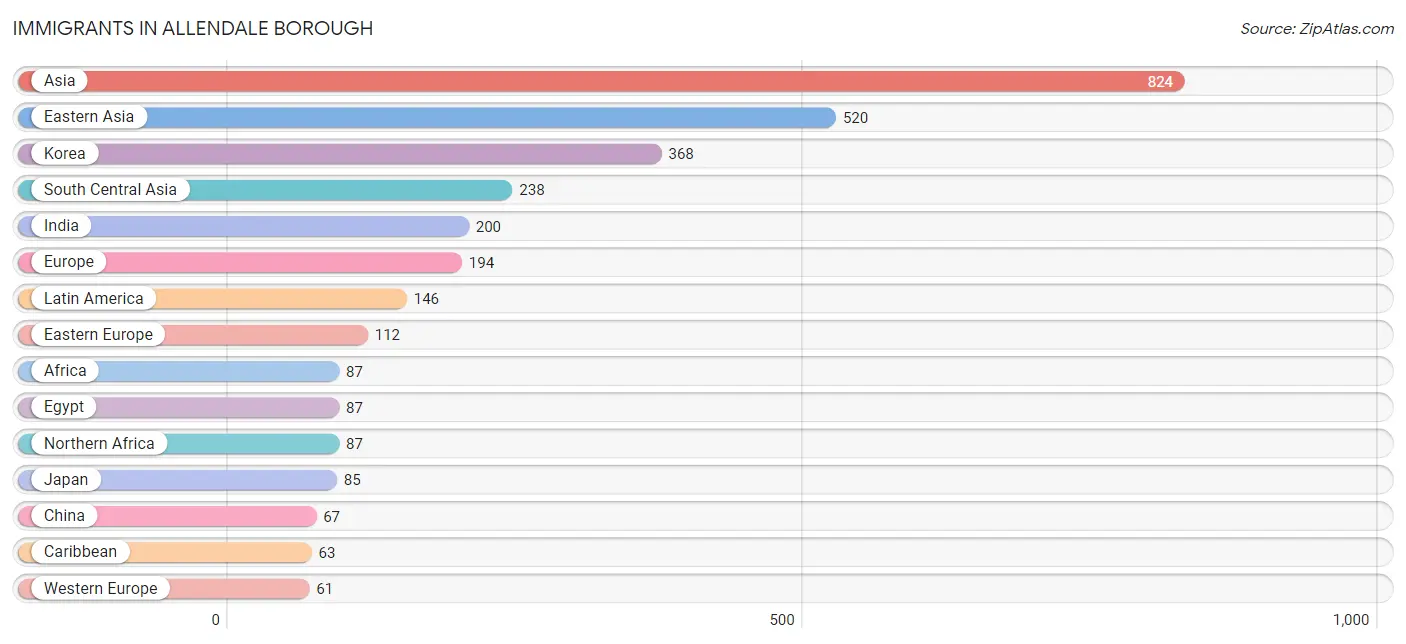
Immigrants in Allendale borough
The most numerous immigrant groups reported in Allendale borough came from Asia (824 | 12.1%), Eastern Asia (520 | 7.6%), Korea (368 | 5.4%), South Central Asia (238 | 3.5%), and India (200 | 2.9%), together accounting for 31.5% of all Allendale borough residents.
| Immigration Origin | # Population | % Population |
| Africa | 87 | 1.3% |
| Armenia | 19 | 0.3% |
| Asia | 824 | 12.1% |
| Belgium | 9 | 0.1% |
| Brazil | 22 | 0.3% |
| Canada | 16 | 0.2% |
| Caribbean | 63 | 0.9% |
| Central America | 60 | 0.9% |
| China | 67 | 1.0% |
| Colombia | 1 | 0.0% |
| Costa Rica | 60 | 0.9% |
| Dominican Republic | 19 | 0.3% |
| Eastern Asia | 520 | 7.6% |
| Eastern Europe | 112 | 1.6% |
| Egypt | 87 | 1.3% |
| Europe | 194 | 2.9% |
| France | 44 | 0.6% |
| Germany | 8 | 0.1% |
| Hong Kong | 15 | 0.2% |
| India | 200 | 2.9% |
| Iraq | 5 | 0.1% |
| Japan | 85 | 1.3% |
| Korea | 368 | 5.4% |
| Latin America | 146 | 2.1% |
| Lebanon | 21 | 0.3% |
| Malaysia | 20 | 0.3% |
| North Macedonia | 23 | 0.3% |
| Northern Africa | 87 | 1.3% |
| Northern Europe | 21 | 0.3% |
| Pakistan | 23 | 0.3% |
| Poland | 32 | 0.5% |
| Russia | 57 | 0.8% |
| South America | 23 | 0.3% |
| South Central Asia | 238 | 3.5% |
| South Eastern Asia | 21 | 0.3% |
| Trinidad and Tobago | 29 | 0.4% |
| Uzbekistan | 15 | 0.2% |
| Vietnam | 1 | 0.0% |
| Western Asia | 45 | 0.7% |
| Western Europe | 61 | 0.9% | View All 40 Rows |
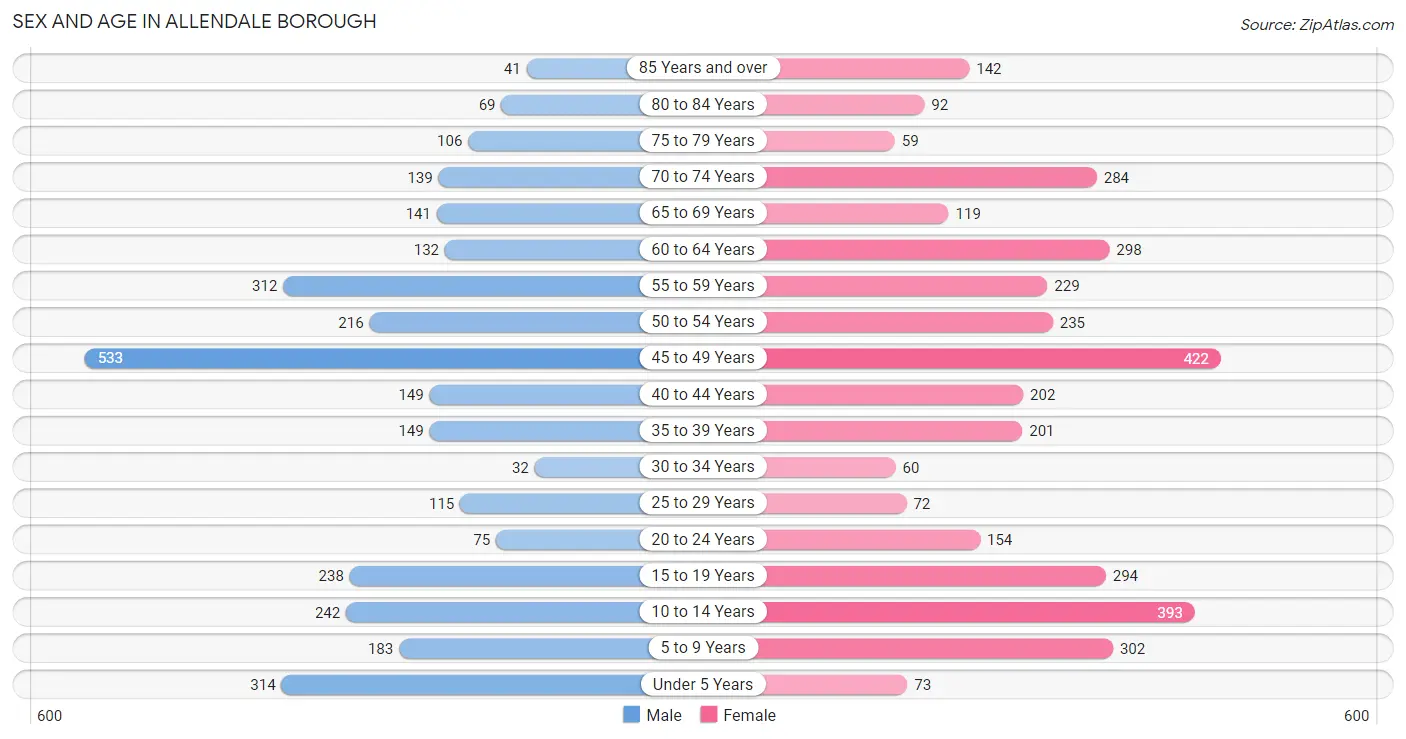
Sex and Age in Allendale borough
Sex and Age in Allendale borough
The most populous age groups in Allendale borough are 45 to 49 Years (533 | 16.7%) for men and 45 to 49 Years (422 | 11.6%) for women.
| Age Bracket | Male | Female |
| Under 5 Years | 314 (9.9%) | 73 (2.0%) |
| 5 to 9 Years | 183 (5.7%) | 302 (8.3%) |
| 10 to 14 Years | 242 (7.6%) | 393 (10.8%) |
| 15 to 19 Years | 238 (7.5%) | 294 (8.1%) |
| 20 to 24 Years | 75 (2.4%) | 154 (4.2%) |
| 25 to 29 Years | 115 (3.6%) | 72 (2.0%) |
| 30 to 34 Years | 32 (1.0%) | 60 (1.7%) |
| 35 to 39 Years | 149 (4.7%) | 201 (5.5%) |
| 40 to 44 Years | 149 (4.7%) | 202 (5.6%) |
| 45 to 49 Years | 533 (16.7%) | 422 (11.6%) |
| 50 to 54 Years | 216 (6.8%) | 235 (6.5%) |
| 55 to 59 Years | 312 (9.8%) | 229 (6.3%) |
| 60 to 64 Years | 132 (4.1%) | 298 (8.2%) |
| 65 to 69 Years | 141 (4.4%) | 119 (3.3%) |
| 70 to 74 Years | 139 (4.4%) | 284 (7.8%) |
| 75 to 79 Years | 106 (3.3%) | 59 (1.6%) |
| 80 to 84 Years | 69 (2.2%) | 92 (2.5%) |
| 85 Years and over | 41 (1.3%) | 142 (3.9%) |
| Total | 3,186 (100.0%) | 3,631 (100.0%) |
Families and Households in Allendale borough
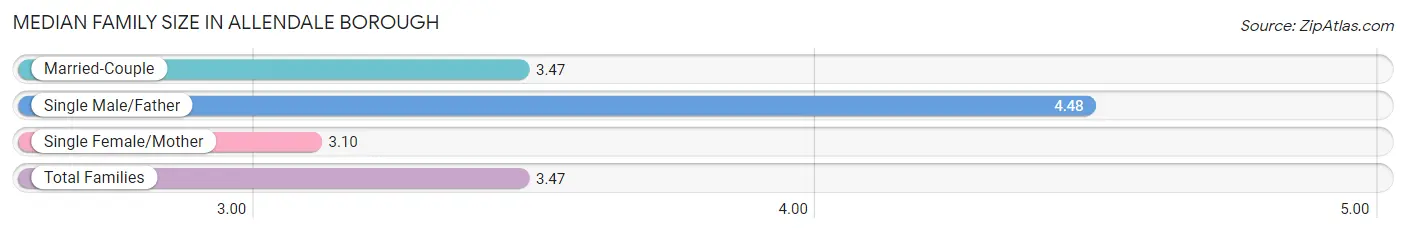
Median Family Size in Allendale borough
The median family size in Allendale borough is 3.47 persons per family, with single male/father families (27 | 1.5%) accounting for the largest median family size of 4.48 persons per family. On the other hand, single female/mother families (80 | 4.5%) represent the smallest median family size with 3.10 persons per family.
| Family Type | # Families | Family Size |
| Married-Couple | 1,674 (94.0%) | 3.47 |
| Single Male/Father | 27 (1.5%) | 4.48 |
| Single Female/Mother | 80 (4.5%) | 3.10 |
| Total Families | 1,781 (100.0%) | 3.47 |
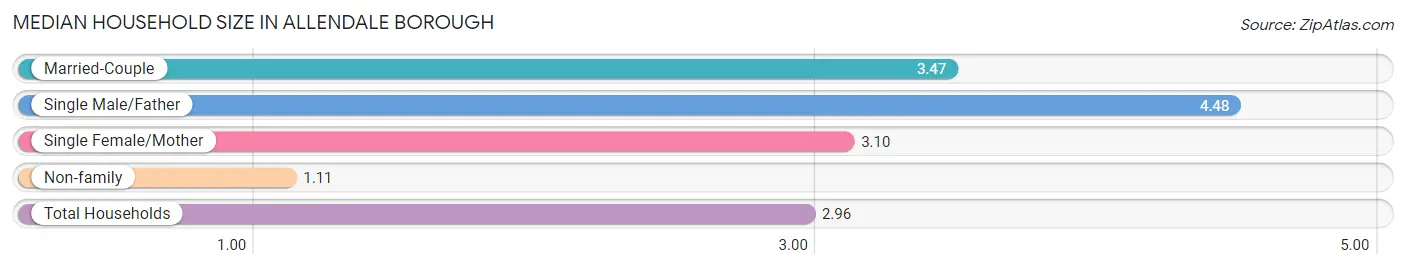
Median Household Size in Allendale borough
The median household size in Allendale borough is 2.96 persons per household, with single male/father households (27 | 1.2%) accounting for the largest median household size of 4.48 persons per household. non-family households (490 | 21.6%) represent the smallest median household size with 1.11 persons per household.
| Household Type | # Households | Household Size |
| Married-Couple | 1,674 (73.7%) | 3.47 |
| Single Male/Father | 27 (1.2%) | 4.48 |
| Single Female/Mother | 80 (3.5%) | 3.10 |
| Non-family | 490 (21.6%) | 1.11 |
| Total Households | 2,271 (100.0%) | 2.96 |
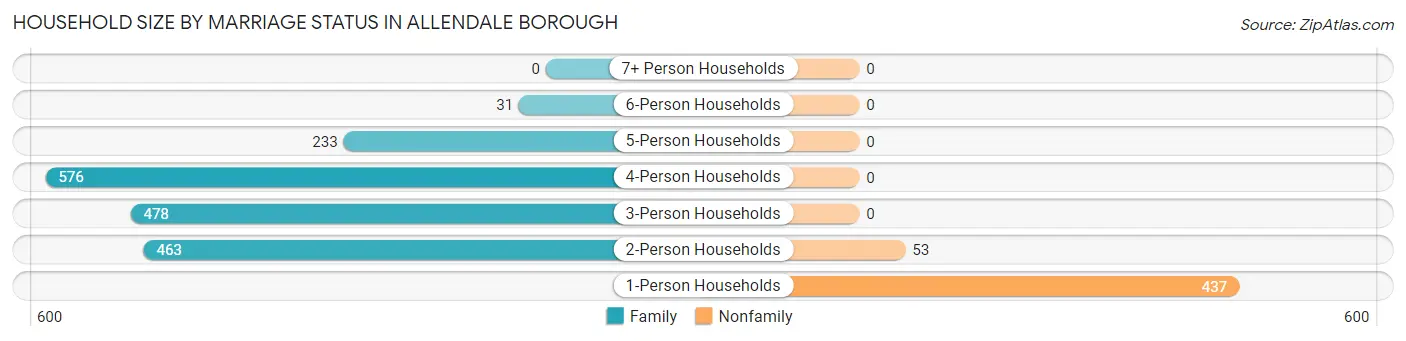
Household Size by Marriage Status in Allendale borough
Out of a total of 2,271 households in Allendale borough, 1,781 (78.4%) are family households, while 490 (21.6%) are nonfamily households. The most numerous type of family households are 4-person households, comprising 576, and the most common type of nonfamily households are 1-person households, comprising 437.
| Household Size | Family Households | Nonfamily Households |
| 1-Person Households | - | 437 (19.2%) |
| 2-Person Households | 463 (20.4%) | 53 (2.3%) |
| 3-Person Households | 478 (21.0%) | 0 (0.0%) |
| 4-Person Households | 576 (25.4%) | 0 (0.0%) |
| 5-Person Households | 233 (10.3%) | 0 (0.0%) |
| 6-Person Households | 31 (1.4%) | 0 (0.0%) |
| 7+ Person Households | 0 (0.0%) | 0 (0.0%) |
| Total | 1,781 (78.4%) | 490 (21.6%) |
Female Fertility in Allendale borough
Fertility by Age in Allendale borough
Average fertility rate in Allendale borough is 22.0 births per 1,000 women. Women in the age bracket of 20 to 34 years have the highest fertility rate with 66.0 births per 1,000 women. Women in the age bracket of 20 to 34 years acount for 61.3% of all women with births.
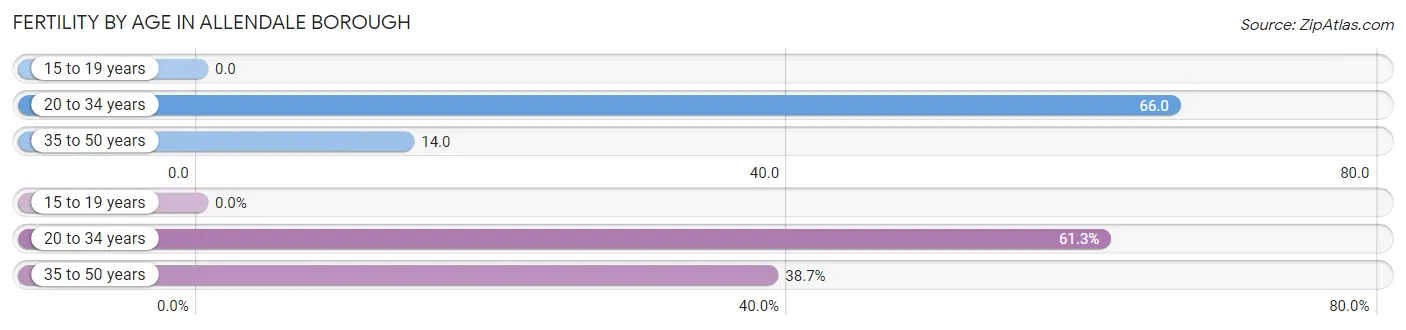
| Age Bracket | Women with Births | Births / 1,000 Women |
| 15 to 19 years | 0 (0.0%) | 0.0 |
| 20 to 34 years | 19 (61.3%) | 66.0 |
| 35 to 50 years | 12 (38.7%) | 14.0 |
| Total | 31 (100.0%) | 22.0 |
Fertility by Age by Marriage Status in Allendale borough
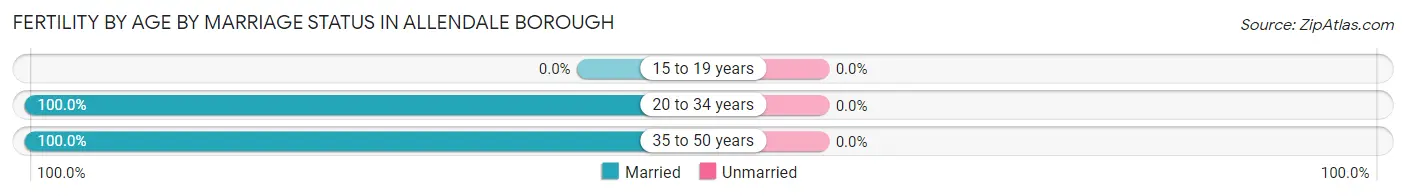
| Age Bracket | Married | Unmarried |
| 15 to 19 years | 0 (0.0%) | 0 (0.0%) |
| 20 to 34 years | 19 (100.0%) | 0 (0.0%) |
| 35 to 50 years | 12 (100.0%) | 0 (0.0%) |
| Total | 31 (100.0%) | 0 (0.0%) |
Fertility by Education in Allendale borough
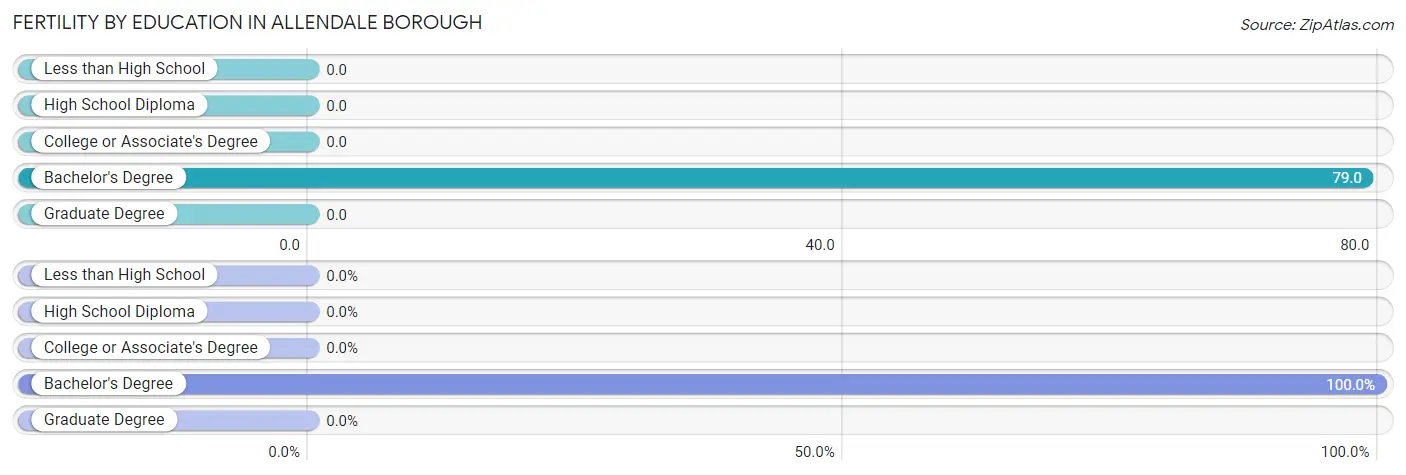
| Educational Attainment | Women with Births | Births / 1,000 Women |
| Less than High School | 0 (0.0%) | 0.0 |
| High School Diploma | 0 (0.0%) | 0.0 |
| College or Associate's Degree | 0 (0.0%) | 0.0 |
| Bachelor's Degree | 31 (100.0%) | 79.0 |
| Graduate Degree | 0 (0.0%) | 0.0 |
| Total | 31 (100.0%) | 22.0 |
Fertility by Education by Marriage Status in Allendale borough
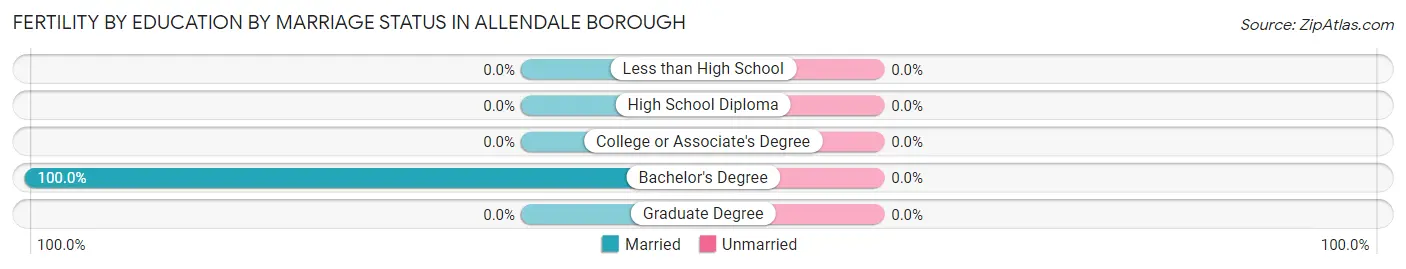
| Educational Attainment | Married | Unmarried |
| Less than High School | 0 (0.0%) | 0 (0.0%) |
| High School Diploma | 0 (0.0%) | 0 (0.0%) |
| College or Associate's Degree | 0 (0.0%) | 0 (0.0%) |
| Bachelor's Degree | 31 (100.0%) | 0 (0.0%) |
| Graduate Degree | 0 (0.0%) | 0 (0.0%) |
| Total | 31 (100.0%) | 0 (0.0%) |
Employment Characteristics in Allendale borough
Employment by Class of Employer in Allendale borough
Among the 2,956 employed individuals in Allendale borough, private company employees (2,195 | 74.3%), local government employees (241 | 8.2%), and self-employed (incorporated) (154 | 5.2%) make up the most common classes of employment.
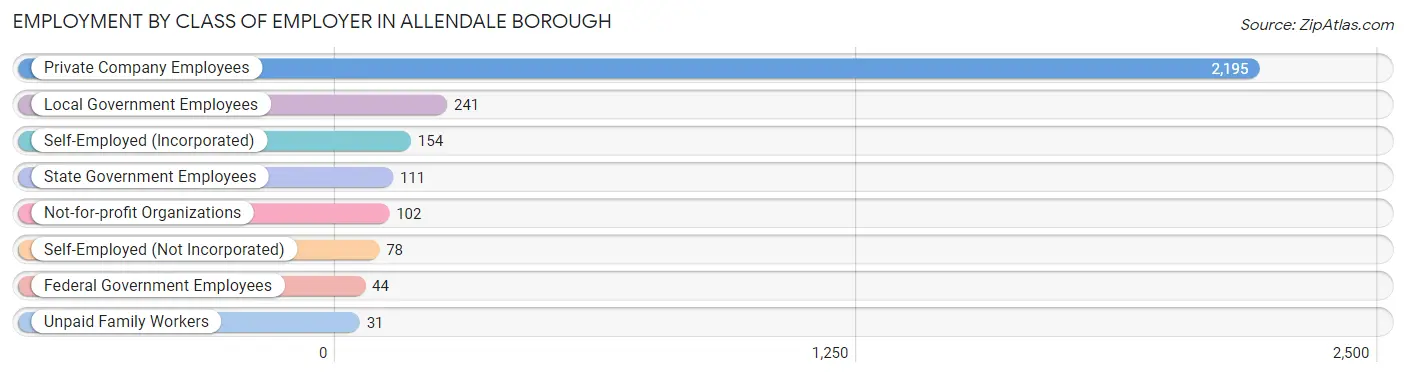
| Employer Class | # Employees | % Employees |
| Private Company Employees | 2,195 | 74.3% |
| Self-Employed (Incorporated) | 154 | 5.2% |
| Self-Employed (Not Incorporated) | 78 | 2.6% |
| Not-for-profit Organizations | 102 | 3.5% |
| Local Government Employees | 241 | 8.2% |
| State Government Employees | 111 | 3.8% |
| Federal Government Employees | 44 | 1.5% |
| Unpaid Family Workers | 31 | 1.1% |
| Total | 2,956 | 100.0% |
Employment Status by Age in Allendale borough
According to the labor force statistics for Allendale borough, out of the total population over 16 years of age (5,174), 59.7% or 3,089 individuals are in the labor force, with 3.6% or 111 of them unemployed. The age group with the highest labor force participation rate is 25 to 29 years, with 93.6% or 175 individuals in the labor force. Within the labor force, the 20 to 24 years age range has the highest percentage of unemployed individuals, with 15.6% or 26 of them being unemployed.
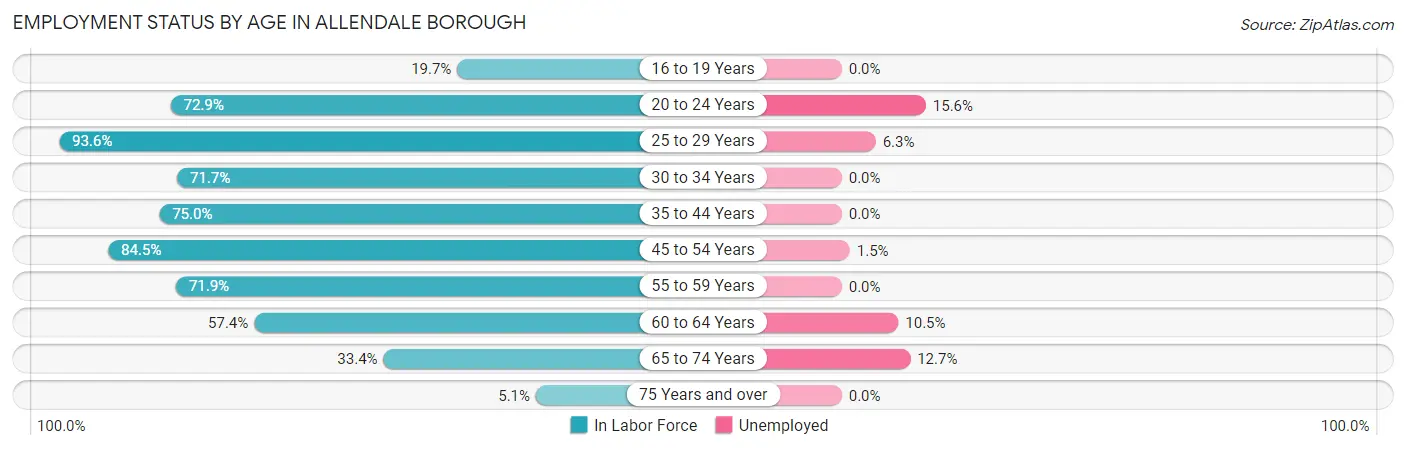
| Age Bracket | In Labor Force | Unemployed |
| 16 to 19 Years | 78 (19.7%) | 0 (0.0%) |
| 20 to 24 Years | 167 (72.9%) | 26 (15.6%) |
| 25 to 29 Years | 175 (93.6%) | 11 (6.3%) |
| 30 to 34 Years | 66 (71.7%) | 0 (0.0%) |
| 35 to 44 Years | 526 (75.0%) | 0 (0.0%) |
| 45 to 54 Years | 1,188 (84.5%) | 18 (1.5%) |
| 55 to 59 Years | 389 (71.9%) | 0 (0.0%) |
| 60 to 64 Years | 247 (57.4%) | 26 (10.5%) |
| 65 to 74 Years | 228 (33.4%) | 29 (12.7%) |
| 75 Years and over | 26 (5.1%) | 0 (0.0%) |
| Total | 3,089 (59.7%) | 111 (3.6%) |
Employment Status by Educational Attainment in Allendale borough
According to labor force statistics for Allendale borough, 77.2% of individuals (2,592) out of the total population between 25 and 64 years of age (3,357) are in the labor force, with 2.1% or 54 of them being unemployed. The group with the highest labor force participation rate are those with the educational attainment of bachelor's degree or higher, with 80.7% or 2,066 individuals in the labor force. Within the labor force, individuals with bachelor's degree or higher education have the highest percentage of unemployment, with 2.7% or 56 of them being unemployed.
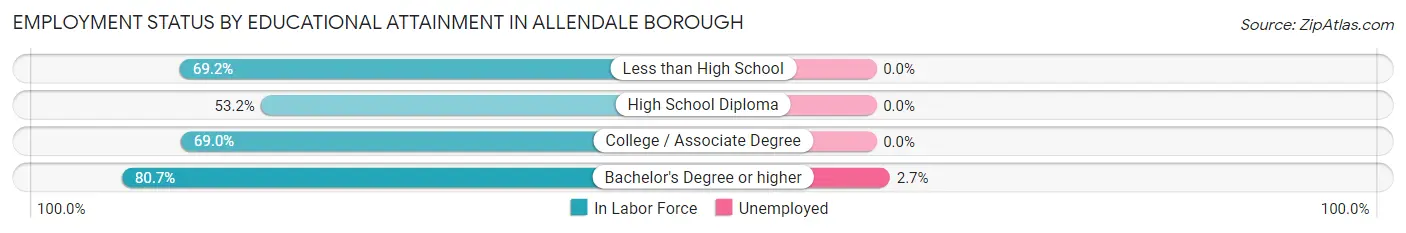
| Educational Attainment | In Labor Force | Unemployed |
| Less than High School | 27 (69.2%) | 0 (0.0%) |
| High School Diploma | 82 (53.2%) | 0 (0.0%) |
| College / Associate Degree | 417 (69.0%) | 0 (0.0%) |
| Bachelor's Degree or higher | 2,066 (80.7%) | 69 (2.7%) |
| Total | 2,592 (77.2%) | 70 (2.1%) |
Employment Occupations by Sex in Allendale borough
Management, Business, Science and Arts Occupations
The most common Management, Business, Science and Arts occupations in Allendale borough are Management (784 | 26.3%), Community & Social Service (550 | 18.5%), Business & Financial (293 | 9.8%), Arts, Media & Entertainment (244 | 8.2%), and Education Instruction & Library (198 | 6.6%).
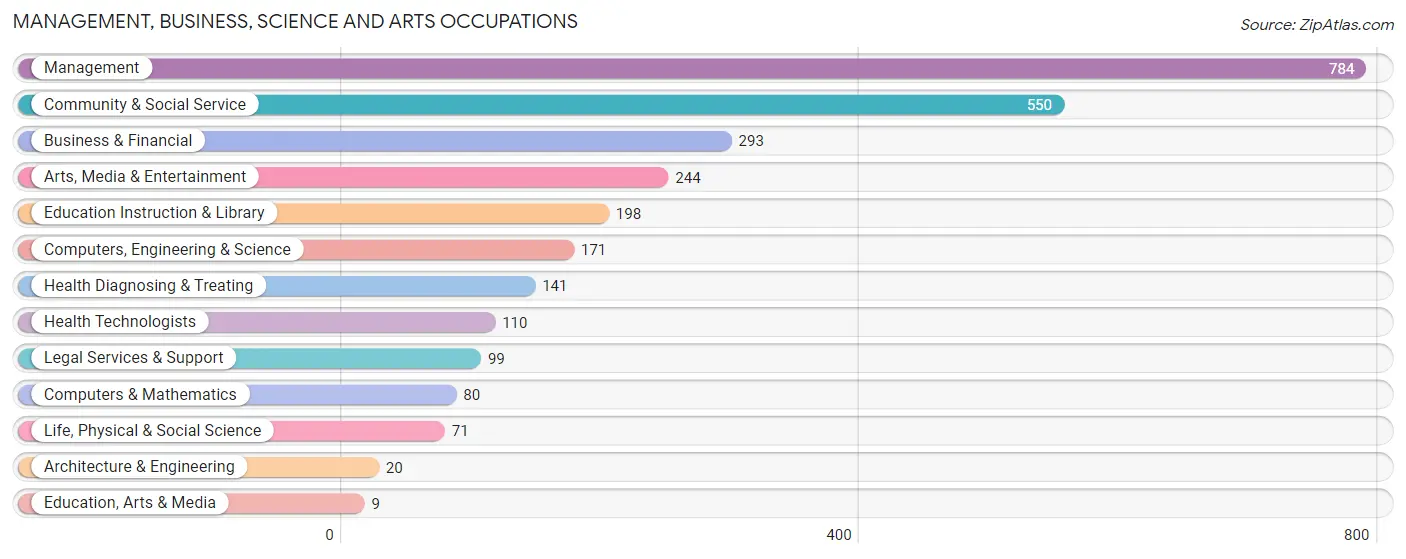
Management, Business, Science and Arts Occupations by Sex
Within the Management, Business, Science and Arts occupations in Allendale borough, the most male-oriented occupations are Life, Physical & Social Science (100.0%), Computers, Engineering & Science (80.1%), and Arts, Media & Entertainment (79.9%), while the most female-oriented occupations are Education, Arts & Media (100.0%), Education Instruction & Library (71.2%), and Legal Services & Support (63.6%).
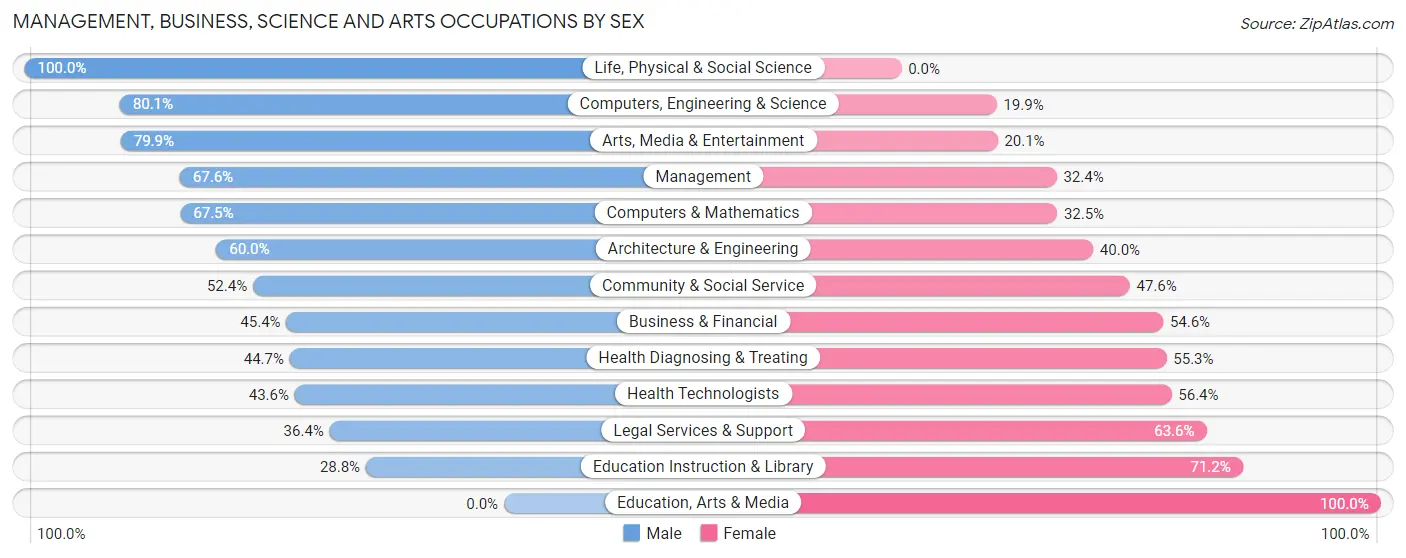
| Occupation | Male | Female |
| Management | 530 (67.6%) | 254 (32.4%) |
| Business & Financial | 133 (45.4%) | 160 (54.6%) |
| Computers, Engineering & Science | 137 (80.1%) | 34 (19.9%) |
| Computers & Mathematics | 54 (67.5%) | 26 (32.5%) |
| Architecture & Engineering | 12 (60.0%) | 8 (40.0%) |
| Life, Physical & Social Science | 71 (100.0%) | 0 (0.0%) |
| Community & Social Service | 288 (52.4%) | 262 (47.6%) |
| Education, Arts & Media | 0 (0.0%) | 9 (100.0%) |
| Legal Services & Support | 36 (36.4%) | 63 (63.6%) |
| Education Instruction & Library | 57 (28.8%) | 141 (71.2%) |
| Arts, Media & Entertainment | 195 (79.9%) | 49 (20.1%) |
| Health Diagnosing & Treating | 63 (44.7%) | 78 (55.3%) |
| Health Technologists | 48 (43.6%) | 62 (56.4%) |
| Total (Category) | 1,151 (59.4%) | 788 (40.6%) |
| Total (Overall) | 1,708 (57.3%) | 1,272 (42.7%) |
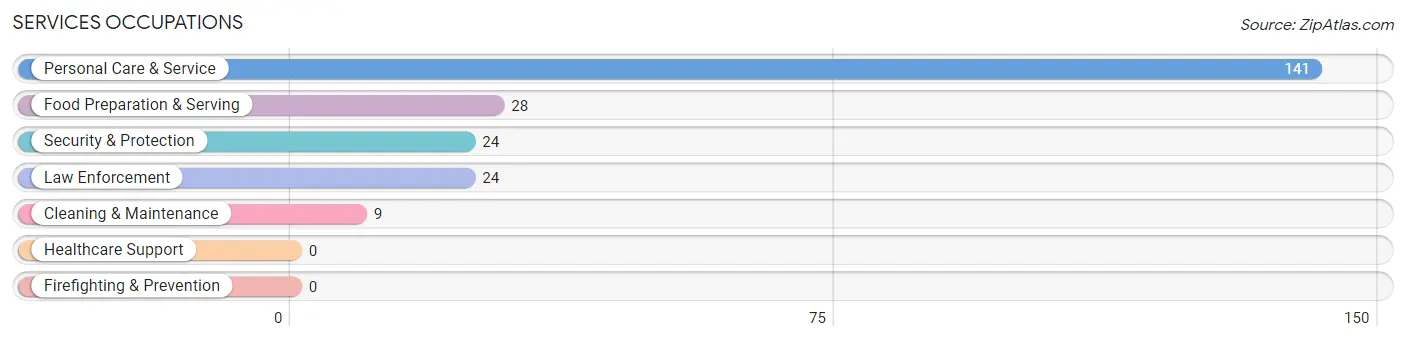
Services Occupations
The most common Services occupations in Allendale borough are Personal Care & Service (141 | 4.7%), Food Preparation & Serving (28 | 0.9%), Security & Protection (24 | 0.8%), Law Enforcement (24 | 0.8%), and Cleaning & Maintenance (9 | 0.3%).
Services Occupations by Sex
Within the Services occupations in Allendale borough, the most male-oriented occupations are Security & Protection (100.0%), Law Enforcement (100.0%), and Cleaning & Maintenance (100.0%), while the most female-oriented occupations are Personal Care & Service (87.9%), and Food Preparation & Serving (35.7%).
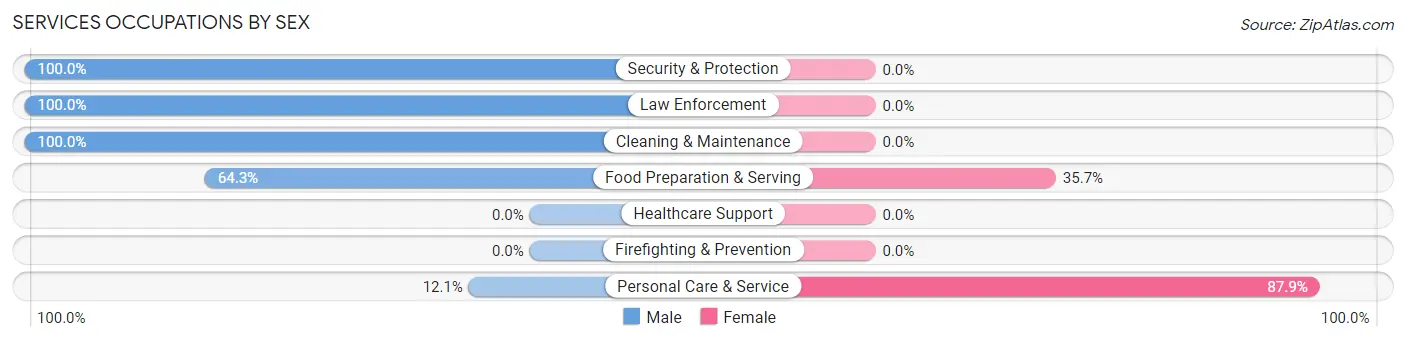
| Occupation | Male | Female |
| Healthcare Support | 0 (0.0%) | 0 (0.0%) |
| Security & Protection | 24 (100.0%) | 0 (0.0%) |
| Firefighting & Prevention | 0 (0.0%) | 0 (0.0%) |
| Law Enforcement | 24 (100.0%) | 0 (0.0%) |
| Food Preparation & Serving | 18 (64.3%) | 10 (35.7%) |
| Cleaning & Maintenance | 9 (100.0%) | 0 (0.0%) |
| Personal Care & Service | 17 (12.1%) | 124 (87.9%) |
| Total (Category) | 68 (33.7%) | 134 (66.3%) |
| Total (Overall) | 1,708 (57.3%) | 1,272 (42.7%) |
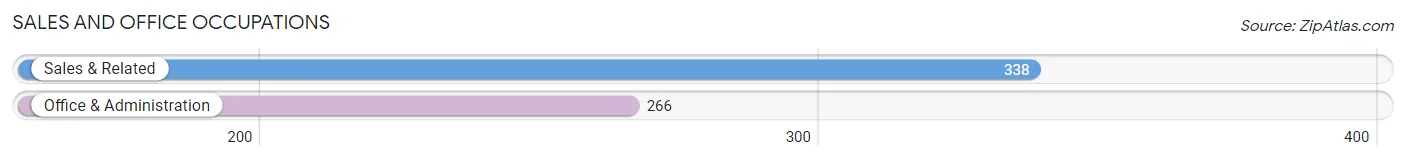
Sales and Office Occupations
The most common Sales and Office occupations in Allendale borough are Sales & Related (338 | 11.3%), and Office & Administration (266 | 8.9%).
Sales and Office Occupations by Sex
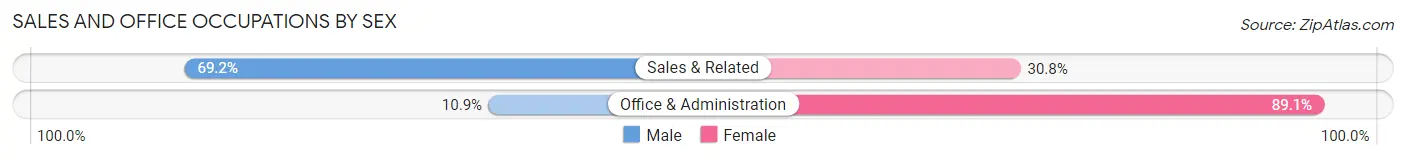
| Occupation | Male | Female |
| Sales & Related | 234 (69.2%) | 104 (30.8%) |
| Office & Administration | 29 (10.9%) | 237 (89.1%) |
| Total (Category) | 263 (43.5%) | 341 (56.5%) |
| Total (Overall) | 1,708 (57.3%) | 1,272 (42.7%) |
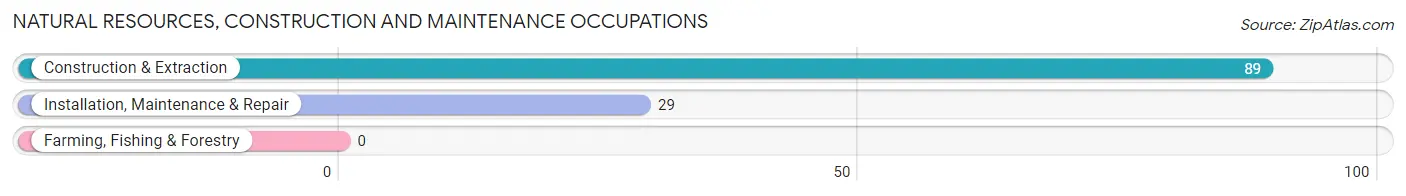
Natural Resources, Construction and Maintenance Occupations
The most common Natural Resources, Construction and Maintenance occupations in Allendale borough are Construction & Extraction (89 | 3.0%), and Installation, Maintenance & Repair (29 | 1.0%).
Natural Resources, Construction and Maintenance Occupations by Sex
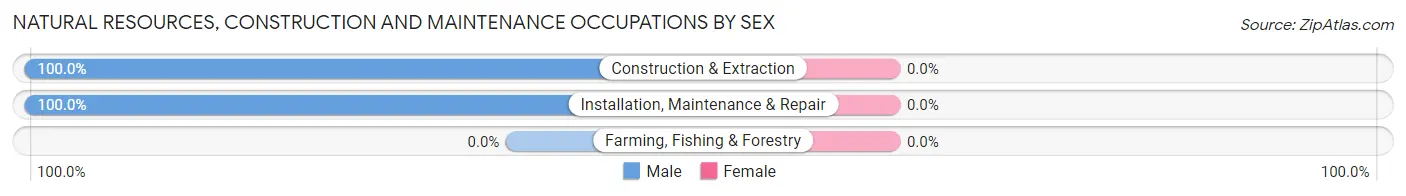
| Occupation | Male | Female |
| Farming, Fishing & Forestry | 0 (0.0%) | 0 (0.0%) |
| Construction & Extraction | 89 (100.0%) | 0 (0.0%) |
| Installation, Maintenance & Repair | 29 (100.0%) | 0 (0.0%) |
| Total (Category) | 118 (100.0%) | 0 (0.0%) |
| Total (Overall) | 1,708 (57.3%) | 1,272 (42.7%) |
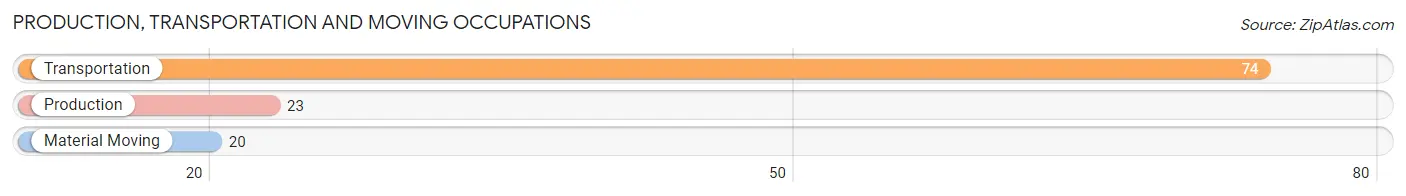
Production, Transportation and Moving Occupations
The most common Production, Transportation and Moving occupations in Allendale borough are Transportation (74 | 2.5%), Production (23 | 0.8%), and Material Moving (20 | 0.7%).
Production, Transportation and Moving Occupations by Sex
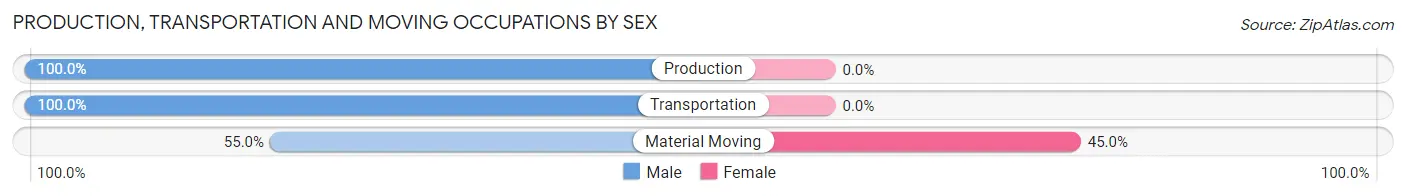
| Occupation | Male | Female |
| Production | 23 (100.0%) | 0 (0.0%) |
| Transportation | 74 (100.0%) | 0 (0.0%) |
| Material Moving | 11 (55.0%) | 9 (45.0%) |
| Total (Category) | 108 (92.3%) | 9 (7.7%) |
| Total (Overall) | 1,708 (57.3%) | 1,272 (42.7%) |
Employment Industries by Sex in Allendale borough
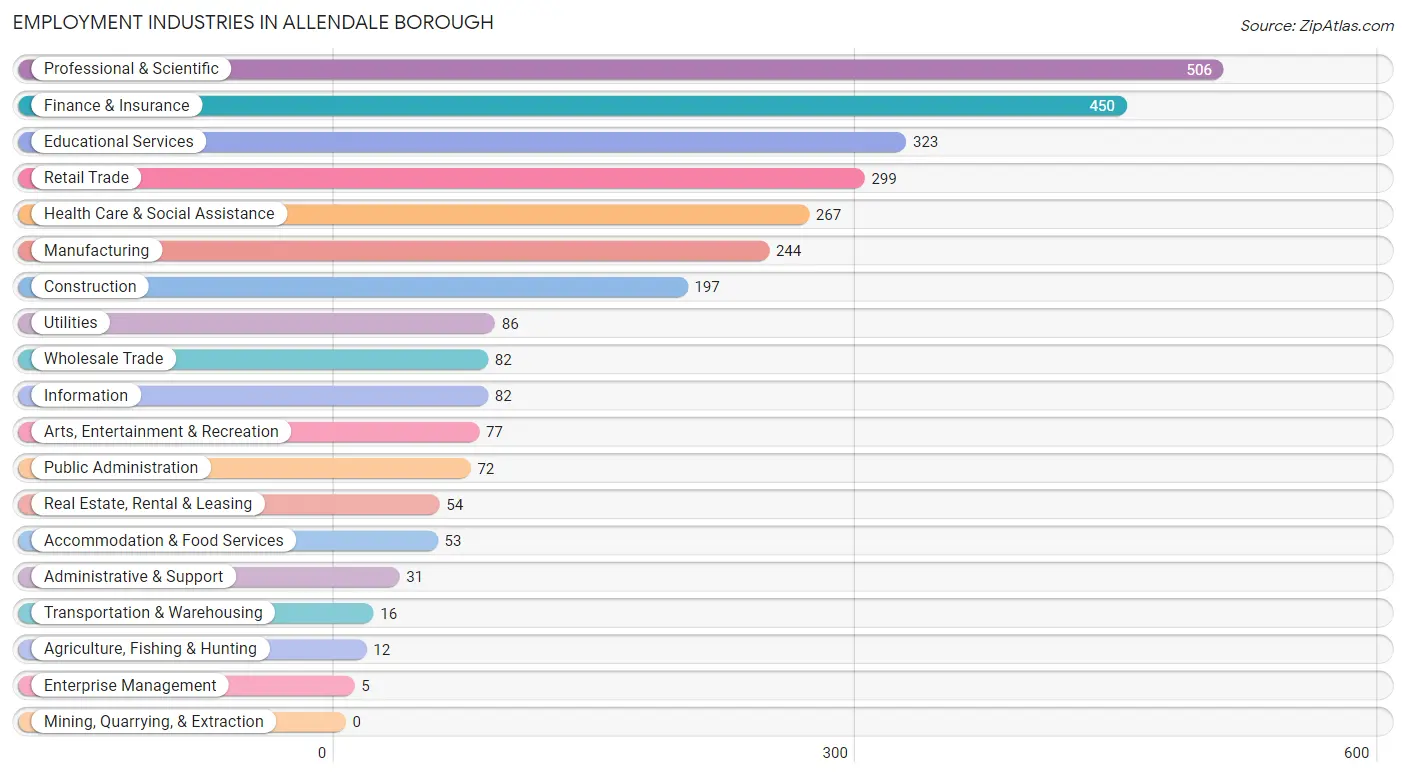
Employment Industries in Allendale borough
The major employment industries in Allendale borough include Professional & Scientific (506 | 17.0%), Finance & Insurance (450 | 15.1%), Educational Services (323 | 10.8%), Retail Trade (299 | 10.0%), and Health Care & Social Assistance (267 | 9.0%).
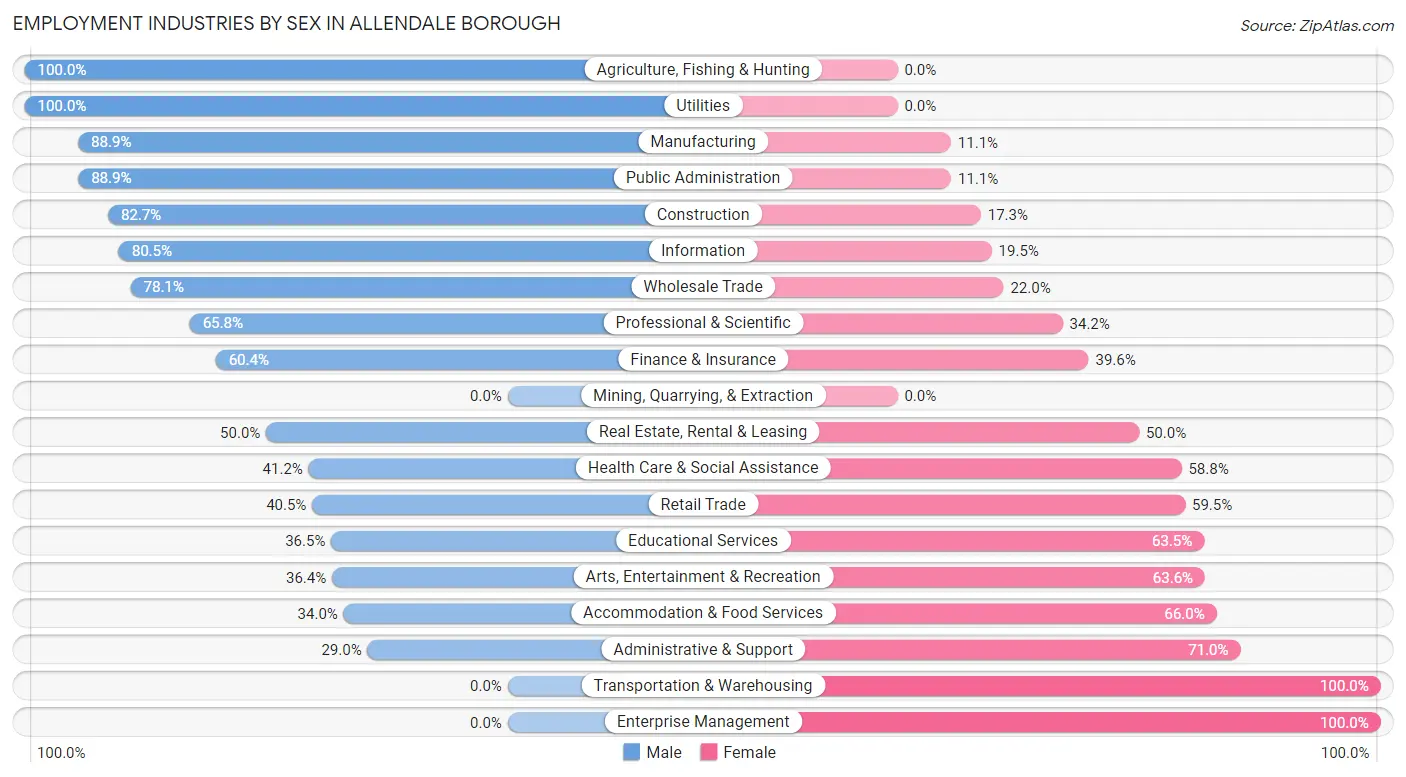
Employment Industries by Sex in Allendale borough
The Allendale borough industries that see more men than women are Agriculture, Fishing & Hunting (100.0%), Utilities (100.0%), and Manufacturing (88.9%), whereas the industries that tend to have a higher number of women are Transportation & Warehousing (100.0%), Enterprise Management (100.0%), and Administrative & Support (71.0%).
| Industry | Male | Female |
| Agriculture, Fishing & Hunting | 12 (100.0%) | 0 (0.0%) |
| Mining, Quarrying, & Extraction | 0 (0.0%) | 0 (0.0%) |
| Construction | 163 (82.7%) | 34 (17.3%) |
| Manufacturing | 217 (88.9%) | 27 (11.1%) |
| Wholesale Trade | 64 (78.0%) | 18 (22.0%) |
| Retail Trade | 121 (40.5%) | 178 (59.5%) |
| Transportation & Warehousing | 0 (0.0%) | 16 (100.0%) |
| Utilities | 86 (100.0%) | 0 (0.0%) |
| Information | 66 (80.5%) | 16 (19.5%) |
| Finance & Insurance | 272 (60.4%) | 178 (39.6%) |
| Real Estate, Rental & Leasing | 27 (50.0%) | 27 (50.0%) |
| Professional & Scientific | 333 (65.8%) | 173 (34.2%) |
| Enterprise Management | 0 (0.0%) | 5 (100.0%) |
| Administrative & Support | 9 (29.0%) | 22 (71.0%) |
| Educational Services | 118 (36.5%) | 205 (63.5%) |
| Health Care & Social Assistance | 110 (41.2%) | 157 (58.8%) |
| Arts, Entertainment & Recreation | 28 (36.4%) | 49 (63.6%) |
| Accommodation & Food Services | 18 (34.0%) | 35 (66.0%) |
| Public Administration | 64 (88.9%) | 8 (11.1%) |
| Total | 1,708 (57.3%) | 1,272 (42.7%) |
Education in Allendale borough
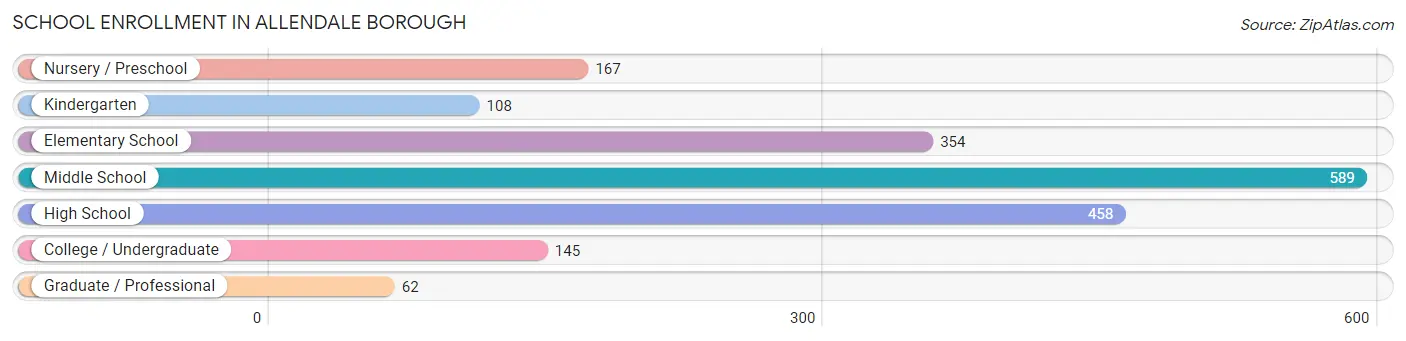
School Enrollment in Allendale borough
The most common levels of schooling among the 1,883 students in Allendale borough are middle school (589 | 31.3%), high school (458 | 24.3%), and elementary school (354 | 18.8%).
| School Level | # Students | % Students |
| Nursery / Preschool | 167 | 8.9% |
| Kindergarten | 108 | 5.7% |
| Elementary School | 354 | 18.8% |
| Middle School | 589 | 31.3% |
| High School | 458 | 24.3% |
| College / Undergraduate | 145 | 7.7% |
| Graduate / Professional | 62 | 3.3% |
| Total | 1,883 | 100.0% |
School Enrollment by Age by Funding Source in Allendale borough
Out of a total of 1,883 students who are enrolled in schools in Allendale borough, 271 (14.4%) attend a private institution, while the remaining 1,612 (85.6%) are enrolled in public schools. The age group of 3 to 4 year olds has the highest likelihood of being enrolled in private schools, with 136 (93.1% in the age bracket) enrolled. Conversely, the age group of 18 to 19 year olds has the lowest likelihood of being enrolled in a private school, with 105 (100.0% in the age bracket) attending a public institution.
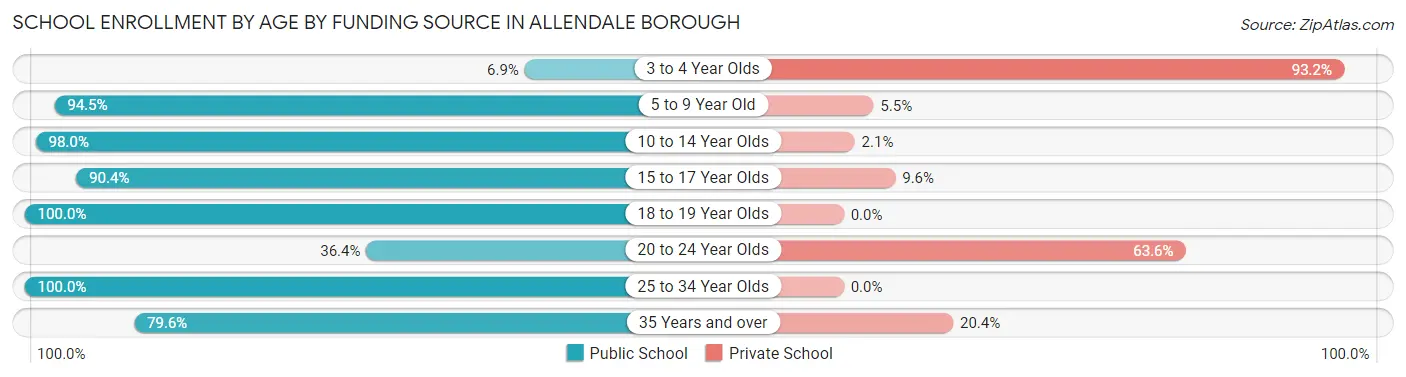
| Age Bracket | Public School | Private School |
| 3 to 4 Year Olds | 10 (6.9%) | 136 (93.1%) |
| 5 to 9 Year Old | 426 (94.5%) | 25 (5.5%) |
| 10 to 14 Year Olds | 622 (98.0%) | 13 (2.1%) |
| 15 to 17 Year Olds | 348 (90.4%) | 37 (9.6%) |
| 18 to 19 Year Olds | 105 (100.0%) | 0 (0.0%) |
| 20 to 24 Year Olds | 28 (36.4%) | 49 (63.6%) |
| 25 to 34 Year Olds | 30 (100.0%) | 0 (0.0%) |
| 35 Years and over | 43 (79.6%) | 11 (20.4%) |
| Total | 1,612 (85.6%) | 271 (14.4%) |
Educational Attainment by Field of Study in Allendale borough
Business (877 | 25.0%), engineering (358 | 10.2%), social sciences (355 | 10.1%), education (346 | 9.9%), and literature & languages (258 | 7.4%) are the most common fields of study among 3,502 individuals in Allendale borough who have obtained a bachelor's degree or higher.
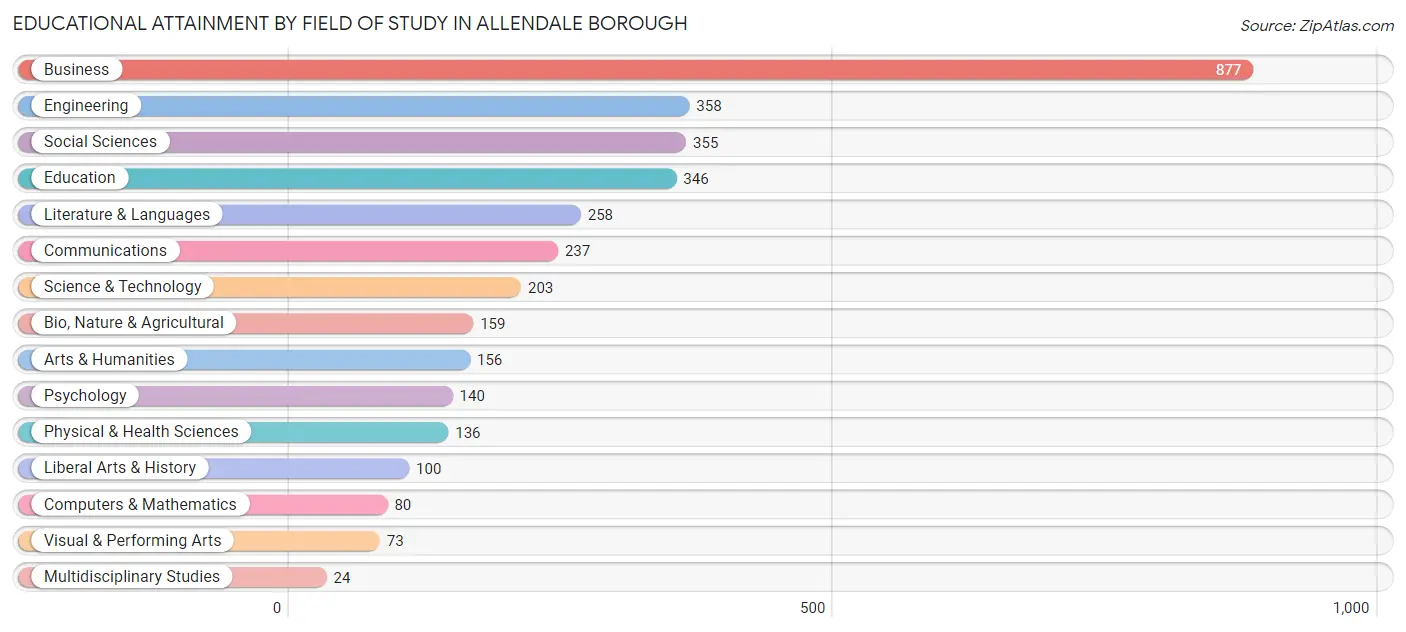
| Field of Study | # Graduates | % Graduates |
| Computers & Mathematics | 80 | 2.3% |
| Bio, Nature & Agricultural | 159 | 4.5% |
| Physical & Health Sciences | 136 | 3.9% |
| Psychology | 140 | 4.0% |
| Social Sciences | 355 | 10.1% |
| Engineering | 358 | 10.2% |
| Multidisciplinary Studies | 24 | 0.7% |
| Science & Technology | 203 | 5.8% |
| Business | 877 | 25.0% |
| Education | 346 | 9.9% |
| Literature & Languages | 258 | 7.4% |
| Liberal Arts & History | 100 | 2.9% |
| Visual & Performing Arts | 73 | 2.1% |
| Communications | 237 | 6.8% |
| Arts & Humanities | 156 | 4.4% |
| Total | 3,502 | 100.0% |
Transportation & Commute in Allendale borough
Vehicle Availability by Sex in Allendale borough
The most prevalent vehicle ownership categories in Allendale borough are males with 2 vehicles (945, accounting for 55.3%) and females with 2 vehicles (454, making up 75.8%).
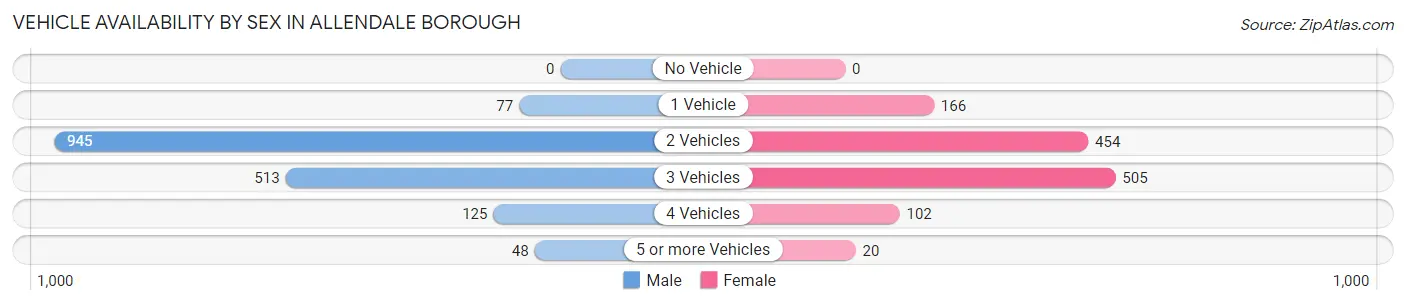
| Vehicles Available | Male | Female |
| No Vehicle | 0 (0.0%) | 0 (0.0%) |
| 1 Vehicle | 77 (4.5%) | 166 (13.3%) |
| 2 Vehicles | 945 (55.3%) | 454 (36.4%) |
| 3 Vehicles | 513 (30.0%) | 505 (40.5%) |
| 4 Vehicles | 125 (7.3%) | 102 (8.2%) |
| 5 or more Vehicles | 48 (2.8%) | 20 (1.6%) |
| Total | 1,708 (100.0%) | 1,247 (100.0%) |
Commute Time in Allendale borough
The most frequently occuring commute durations in Allendale borough are 60 to 89 minutes (324 commuters, 14.8%), 10 to 14 minutes (307 commuters, 14.0%), and 15 to 19 minutes (270 commuters, 12.3%).
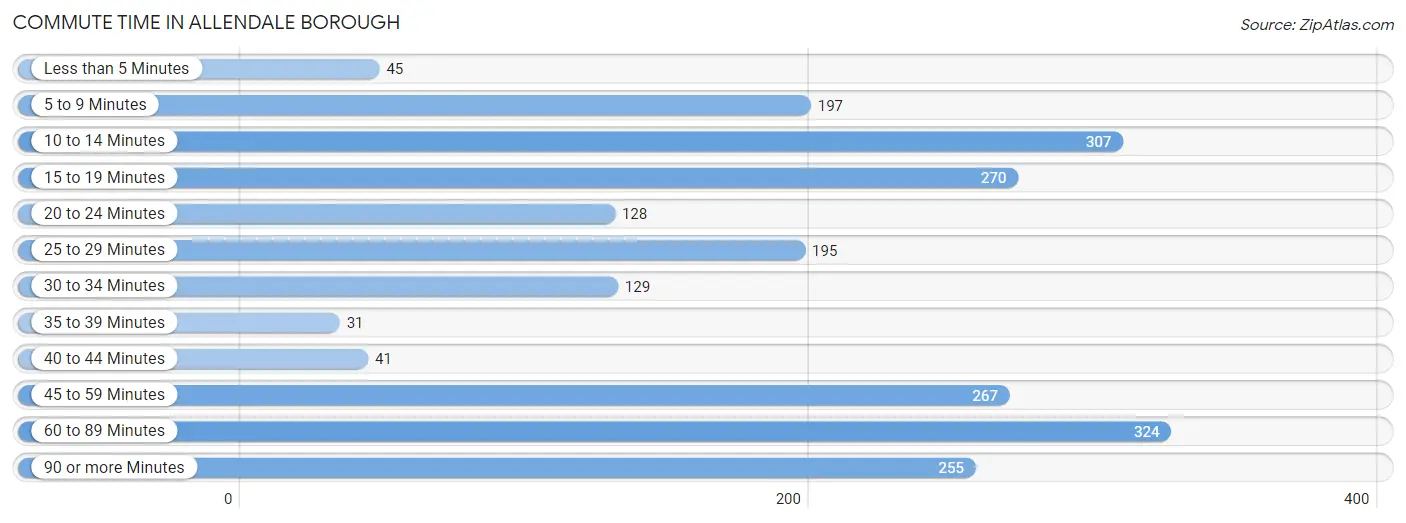
| Commute Time | # Commuters | % Commuters |
| Less than 5 Minutes | 45 | 2.1% |
| 5 to 9 Minutes | 197 | 9.0% |
| 10 to 14 Minutes | 307 | 14.0% |
| 15 to 19 Minutes | 270 | 12.3% |
| 20 to 24 Minutes | 128 | 5.9% |
| 25 to 29 Minutes | 195 | 8.9% |
| 30 to 34 Minutes | 129 | 5.9% |
| 35 to 39 Minutes | 31 | 1.4% |
| 40 to 44 Minutes | 41 | 1.9% |
| 45 to 59 Minutes | 267 | 12.2% |
| 60 to 89 Minutes | 324 | 14.8% |
| 90 or more Minutes | 255 | 11.7% |
Commute Time by Sex in Allendale borough
The most common commute times in Allendale borough are 60 to 89 minutes (277 commuters, 22.8%) for males and 10 to 14 minutes (276 commuters, 28.3%) for females.
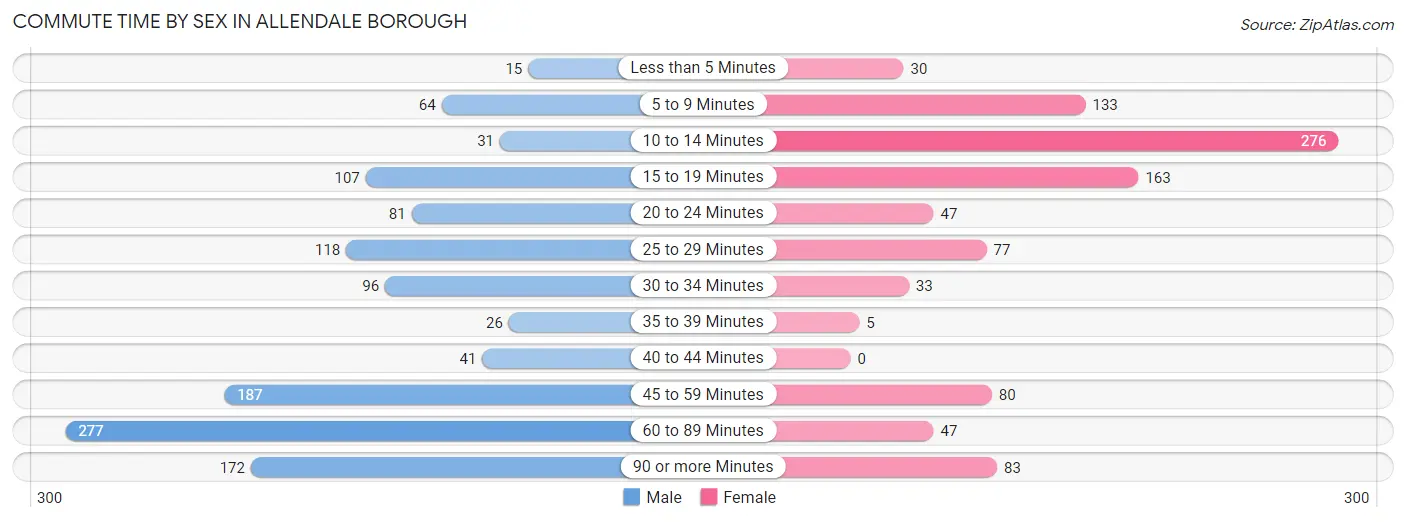
| Commute Time | Male | Female |
| Less than 5 Minutes | 15 (1.2%) | 30 (3.1%) |
| 5 to 9 Minutes | 64 (5.3%) | 133 (13.7%) |
| 10 to 14 Minutes | 31 (2.5%) | 276 (28.3%) |
| 15 to 19 Minutes | 107 (8.8%) | 163 (16.7%) |
| 20 to 24 Minutes | 81 (6.7%) | 47 (4.8%) |
| 25 to 29 Minutes | 118 (9.7%) | 77 (7.9%) |
| 30 to 34 Minutes | 96 (7.9%) | 33 (3.4%) |
| 35 to 39 Minutes | 26 (2.1%) | 5 (0.5%) |
| 40 to 44 Minutes | 41 (3.4%) | 0 (0.0%) |
| 45 to 59 Minutes | 187 (15.4%) | 80 (8.2%) |
| 60 to 89 Minutes | 277 (22.8%) | 47 (4.8%) |
| 90 or more Minutes | 172 (14.2%) | 83 (8.5%) |
Time of Departure to Work by Sex in Allendale borough
The most frequent times of departure to work in Allendale borough are 6:30 AM to 6:59 AM (228, 18.8%) for males and 7:30 AM to 7:59 AM (262, 26.9%) for females.
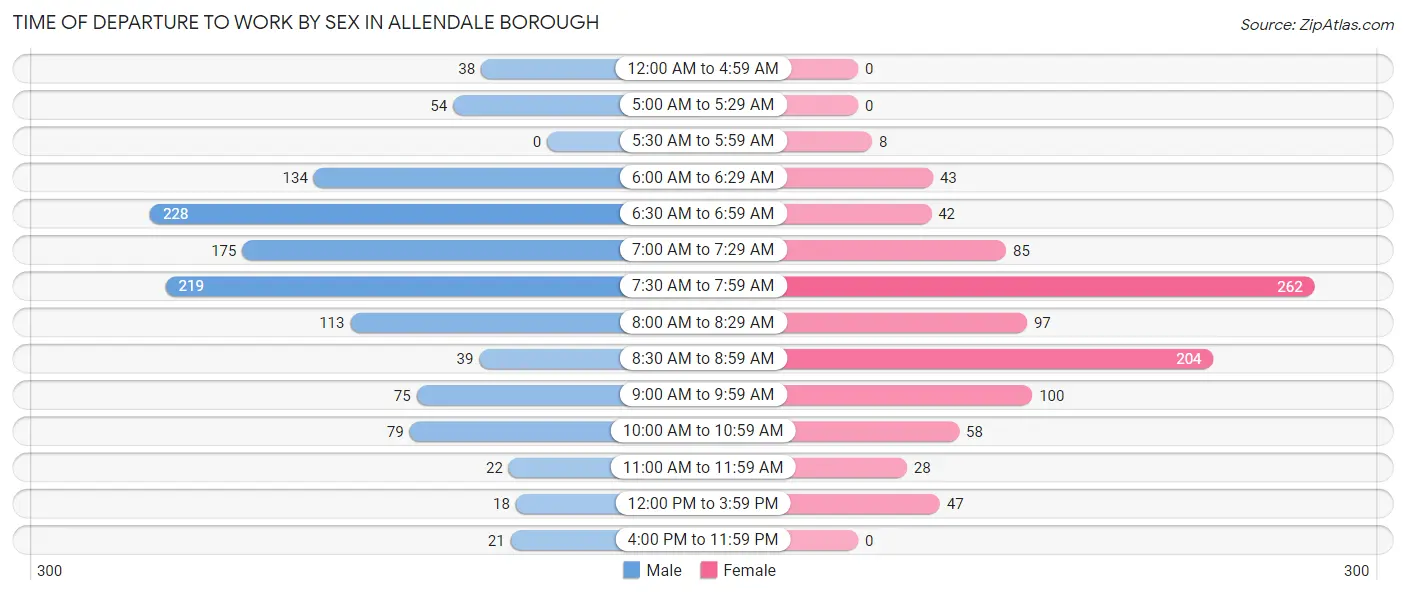
| Time of Departure | Male | Female |
| 12:00 AM to 4:59 AM | 38 (3.1%) | 0 (0.0%) |
| 5:00 AM to 5:29 AM | 54 (4.4%) | 0 (0.0%) |
| 5:30 AM to 5:59 AM | 0 (0.0%) | 8 (0.8%) |
| 6:00 AM to 6:29 AM | 134 (11.0%) | 43 (4.4%) |
| 6:30 AM to 6:59 AM | 228 (18.8%) | 42 (4.3%) |
| 7:00 AM to 7:29 AM | 175 (14.4%) | 85 (8.7%) |
| 7:30 AM to 7:59 AM | 219 (18.0%) | 262 (26.9%) |
| 8:00 AM to 8:29 AM | 113 (9.3%) | 97 (10.0%) |
| 8:30 AM to 8:59 AM | 39 (3.2%) | 204 (20.9%) |
| 9:00 AM to 9:59 AM | 75 (6.2%) | 100 (10.3%) |
| 10:00 AM to 10:59 AM | 79 (6.5%) | 58 (5.9%) |
| 11:00 AM to 11:59 AM | 22 (1.8%) | 28 (2.9%) |
| 12:00 PM to 3:59 PM | 18 (1.5%) | 47 (4.8%) |
| 4:00 PM to 11:59 PM | 21 (1.7%) | 0 (0.0%) |
| Total | 1,215 (100.0%) | 974 (100.0%) |
Housing Occupancy in Allendale borough
Occupancy by Ownership in Allendale borough
Of the total 2,271 dwellings in Allendale borough, owner-occupied units account for 1,817 (80.0%), while renter-occupied units make up 454 (20.0%).
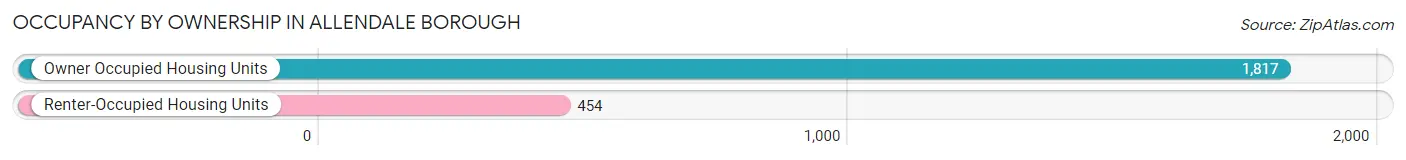
| Occupancy | # Housing Units | % Housing Units |
| Owner Occupied Housing Units | 1,817 | 80.0% |
| Renter-Occupied Housing Units | 454 | 20.0% |
| Total Occupied Housing Units | 2,271 | 100.0% |
Occupancy by Household Size in Allendale borough
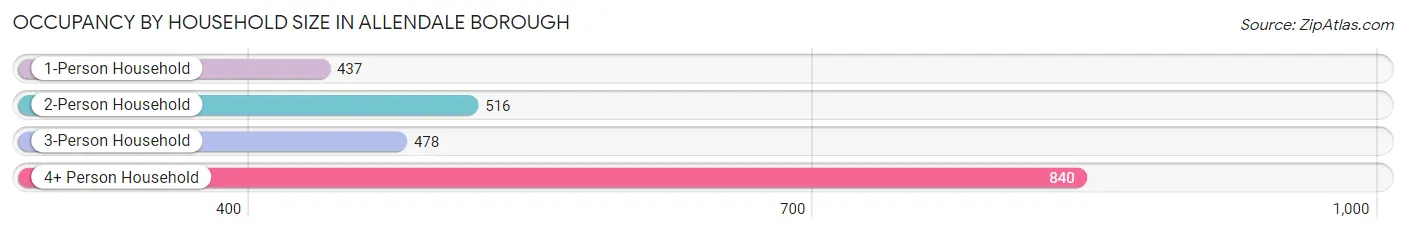
| Household Size | # Housing Units | % Housing Units |
| 1-Person Household | 437 | 19.2% |
| 2-Person Household | 516 | 22.7% |
| 3-Person Household | 478 | 21.0% |
| 4+ Person Household | 840 | 37.0% |
| Total Housing Units | 2,271 | 100.0% |
Occupancy by Ownership by Household Size in Allendale borough
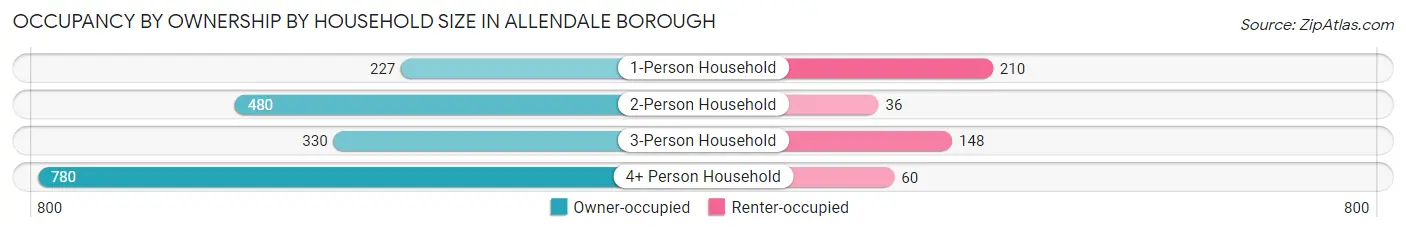
| Household Size | Owner-occupied | Renter-occupied |
| 1-Person Household | 227 (51.9%) | 210 (48.0%) |
| 2-Person Household | 480 (93.0%) | 36 (7.0%) |
| 3-Person Household | 330 (69.0%) | 148 (31.0%) |
| 4+ Person Household | 780 (92.9%) | 60 (7.1%) |
| Total Housing Units | 1,817 (80.0%) | 454 (20.0%) |
Occupancy by Educational Attainment in Allendale borough
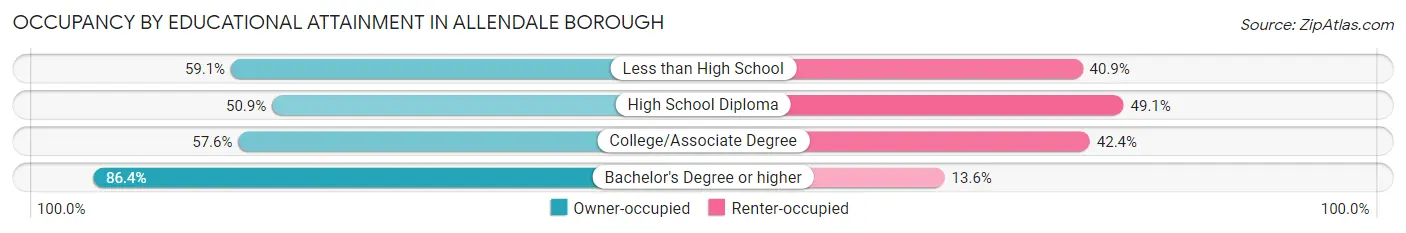
| Household Size | Owner-occupied | Renter-occupied |
| Less than High School | 13 (59.1%) | 9 (40.9%) |
| High School Diploma | 54 (50.9%) | 52 (49.1%) |
| College/Associate Degree | 204 (57.6%) | 150 (42.4%) |
| Bachelor's Degree or higher | 1,546 (86.4%) | 243 (13.6%) |
Occupancy by Age of Householder in Allendale borough
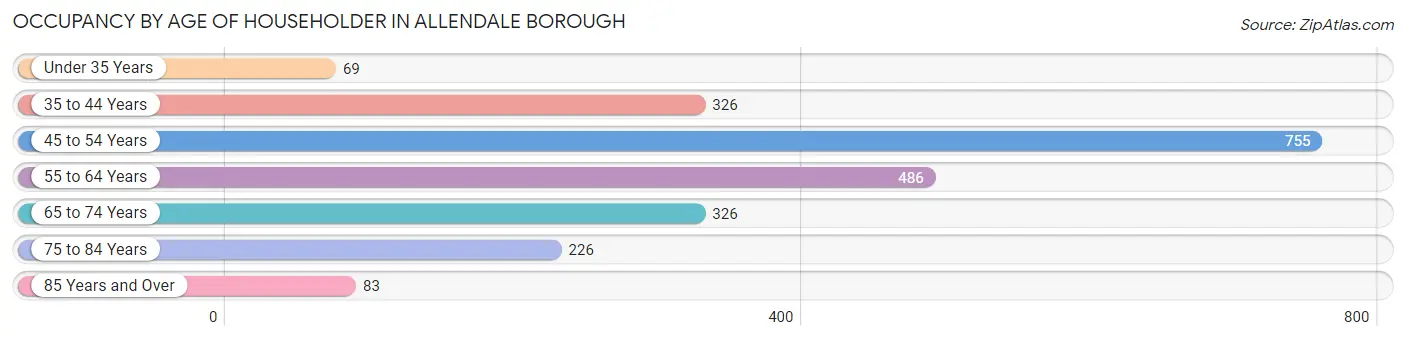
| Age Bracket | # Households | % Households |
| Under 35 Years | 69 | 3.0% |
| 35 to 44 Years | 326 | 14.3% |
| 45 to 54 Years | 755 | 33.3% |
| 55 to 64 Years | 486 | 21.4% |
| 65 to 74 Years | 326 | 14.3% |
| 75 to 84 Years | 226 | 10.0% |
| 85 Years and Over | 83 | 3.6% |
| Total | 2,271 | 100.0% |
Housing Finances in Allendale borough
Median Income by Occupancy in Allendale borough
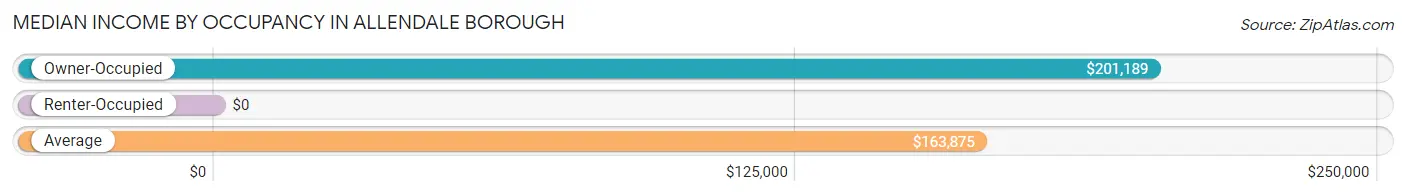
| Occupancy Type | # Households | Median Income |
| Owner-Occupied | 1,817 (80.0%) | $201,189 |
| Renter-Occupied | 454 (20.0%) | $0 |
| Average | 2,271 (100.0%) | $163,875 |
Occupancy by Householder Income Bracket in Allendale borough
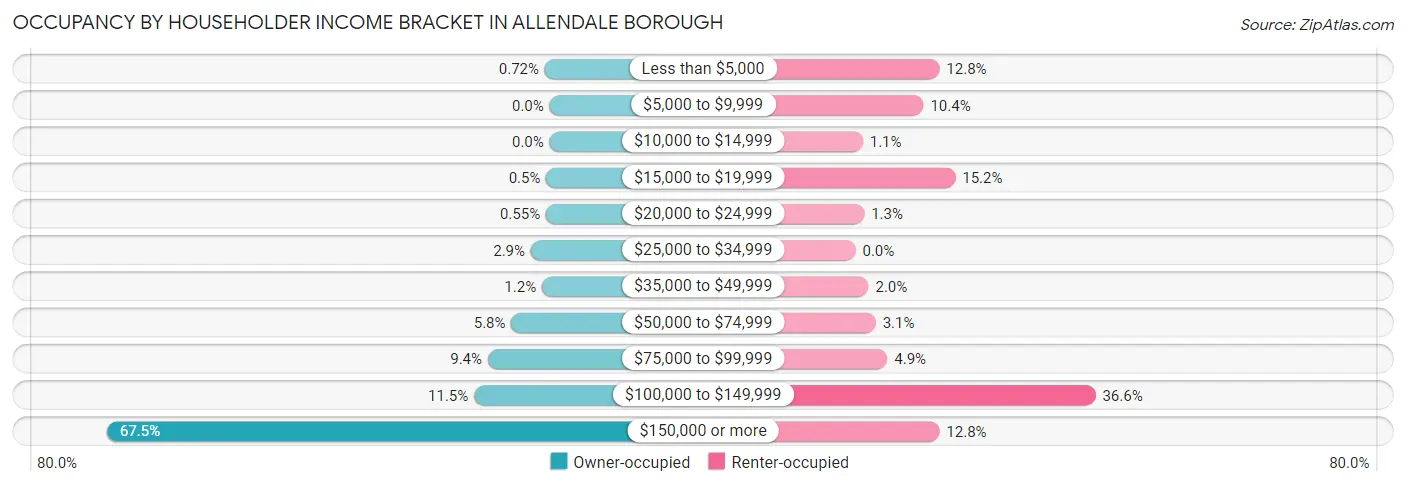
| Income Bracket | Owner-occupied | Renter-occupied |
| Less than $5,000 | 13 (0.7%) | 58 (12.8%) |
| $5,000 to $9,999 | 0 (0.0%) | 47 (10.3%) |
| $10,000 to $14,999 | 0 (0.0%) | 5 (1.1%) |
| $15,000 to $19,999 | 9 (0.5%) | 69 (15.2%) |
| $20,000 to $24,999 | 10 (0.5%) | 6 (1.3%) |
| $25,000 to $34,999 | 52 (2.9%) | 0 (0.0%) |
| $35,000 to $49,999 | 21 (1.2%) | 9 (2.0%) |
| $50,000 to $74,999 | 106 (5.8%) | 14 (3.1%) |
| $75,000 to $99,999 | 171 (9.4%) | 22 (4.9%) |
| $100,000 to $149,999 | 209 (11.5%) | 166 (36.6%) |
| $150,000 or more | 1,226 (67.5%) | 58 (12.8%) |
| Total | 1,817 (100.0%) | 454 (100.0%) |
Monthly Housing Cost Tiers in Allendale borough
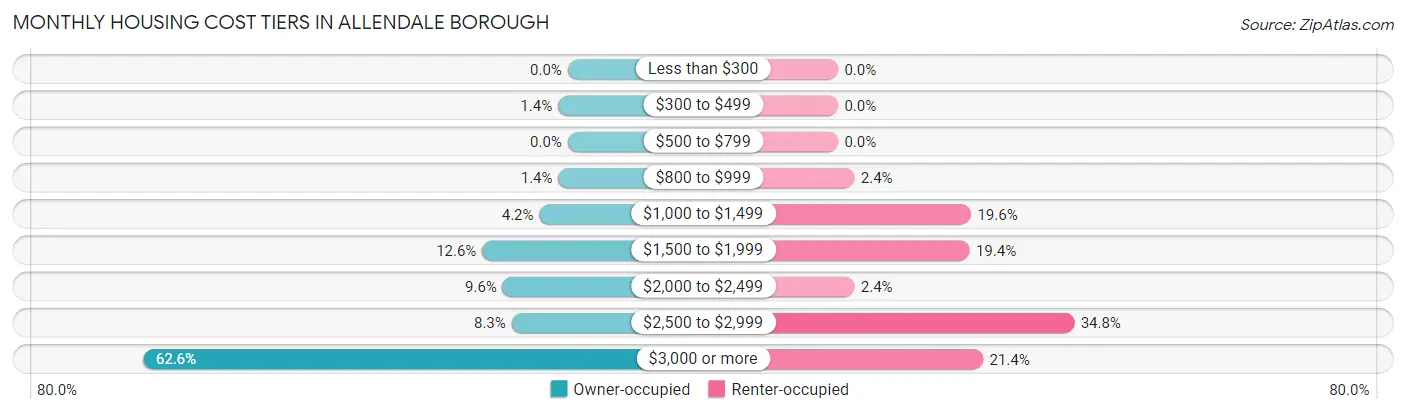
| Monthly Cost | Owner-occupied | Renter-occupied |
| Less than $300 | 0 (0.0%) | 0 (0.0%) |
| $300 to $499 | 26 (1.4%) | 0 (0.0%) |
| $500 to $799 | 0 (0.0%) | 0 (0.0%) |
| $800 to $999 | 25 (1.4%) | 11 (2.4%) |
| $1,000 to $1,499 | 76 (4.2%) | 89 (19.6%) |
| $1,500 to $1,999 | 229 (12.6%) | 88 (19.4%) |
| $2,000 to $2,499 | 174 (9.6%) | 11 (2.4%) |
| $2,500 to $2,999 | 150 (8.3%) | 158 (34.8%) |
| $3,000 or more | 1,137 (62.6%) | 97 (21.4%) |
| Total | 1,817 (100.0%) | 454 (100.0%) |
Physical Housing Characteristics in Allendale borough
Housing Structures in Allendale borough
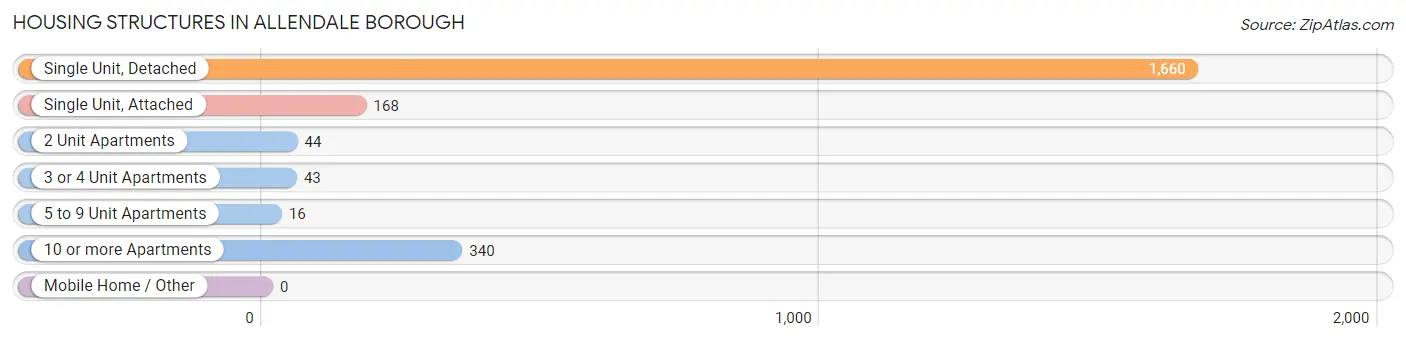
| Structure Type | # Housing Units | % Housing Units |
| Single Unit, Detached | 1,660 | 73.1% |
| Single Unit, Attached | 168 | 7.4% |
| 2 Unit Apartments | 44 | 1.9% |
| 3 or 4 Unit Apartments | 43 | 1.9% |
| 5 to 9 Unit Apartments | 16 | 0.7% |
| 10 or more Apartments | 340 | 15.0% |
| Mobile Home / Other | 0 | 0.0% |
| Total | 2,271 | 100.0% |
Housing Structures by Occupancy in Allendale borough
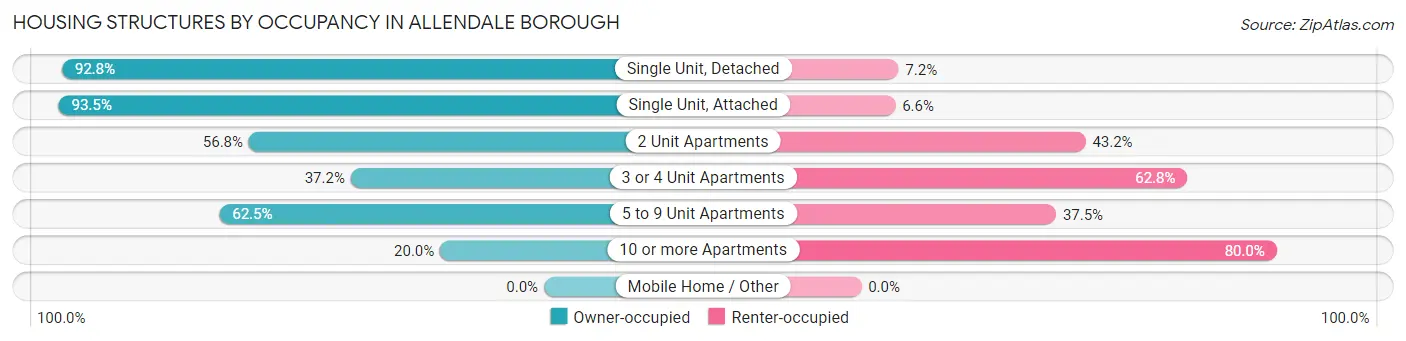
| Structure Type | Owner-occupied | Renter-occupied |
| Single Unit, Detached | 1,541 (92.8%) | 119 (7.2%) |
| Single Unit, Attached | 157 (93.4%) | 11 (6.6%) |
| 2 Unit Apartments | 25 (56.8%) | 19 (43.2%) |
| 3 or 4 Unit Apartments | 16 (37.2%) | 27 (62.8%) |
| 5 to 9 Unit Apartments | 10 (62.5%) | 6 (37.5%) |
| 10 or more Apartments | 68 (20.0%) | 272 (80.0%) |
| Mobile Home / Other | 0 (0.0%) | 0 (0.0%) |
| Total | 1,817 (80.0%) | 454 (20.0%) |
Housing Structures by Number of Rooms in Allendale borough
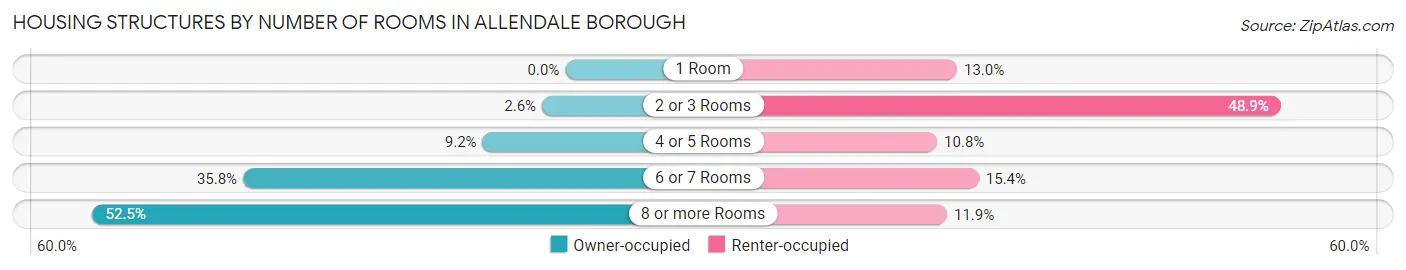
| Number of Rooms | Owner-occupied | Renter-occupied |
| 1 Room | 0 (0.0%) | 59 (13.0%) |
| 2 or 3 Rooms | 47 (2.6%) | 222 (48.9%) |
| 4 or 5 Rooms | 167 (9.2%) | 49 (10.8%) |
| 6 or 7 Rooms | 650 (35.8%) | 70 (15.4%) |
| 8 or more Rooms | 953 (52.4%) | 54 (11.9%) |
| Total | 1,817 (100.0%) | 454 (100.0%) |
Housing Structure by Heating Type in Allendale borough
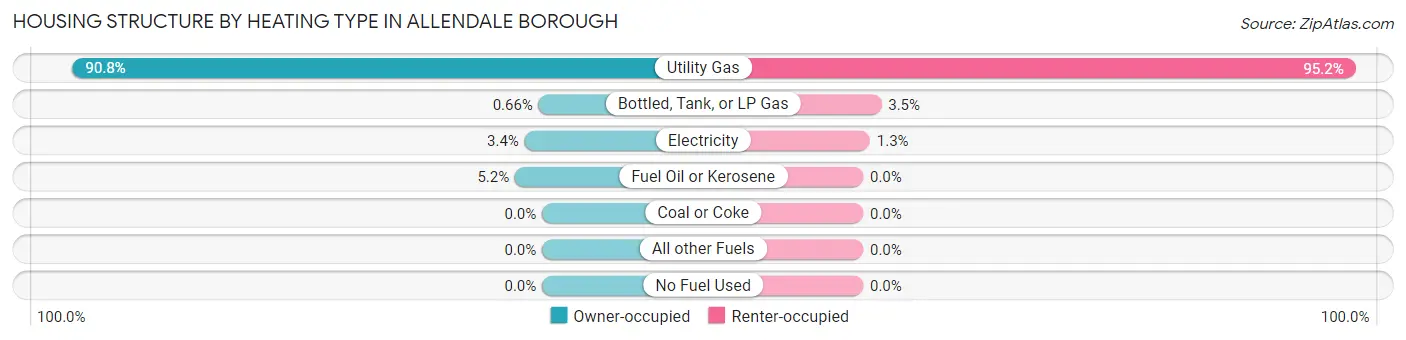
| Heating Type | Owner-occupied | Renter-occupied |
| Utility Gas | 1,649 (90.7%) | 432 (95.2%) |
| Bottled, Tank, or LP Gas | 12 (0.7%) | 16 (3.5%) |
| Electricity | 61 (3.4%) | 6 (1.3%) |
| Fuel Oil or Kerosene | 95 (5.2%) | 0 (0.0%) |
| Coal or Coke | 0 (0.0%) | 0 (0.0%) |
| All other Fuels | 0 (0.0%) | 0 (0.0%) |
| No Fuel Used | 0 (0.0%) | 0 (0.0%) |
| Total | 1,817 (100.0%) | 454 (100.0%) |
Household Vehicle Usage in Allendale borough
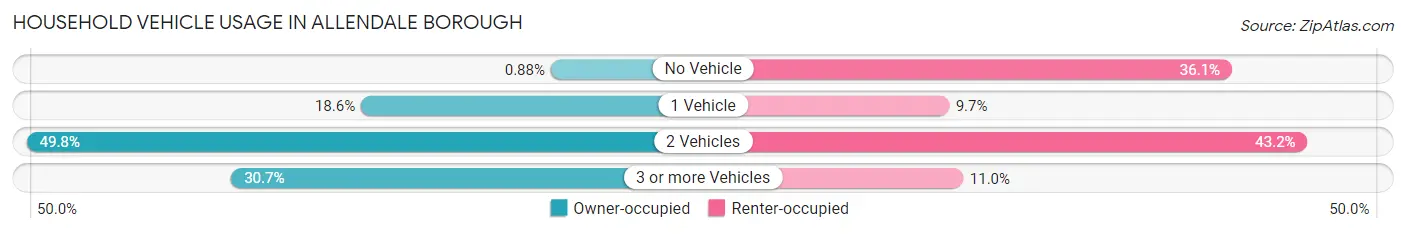
| Vehicles per Household | Owner-occupied | Renter-occupied |
| No Vehicle | 16 (0.9%) | 164 (36.1%) |
| 1 Vehicle | 338 (18.6%) | 44 (9.7%) |
| 2 Vehicles | 905 (49.8%) | 196 (43.2%) |
| 3 or more Vehicles | 558 (30.7%) | 50 (11.0%) |
| Total | 1,817 (100.0%) | 454 (100.0%) |
Real Estate & Mortgages in Allendale borough
Real Estate and Mortgage Overview in Allendale borough
| Characteristic | Without Mortgage | With Mortgage |
| Housing Units | 581 | 1,236 |
| Median Property Value | $811,800 | $709,400 |
| Median Household Income | $162,958 | $920 |
| Monthly Housing Costs | $1,501 | $1,004 |
| Real Estate Taxes | $10,001 | $38 |
Property Value by Mortgage Status in Allendale borough
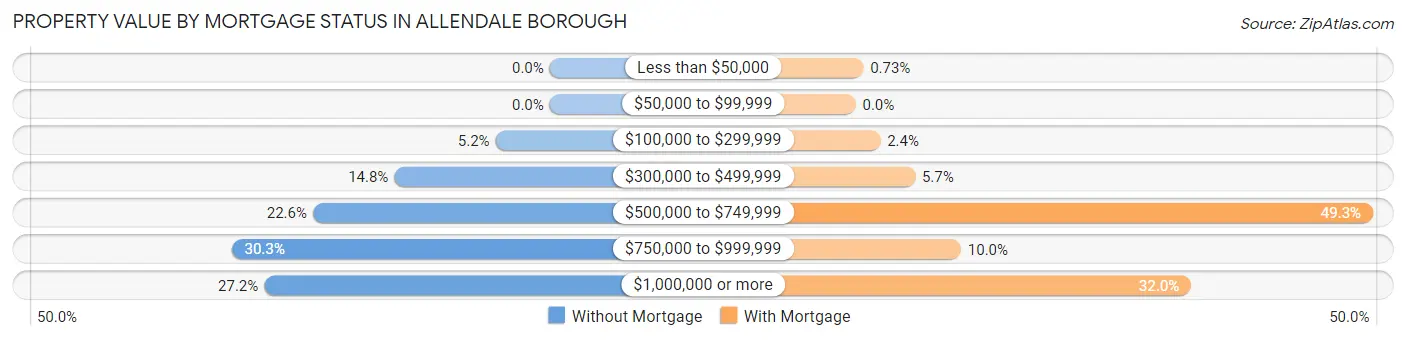
| Property Value | Without Mortgage | With Mortgage |
| Less than $50,000 | 0 (0.0%) | 9 (0.7%) |
| $50,000 to $99,999 | 0 (0.0%) | 0 (0.0%) |
| $100,000 to $299,999 | 30 (5.2%) | 29 (2.4%) |
| $300,000 to $499,999 | 86 (14.8%) | 70 (5.7%) |
| $500,000 to $749,999 | 131 (22.6%) | 609 (49.3%) |
| $750,000 to $999,999 | 176 (30.3%) | 124 (10.0%) |
| $1,000,000 or more | 158 (27.2%) | 395 (32.0%) |
| Total | 581 (100.0%) | 1,236 (100.0%) |
Household Income by Mortgage Status in Allendale borough
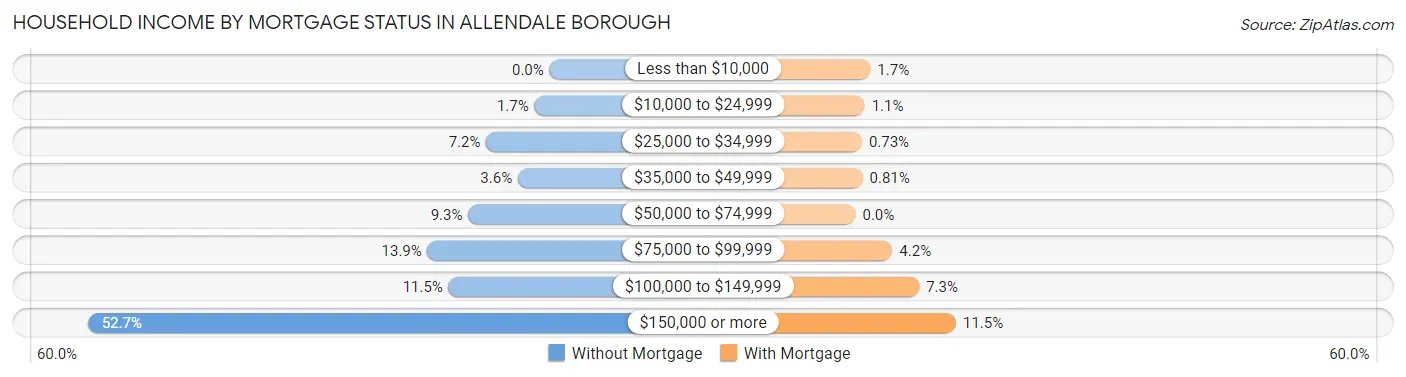
| Household Income | Without Mortgage | With Mortgage |
| Less than $10,000 | 0 (0.0%) | 21 (1.7%) |
| $10,000 to $24,999 | 10 (1.7%) | 13 (1.1%) |
| $25,000 to $34,999 | 42 (7.2%) | 9 (0.7%) |
| $35,000 to $49,999 | 21 (3.6%) | 10 (0.8%) |
| $50,000 to $74,999 | 54 (9.3%) | 0 (0.0%) |
| $75,000 to $99,999 | 81 (13.9%) | 52 (4.2%) |
| $100,000 to $149,999 | 67 (11.5%) | 90 (7.3%) |
| $150,000 or more | 306 (52.7%) | 142 (11.5%) |
| Total | 581 (100.0%) | 1,236 (100.0%) |
Property Value to Household Income Ratio in Allendale borough
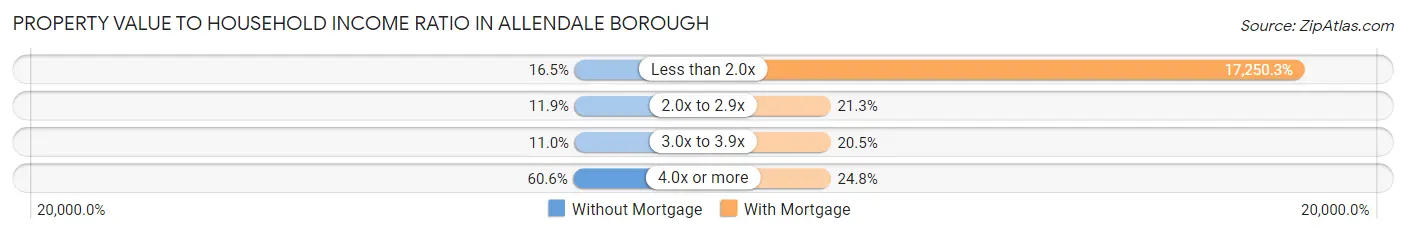
| Value-to-Income Ratio | Without Mortgage | With Mortgage |
| Less than 2.0x | 96 (16.5%) | 213,214 (17,250.3%) |
| 2.0x to 2.9x | 69 (11.9%) | 263 (21.3%) |
| 3.0x to 3.9x | 64 (11.0%) | 253 (20.5%) |
| 4.0x or more | 352 (60.6%) | 306 (24.8%) |
| Total | 581 (100.0%) | 1,236 (100.0%) |
Real Estate Taxes by Mortgage Status in Allendale borough
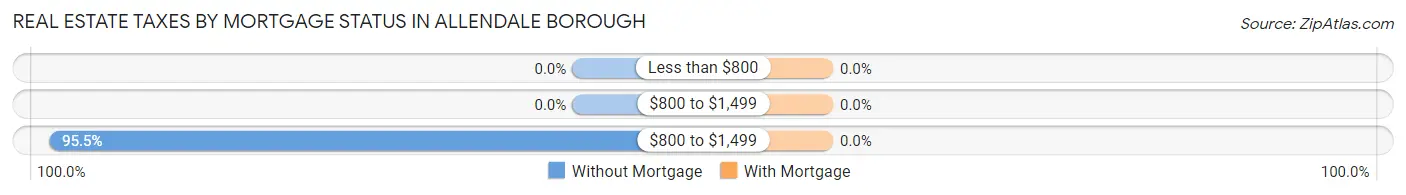
| Property Taxes | Without Mortgage | With Mortgage |
| Less than $800 | 0 (0.0%) | 0 (0.0%) |
| $800 to $1,499 | 0 (0.0%) | 0 (0.0%) |
| $800 to $1,499 | 555 (95.5%) | 0 (0.0%) |
| Total | 581 (100.0%) | 1,236 (100.0%) |
Health & Disability in Allendale borough
Health Insurance Coverage by Age in Allendale borough
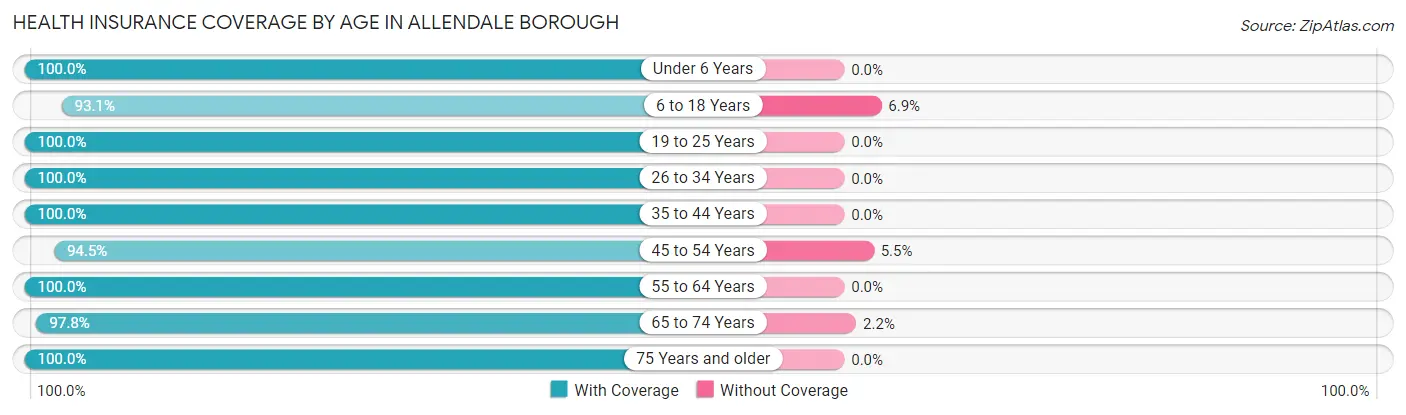
| Age Bracket | With Coverage | Without Coverage |
| Under 6 Years | 489 (100.0%) | 0 (0.0%) |
| 6 to 18 Years | 1,400 (93.1%) | 104 (6.9%) |
| 19 to 25 Years | 326 (100.0%) | 0 (0.0%) |
| 26 to 34 Years | 228 (100.0%) | 0 (0.0%) |
| 35 to 44 Years | 701 (100.0%) | 0 (0.0%) |
| 45 to 54 Years | 1,329 (94.5%) | 77 (5.5%) |
| 55 to 64 Years | 971 (100.0%) | 0 (0.0%) |
| 65 to 74 Years | 663 (97.8%) | 15 (2.2%) |
| 75 Years and older | 437 (100.0%) | 0 (0.0%) |
| Total | 6,544 (97.1%) | 196 (2.9%) |
Health Insurance Coverage by Citizenship Status in Allendale borough
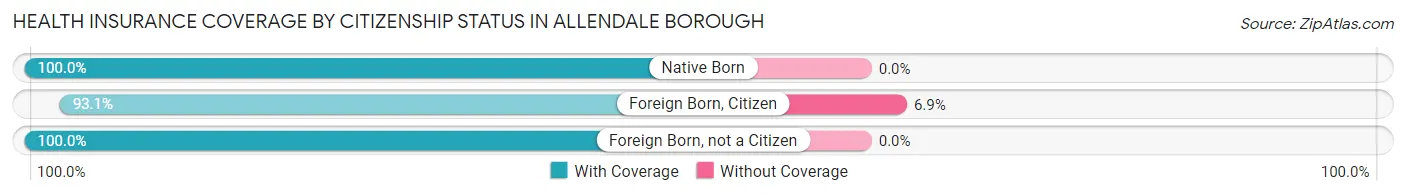
| Citizenship Status | With Coverage | Without Coverage |
| Native Born | 489 (100.0%) | 0 (0.0%) |
| Foreign Born, Citizen | 1,400 (93.1%) | 104 (6.9%) |
| Foreign Born, not a Citizen | 326 (100.0%) | 0 (0.0%) |
Health Insurance Coverage by Household Income in Allendale borough
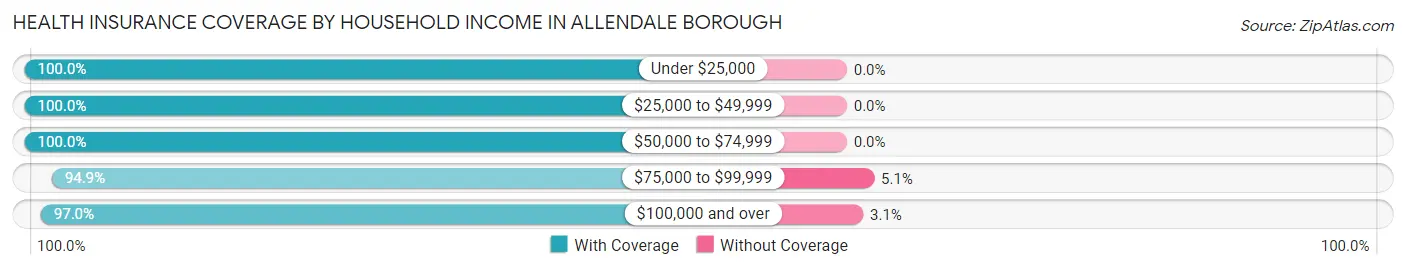
| Household Income | With Coverage | Without Coverage |
| Under $25,000 | 217 (100.0%) | 0 (0.0%) |
| $25,000 to $49,999 | 149 (100.0%) | 0 (0.0%) |
| $50,000 to $74,999 | 292 (100.0%) | 0 (0.0%) |
| $75,000 to $99,999 | 501 (94.9%) | 27 (5.1%) |
| $100,000 and over | 5,365 (97.0%) | 169 (3.0%) |
Public vs Private Health Insurance Coverage by Age in Allendale borough
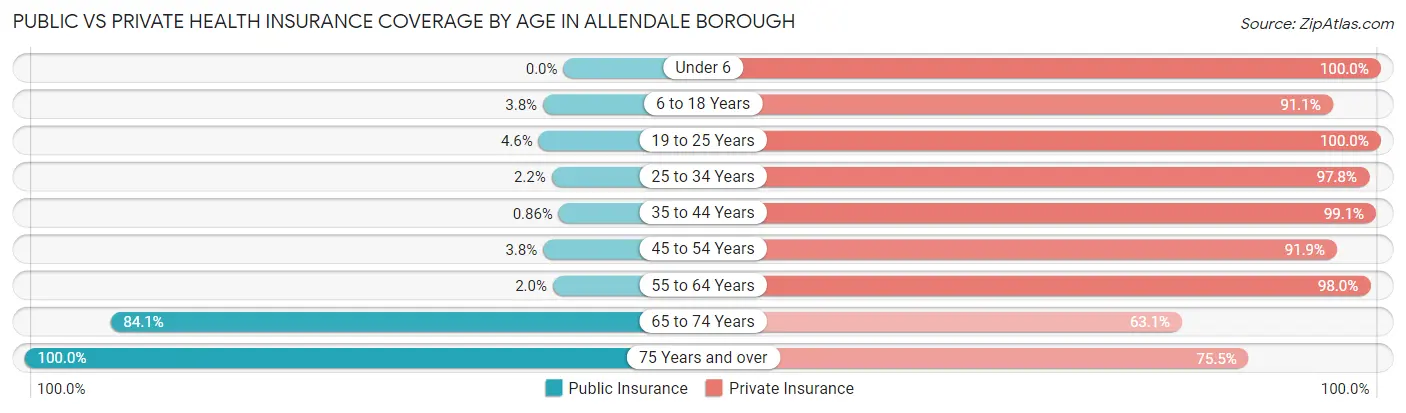
| Age Bracket | Public Insurance | Private Insurance |
| Under 6 | 0 (0.0%) | 489 (100.0%) |
| 6 to 18 Years | 57 (3.8%) | 1,370 (91.1%) |
| 19 to 25 Years | 15 (4.6%) | 326 (100.0%) |
| 25 to 34 Years | 5 (2.2%) | 223 (97.8%) |
| 35 to 44 Years | 6 (0.9%) | 695 (99.1%) |
| 45 to 54 Years | 53 (3.8%) | 1,292 (91.9%) |
| 55 to 64 Years | 19 (2.0%) | 952 (98.0%) |
| 65 to 74 Years | 570 (84.1%) | 428 (63.1%) |
| 75 Years and over | 437 (100.0%) | 330 (75.5%) |
| Total | 1,162 (17.2%) | 6,105 (90.6%) |
Disability Status by Sex by Age in Allendale borough
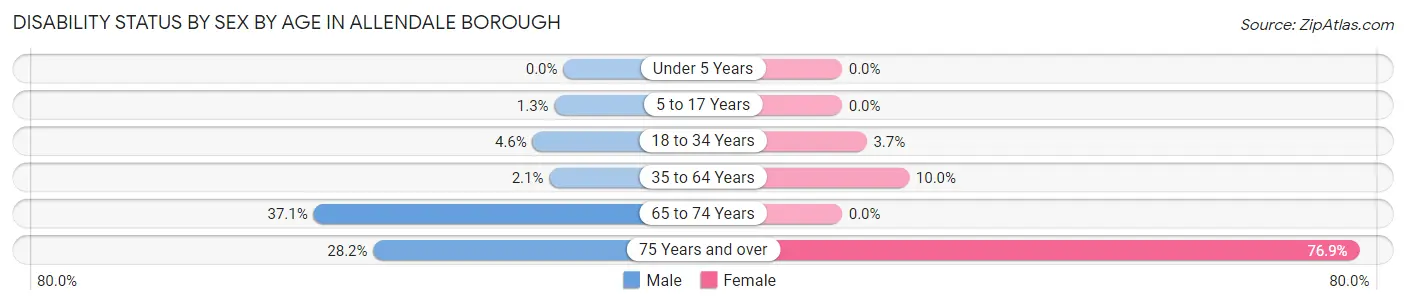
| Age Bracket | Male | Female |
| Under 5 Years | 0 (0.0%) | 0 (0.0%) |
| 5 to 17 Years | 8 (1.3%) | 0 (0.0%) |
| 18 to 34 Years | 13 (4.6%) | 12 (3.7%) |
| 35 to 64 Years | 31 (2.1%) | 158 (10.0%) |
| 65 to 74 Years | 102 (37.1%) | 0 (0.0%) |
| 75 Years and over | 55 (28.2%) | 186 (76.9%) |
Disability Class by Sex by Age in Allendale borough
Disability Class: Hearing Difficulty
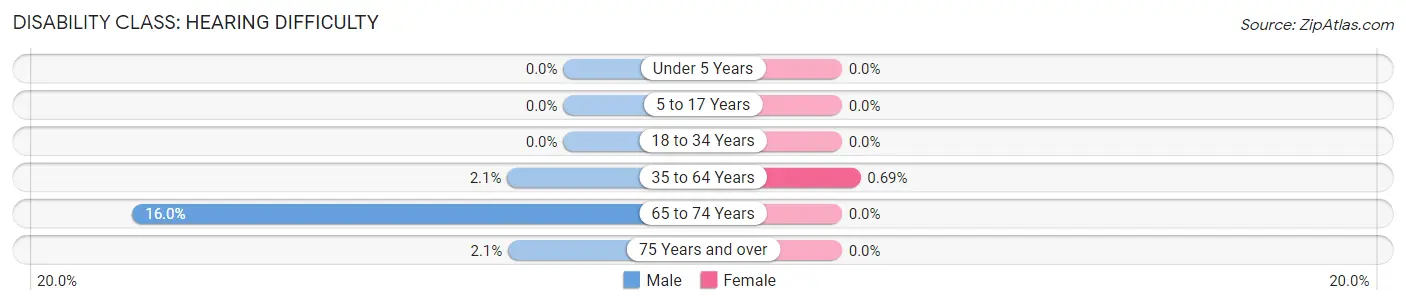
| Age Bracket | Male | Female |
| Under 5 Years | 0 (0.0%) | 0 (0.0%) |
| 5 to 17 Years | 0 (0.0%) | 0 (0.0%) |
| 18 to 34 Years | 0 (0.0%) | 0 (0.0%) |
| 35 to 64 Years | 31 (2.1%) | 11 (0.7%) |
| 65 to 74 Years | 44 (16.0%) | 0 (0.0%) |
| 75 Years and over | 4 (2.1%) | 0 (0.0%) |
Disability Class: Vision Difficulty
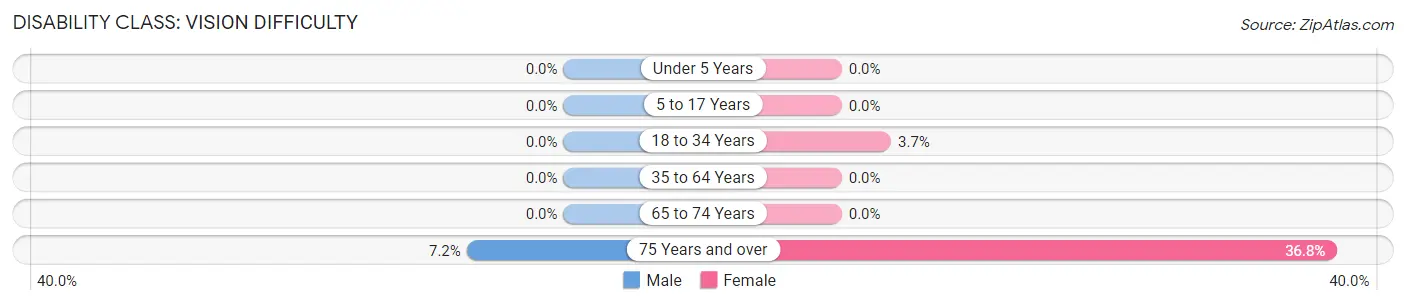
| Age Bracket | Male | Female |
| Under 5 Years | 0 (0.0%) | 0 (0.0%) |
| 5 to 17 Years | 0 (0.0%) | 0 (0.0%) |
| 18 to 34 Years | 0 (0.0%) | 12 (3.7%) |
| 35 to 64 Years | 0 (0.0%) | 0 (0.0%) |
| 65 to 74 Years | 0 (0.0%) | 0 (0.0%) |
| 75 Years and over | 14 (7.2%) | 89 (36.8%) |
Disability Class: Cognitive Difficulty
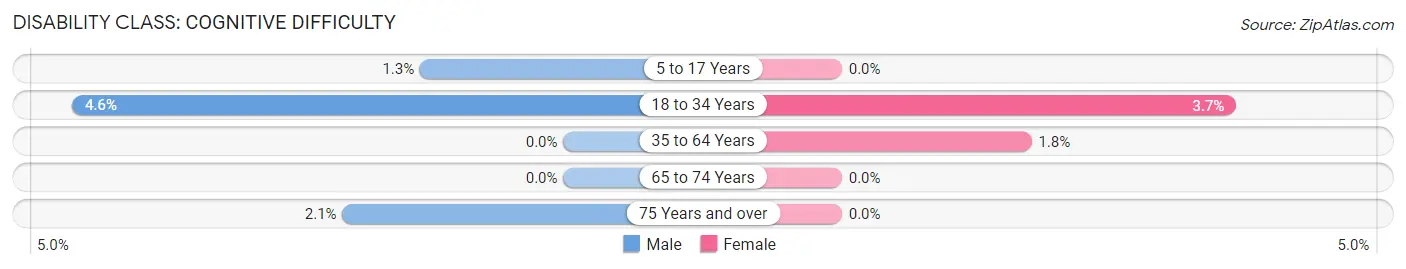
| Age Bracket | Male | Female |
| 5 to 17 Years | 8 (1.3%) | 0 (0.0%) |
| 18 to 34 Years | 13 (4.6%) | 12 (3.7%) |
| 35 to 64 Years | 0 (0.0%) | 28 (1.8%) |
| 65 to 74 Years | 0 (0.0%) | 0 (0.0%) |
| 75 Years and over | 4 (2.1%) | 0 (0.0%) |
Disability Class: Ambulatory Difficulty
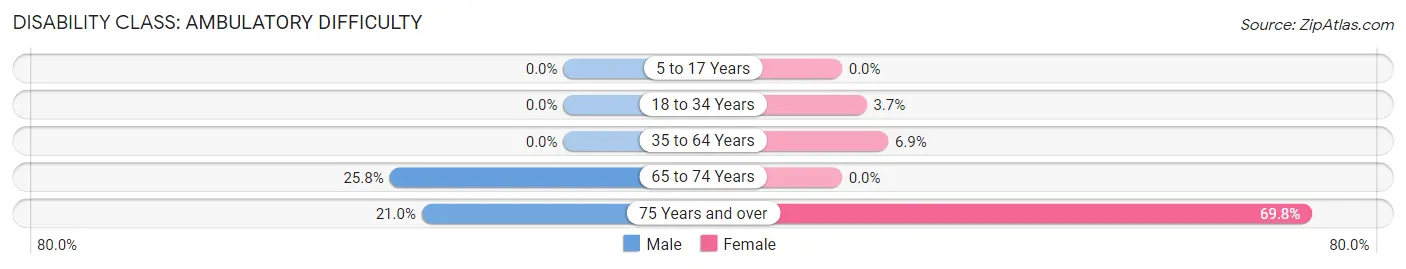
| Age Bracket | Male | Female |
| 5 to 17 Years | 0 (0.0%) | 0 (0.0%) |
| 18 to 34 Years | 0 (0.0%) | 12 (3.7%) |
| 35 to 64 Years | 0 (0.0%) | 109 (6.9%) |
| 65 to 74 Years | 71 (25.8%) | 0 (0.0%) |
| 75 Years and over | 41 (21.0%) | 169 (69.8%) |
Disability Class: Self-Care Difficulty
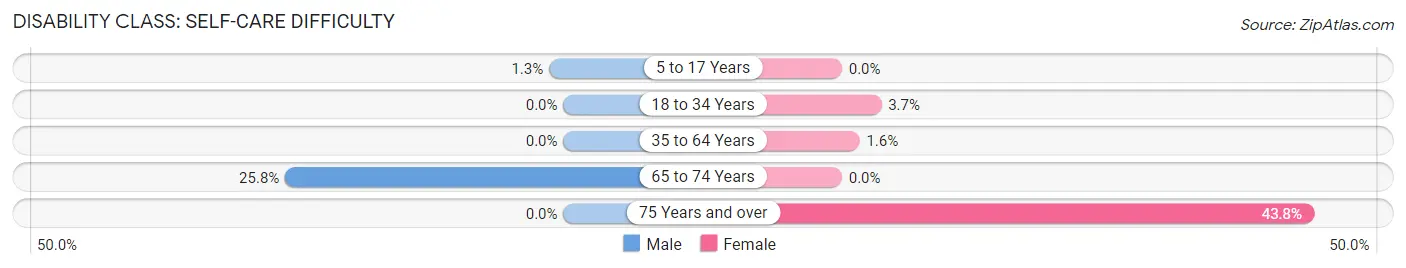
| Age Bracket | Male | Female |
| 5 to 17 Years | 8 (1.3%) | 0 (0.0%) |
| 18 to 34 Years | 0 (0.0%) | 12 (3.7%) |
| 35 to 64 Years | 0 (0.0%) | 26 (1.6%) |
| 65 to 74 Years | 71 (25.8%) | 0 (0.0%) |
| 75 Years and over | 0 (0.0%) | 106 (43.8%) |
Technology Access in Allendale borough
Computing Device Access in Allendale borough
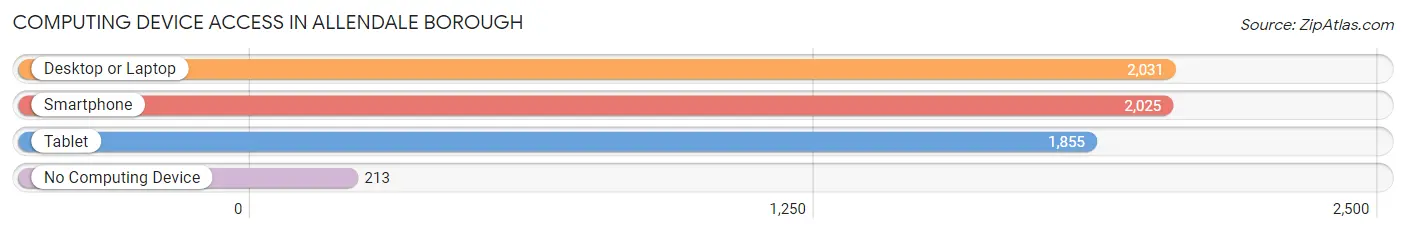
| Device Type | # Households | % Households |
| Desktop or Laptop | 2,031 | 89.4% |
| Smartphone | 2,025 | 89.2% |
| Tablet | 1,855 | 81.7% |
| No Computing Device | 213 | 9.4% |
| Total | 2,271 | 100.0% |
Internet Access in Allendale borough
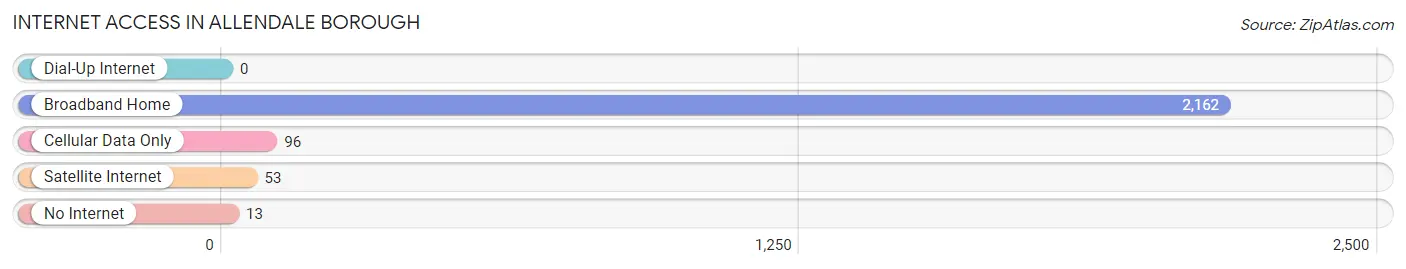
| Internet Type | # Households | % Households |
| Dial-Up Internet | 0 | 0.0% |
| Broadband Home | 2,162 | 95.2% |
| Cellular Data Only | 96 | 4.2% |
| Satellite Internet | 53 | 2.3% |
| No Internet | 13 | 0.6% |
| Total | 2,271 | 100.0% |
Allendale borough Summary
Allendale Borough is a small borough located in Bergen County, New Jersey. It is situated in the northern part of the state, approximately 20 miles northwest of New York City. The borough is bordered by the towns of Waldwick, Saddle River, Ramsey, and Mahwah. Allendale is a residential community with a population of 6,505 as of the 2010 census.
History
Allendale was originally part of the larger area of Franklin Township, which was established in 1772. In 1894, the area was incorporated as the Borough of Allendale. The name of the borough is derived from the Allendale family, who were among the first settlers in the area. The Allendale family owned a large tract of land in the area, which was eventually divided into smaller lots and sold to other settlers.
Geography
Allendale is located at 40°58'N 74°09'W (40.967, -74.150). According to the United States Census Bureau, the borough has a total area of 2.7 square miles, all of which is land. The borough is located in the Ramapo Valley, which is part of the Great Appalachian Valley. The borough is located in the Piedmont region of New Jersey, which is characterized by rolling hills and valleys.
Economy
Allendale is primarily a residential community, with most of its residents commuting to nearby cities for work. The borough does not have any major industries or businesses. However, there are several small businesses located in the borough, including restaurants, retail stores, and professional services.
Demographics
As of the 2010 census, there were 6,505 people, 2,521 households, and 1,845 families residing in the borough. The population density was 2,400.3 people per square mile. The racial makeup of the borough was 92.2% White, 2.2% African American, 0.2% Native American, 3.3% Asian, 0.7% from other races, and 1.4% from two or more races. Hispanic or Latino of any race were 4.2% of the population.
The median age in the borough was 43.2 years. 22.2% of residents were under the age of 18; 6.2% were between the ages of 18 and 24; 24.3% were from 25 to 44; 33.2% were from 45 to 64; and 14.1% were 65 years of age or older. The gender makeup of the borough was 48.3% male and 51.7% female.
The median income for a household in the borough was $107,917, and the median income for a family was $125,917. The per capita income for the borough was $50,917. About 1.7% of families and 2.7% of the population were below the poverty line, including 2.2% of those under age 18 and 2.2% of those age 65 or over.
Conclusion
Allendale Borough is a small residential community located in Bergen County, New Jersey. It is situated in the northern part of the state, approximately 20 miles northwest of New York City. The borough was originally part of the larger area of Franklin Township, which was established in 1772. In 1894, the area was incorporated as the Borough of Allendale. The borough is primarily a residential community, with most of its residents commuting to nearby cities for work. As of the 2010 census, the population of Allendale was 6,505. The racial makeup of the borough was 92.2% White, 2.2% African American, 0.2% Native American, 3.3% Asian, 0.7% from other races, and 1.4% from two or more races. The median income for a household in the borough was $107,917, and the median income for a family was $125,917. Allendale is a small, residential community with a diverse population and a strong economy.
Common Questions
What is Per Capita Income in Allendale borough?
Per Capita income in Allendale borough is $92,202.
What is the Median Family Income in Allendale borough?
Median Family Income in Allendale borough is $206,615.
What is the Median Household income in Allendale borough?
Median Household Income in Allendale borough is $163,875.
What is Income or Wage Gap in Allendale borough?
Income or Wage Gap in Allendale borough is 59.3%.
Women in Allendale borough earn 40.7 cents for every dollar earned by a man.
What is Inequality or Gini Index in Allendale borough?
Inequality or Gini Index in Allendale borough is 0.52.
What is the Total Population of Allendale borough?
Total Population of Allendale borough is 6,817.
What is the Total Male Population of Allendale borough?
Total Male Population of Allendale borough is 3,186.
What is the Total Female Population of Allendale borough?
Total Female Population of Allendale borough is 3,631.
What is the Ratio of Males per 100 Females in Allendale borough?
There are 87.74 Males per 100 Females in Allendale borough.
What is the Ratio of Females per 100 Males in Allendale borough?
There are 113.97 Females per 100 Males in Allendale borough.
What is the Median Population Age in Allendale borough?
Median Population Age in Allendale borough is 45.7 Years.
What is the Average Family Size in Allendale borough
Average Family Size in Allendale borough is 3.5 People.
What is the Average Household Size in Allendale borough
Average Household Size in Allendale borough is 3.0 People.
How Large is the Labor Force in Allendale borough?
There are 3,089 People in the Labor Forcein in Allendale borough.
What is the Percentage of People in the Labor Force in Allendale borough?
59.7% of People are in the Labor Force in Allendale borough.
What is the Unemployment Rate in Allendale borough?
Unemployment Rate in Allendale borough is 3.6%.