South Plainfield borough, NJ Map & Demographics
South Plainfield borough Overview
$48,206
PER CAPITA INCOME
$145,288
AVG FAMILY INCOME
$123,417
AVG HOUSEHOLD INCOME
23.1%
WAGE / INCOME GAP [ % ]
76.9¢/ $1
WAGE / INCOME GAP [ $ ]
$10,381
FAMILY INCOME DEFICIT
0.34
INEQUALITY / GINI INDEX
24,273
TOTAL POPULATION
11,872
MALE POPULATION
12,401
FEMALE POPULATION
95.73
MALES / 100 FEMALES
104.46
FEMALES / 100 MALES
41.8
MEDIAN AGE
3.3
AVG FAMILY SIZE
2.9
AVG HOUSEHOLD SIZE
13,872
LABOR FORCE [ PEOPLE ]
69.6%
PERCENT IN LABOR FORCE
7.2%
UNEMPLOYMENT RATE
Income in South Plainfield borough
Income Overview in South Plainfield borough
Per Capita Income in South Plainfield borough is $48,206, while median incomes of families and households are $145,288 and $123,417 respectively.
| Characteristic | Number | Measure |
| Per Capita Income | 24,273 | $48,206 |
| Median Family Income | 6,603 | $145,288 |
| Mean Family Income | 6,603 | $156,020 |
| Median Household Income | 8,150 | $123,417 |
| Mean Household Income | 8,150 | $140,782 |
| Income Deficit | 6,603 | $10,381 |
| Wage / Income Gap (%) | 24,273 | 23.11% |
| Wage / Income Gap ($) | 24,273 | 76.89¢ per $1 |
| Gini / Inequality Index | 24,273 | 0.34 |
Earnings by Sex in South Plainfield borough
Average Earnings in South Plainfield borough are $59,925, $66,869 for men and $51,415 for women, a difference of 23.1%.
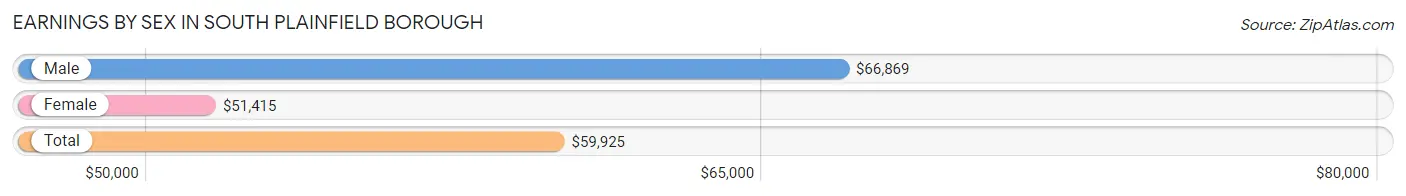
| Sex | Number | Average Earnings |
| Male | 7,748 (55.4%) | $66,869 |
| Female | 6,230 (44.6%) | $51,415 |
| Total | 13,978 (100.0%) | $59,925 |
Earnings by Sex by Income Bracket in South Plainfield borough
The most common earnings brackets in South Plainfield borough are $100,000+ for men (1,911 | 24.7%) and $100,000+ for women (1,301 | 20.9%).
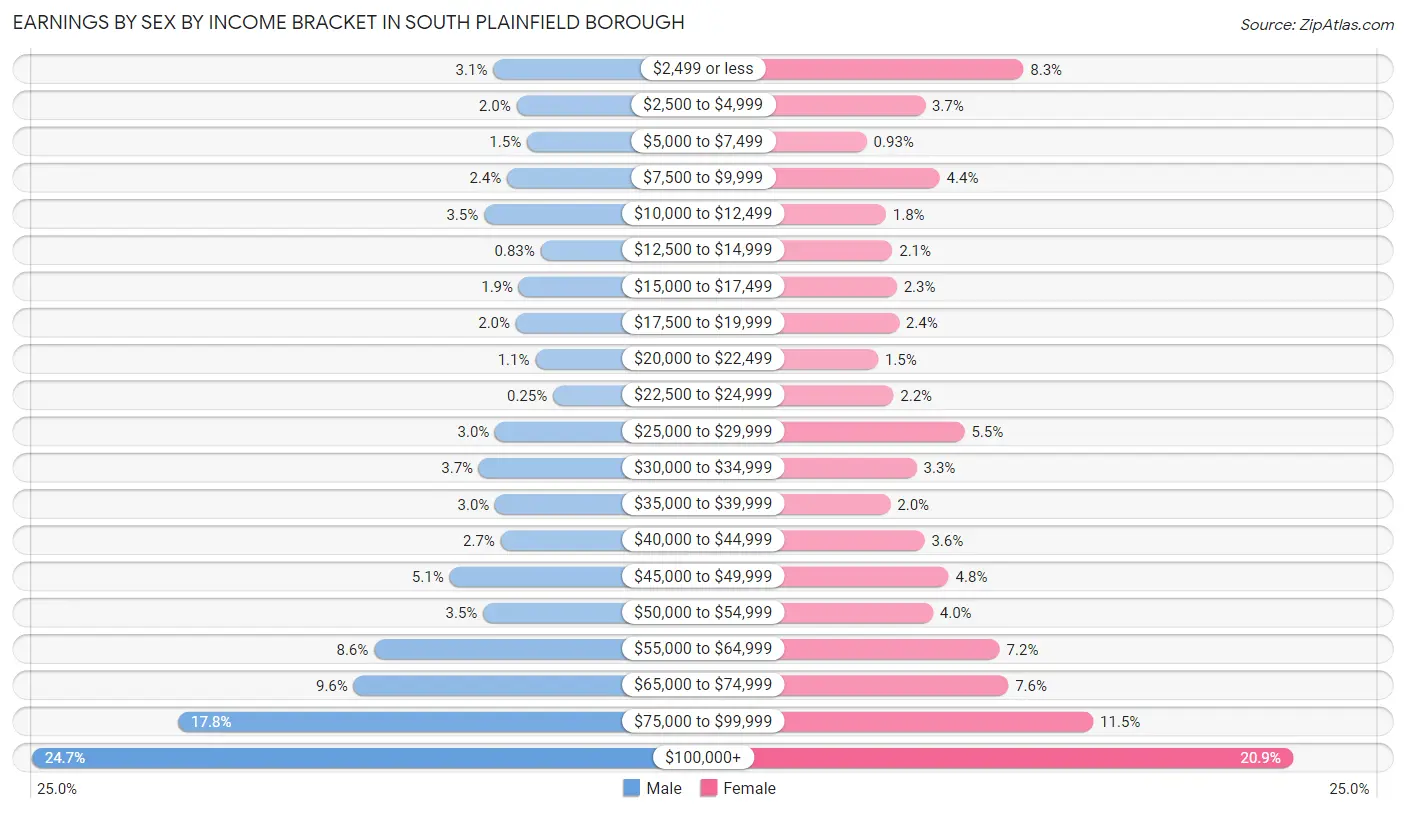
| Income | Male | Female |
| $2,499 or less | 236 (3.0%) | 515 (8.3%) |
| $2,500 to $4,999 | 152 (2.0%) | 228 (3.7%) |
| $5,000 to $7,499 | 114 (1.5%) | 58 (0.9%) |
| $7,500 to $9,999 | 186 (2.4%) | 271 (4.3%) |
| $10,000 to $12,499 | 270 (3.5%) | 114 (1.8%) |
| $12,500 to $14,999 | 64 (0.8%) | 133 (2.1%) |
| $15,000 to $17,499 | 143 (1.8%) | 146 (2.3%) |
| $17,500 to $19,999 | 154 (2.0%) | 152 (2.4%) |
| $20,000 to $22,499 | 84 (1.1%) | 91 (1.5%) |
| $22,500 to $24,999 | 19 (0.3%) | 136 (2.2%) |
| $25,000 to $29,999 | 229 (3.0%) | 343 (5.5%) |
| $30,000 to $34,999 | 288 (3.7%) | 204 (3.3%) |
| $35,000 to $39,999 | 229 (3.0%) | 127 (2.0%) |
| $40,000 to $44,999 | 209 (2.7%) | 227 (3.6%) |
| $45,000 to $49,999 | 395 (5.1%) | 297 (4.8%) |
| $50,000 to $54,999 | 273 (3.5%) | 251 (4.0%) |
| $55,000 to $64,999 | 669 (8.6%) | 446 (7.2%) |
| $65,000 to $74,999 | 743 (9.6%) | 471 (7.6%) |
| $75,000 to $99,999 | 1,380 (17.8%) | 719 (11.5%) |
| $100,000+ | 1,911 (24.7%) | 1,301 (20.9%) |
| Total | 7,748 (100.0%) | 6,230 (100.0%) |
Earnings by Sex by Educational Attainment in South Plainfield borough
Average earnings in South Plainfield borough are $73,469 for men and $56,648 for women, a difference of 22.9%. Men with an educational attainment of graduate degree enjoy the highest average annual earnings of $89,911, while those with less than high school education earn the least with $34,410. Women with an educational attainment of graduate degree earn the most with the average annual earnings of $80,417, while those with less than high school education have the smallest earnings of $2,499.
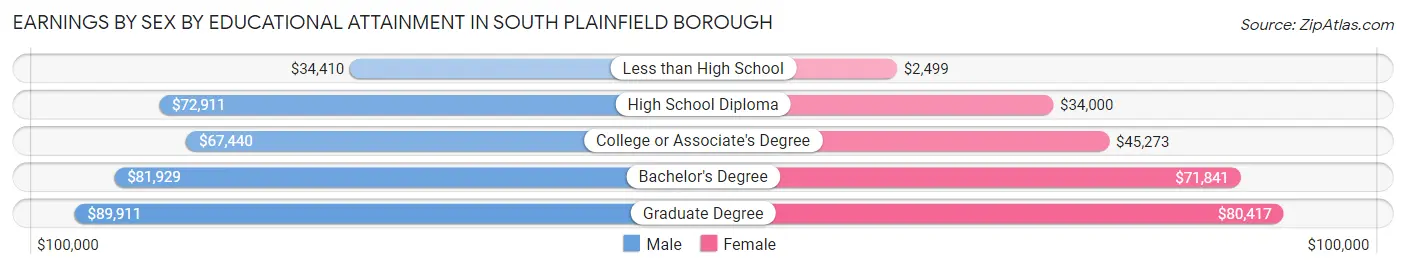
| Educational Attainment | Male Income | Female Income |
| Less than High School | $34,410 | $2,499 |
| High School Diploma | $72,911 | $34,000 |
| College or Associate's Degree | $67,440 | $45,273 |
| Bachelor's Degree | $81,929 | $71,841 |
| Graduate Degree | $89,911 | $80,417 |
| Total | $73,469 | $56,648 |
Family Income in South Plainfield borough
Family Income Brackets in South Plainfield borough
According to the South Plainfield borough family income data, there are 1,737 families falling into the $200,000+ income range, which is the most common income bracket and makes up 26.3% of all families. Conversely, the $10,000 to $14,999 income bracket is the least frequent group with only 13 families (0.2%) belonging to this category.
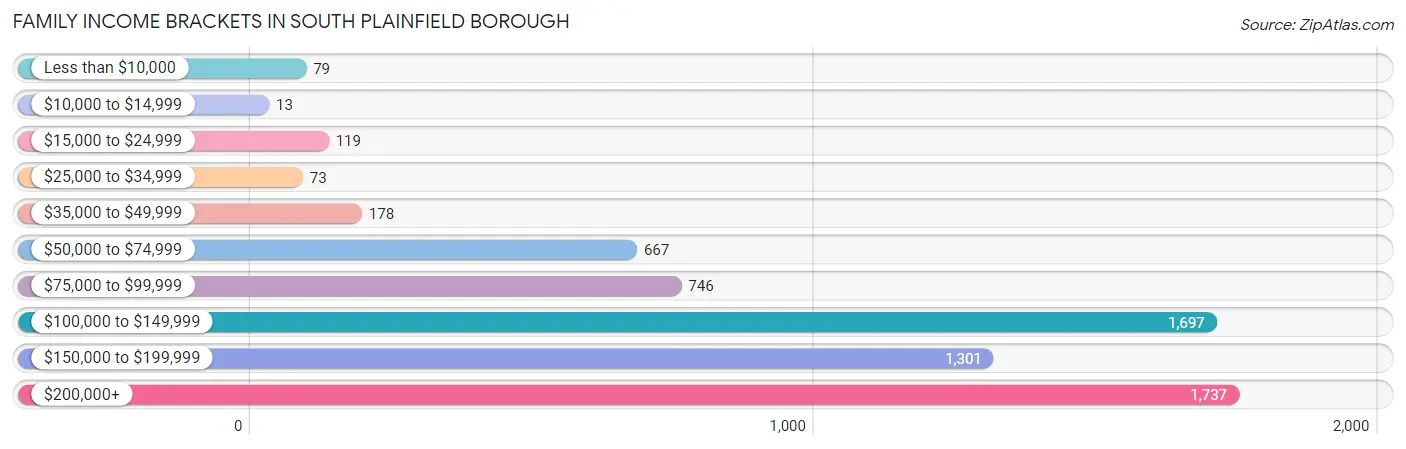
| Income Bracket | # Families | % Families |
| Less than $10,000 | 79 | 1.2% |
| $10,000 to $14,999 | 13 | 0.2% |
| $15,000 to $24,999 | 119 | 1.8% |
| $25,000 to $34,999 | 73 | 1.1% |
| $35,000 to $49,999 | 178 | 2.7% |
| $50,000 to $74,999 | 667 | 10.1% |
| $75,000 to $99,999 | 746 | 11.3% |
| $100,000 to $149,999 | 1,697 | 25.7% |
| $150,000 to $199,999 | 1,301 | 19.7% |
| $200,000+ | 1,737 | 26.3% |
Family Income by Famaliy Size in South Plainfield borough
6-person families (210 | 3.2%) account for the highest median family income in South Plainfield borough with $226,736 per family, while 2-person families (2,558 | 38.7%) have the highest median income of $59,158 per family member.
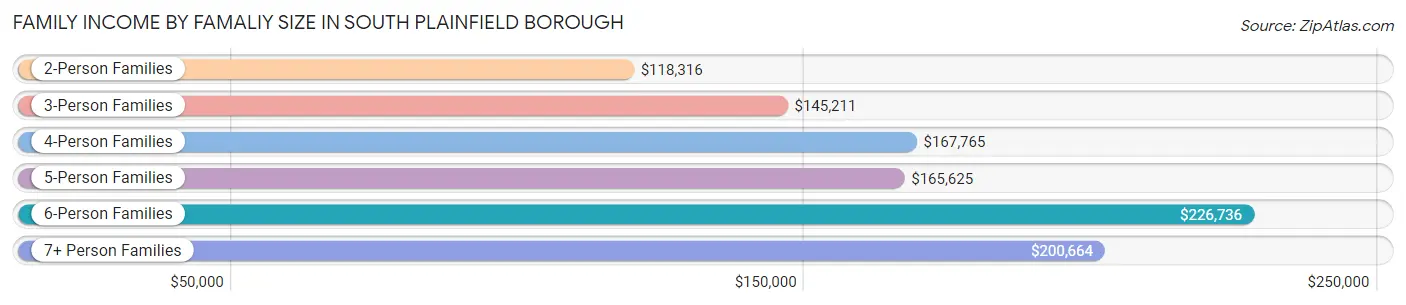
| Income Bracket | # Families | Median Income |
| 2-Person Families | 2,558 (38.7%) | $118,316 |
| 3-Person Families | 1,515 (22.9%) | $145,211 |
| 4-Person Families | 1,555 (23.5%) | $167,765 |
| 5-Person Families | 556 (8.4%) | $165,625 |
| 6-Person Families | 210 (3.2%) | $226,736 |
| 7+ Person Families | 209 (3.2%) | $200,664 |
| Total | 6,603 (100.0%) | $145,288 |
Family Income by Number of Earners in South Plainfield borough
The median family income in South Plainfield borough is $145,288, with families comprising 3+ earners (1,527) having the highest median family income of $201,005, while families with no earners (604) have the lowest median family income of $66,786, accounting for 23.1% and 9.1% of families, respectively.
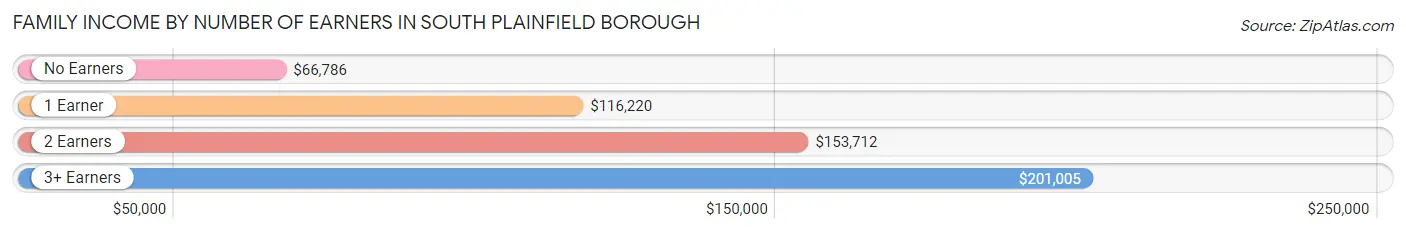
| Number of Earners | # Families | Median Income |
| No Earners | 604 (9.1%) | $66,786 |
| 1 Earner | 1,690 (25.6%) | $116,220 |
| 2 Earners | 2,782 (42.1%) | $153,712 |
| 3+ Earners | 1,527 (23.1%) | $201,005 |
| Total | 6,603 (100.0%) | $145,288 |
Household Income in South Plainfield borough
Household Income Brackets in South Plainfield borough
With 1,989 households falling in the category, the $100,000 to $149,999 income range is the most frequent in South Plainfield borough, accounting for 24.4% of all households. In contrast, only 41 households (0.5%) fall into the $10,000 to $14,999 income bracket, making it the least populous group.
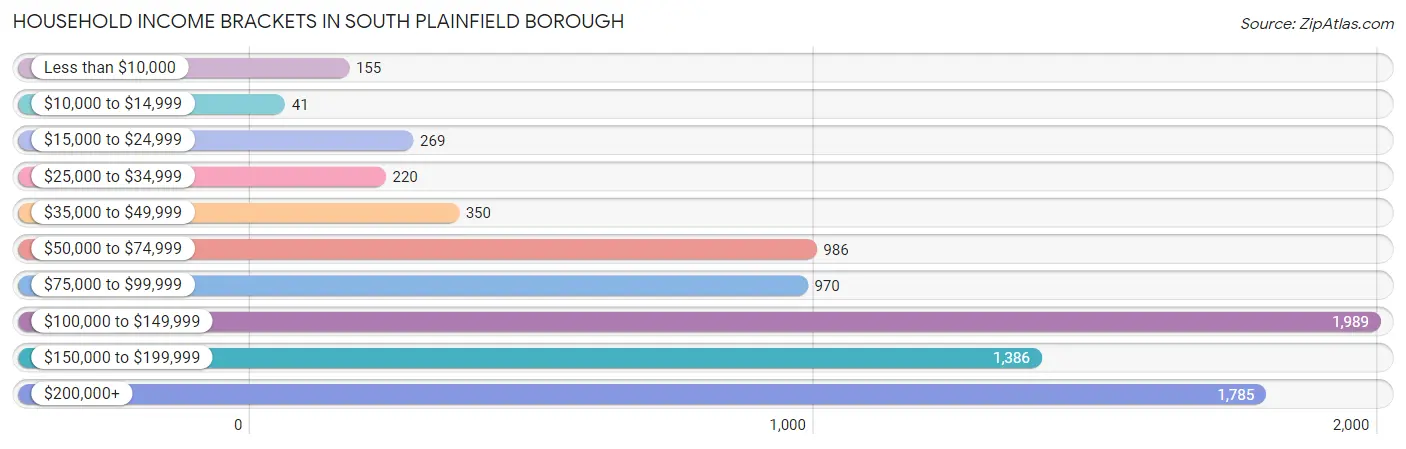
| Income Bracket | # Households | % Households |
| Less than $10,000 | 155 | 1.9% |
| $10,000 to $14,999 | 41 | 0.5% |
| $15,000 to $24,999 | 269 | 3.3% |
| $25,000 to $34,999 | 220 | 2.7% |
| $35,000 to $49,999 | 350 | 4.3% |
| $50,000 to $74,999 | 986 | 12.1% |
| $75,000 to $99,999 | 970 | 11.9% |
| $100,000 to $149,999 | 1,989 | 24.4% |
| $150,000 to $199,999 | 1,386 | 17.0% |
| $200,000+ | 1,785 | 21.9% |
Household Income by Householder Age in South Plainfield borough
The median household income in South Plainfield borough is $123,417, with the highest median household income of $147,151 found in the 45 to 64 years age bracket for the primary householder. A total of 3,230 households (39.6%) fall into this category. Meanwhile, the 15 to 24 years age bracket for the primary householder has the lowest median household income of $0, with 10 households (0.1%) in this group.
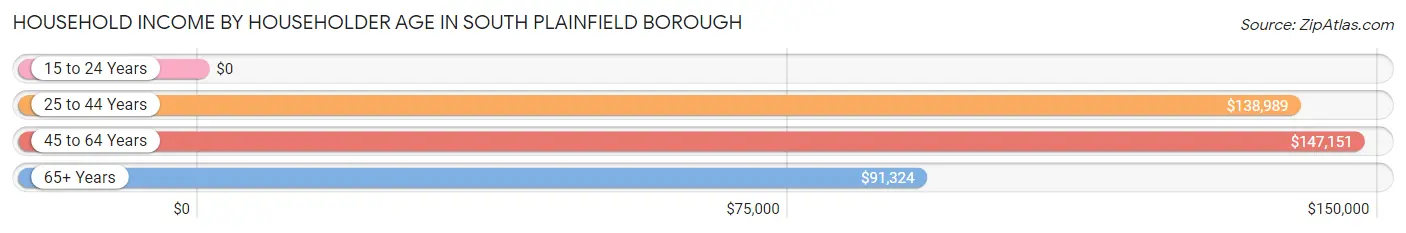
| Income Bracket | # Households | Median Income |
| 15 to 24 Years | 10 (0.1%) | $0 |
| 25 to 44 Years | 2,558 (31.4%) | $138,989 |
| 45 to 64 Years | 3,230 (39.6%) | $147,151 |
| 65+ Years | 2,352 (28.9%) | $91,324 |
| Total | 8,150 (100.0%) | $123,417 |
Poverty in South Plainfield borough
Income Below Poverty by Sex and Age in South Plainfield borough
With 3.0% poverty level for males and 4.3% for females among the residents of South Plainfield borough, 18 to 24 year old males and 12 to 14 year old females are the most vulnerable to poverty, with 62 males (6.7%) and 74 females (13.5%) in their respective age groups living below the poverty level.
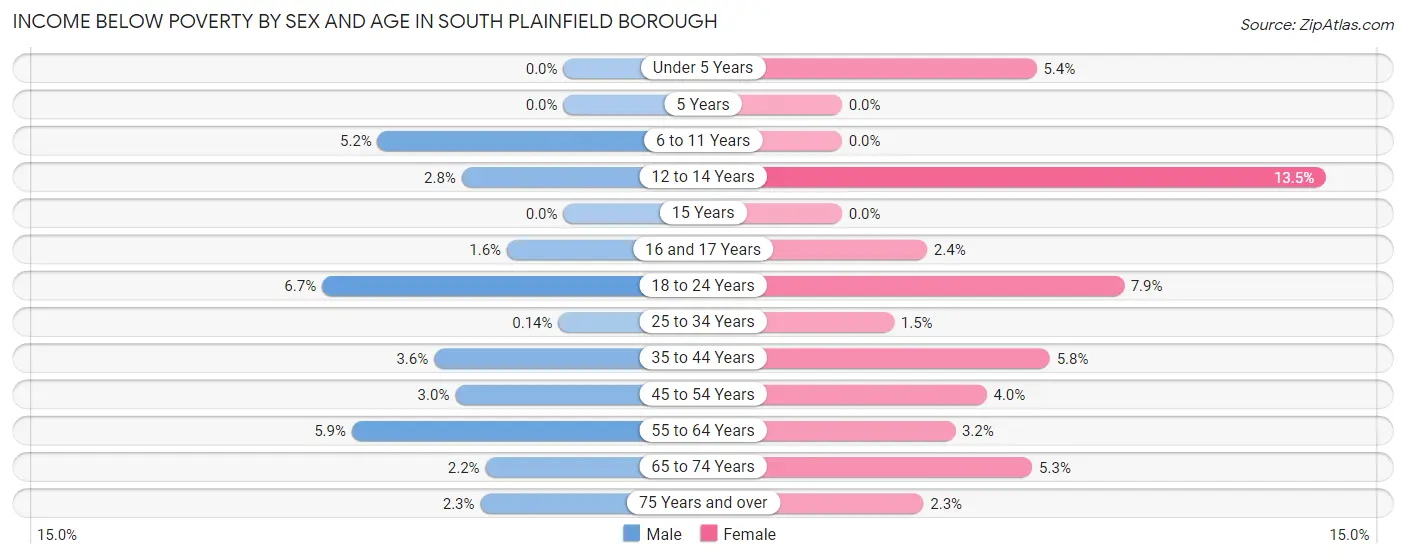
| Age Bracket | Male | Female |
| Under 5 Years | 0 (0.0%) | 56 (5.4%) |
| 5 Years | 0 (0.0%) | 0 (0.0%) |
| 6 to 11 Years | 31 (5.2%) | 0 (0.0%) |
| 12 to 14 Years | 9 (2.8%) | 74 (13.5%) |
| 15 Years | 0 (0.0%) | 0 (0.0%) |
| 16 and 17 Years | 5 (1.6%) | 5 (2.4%) |
| 18 to 24 Years | 62 (6.7%) | 58 (7.9%) |
| 25 to 34 Years | 3 (0.1%) | 21 (1.5%) |
| 35 to 44 Years | 58 (3.6%) | 96 (5.8%) |
| 45 to 54 Years | 49 (3.0%) | 62 (4.0%) |
| 55 to 64 Years | 92 (5.9%) | 57 (3.2%) |
| 65 to 74 Years | 26 (2.2%) | 71 (5.3%) |
| 75 Years and over | 14 (2.3%) | 24 (2.3%) |
| Total | 349 (3.0%) | 524 (4.3%) |
Income Above Poverty by Sex and Age in South Plainfield borough
According to the poverty statistics in South Plainfield borough, males aged under 5 years and females aged 5 years are the age groups that are most secure financially, with 100.0% of males and 100.0% of females in these age groups living above the poverty line.
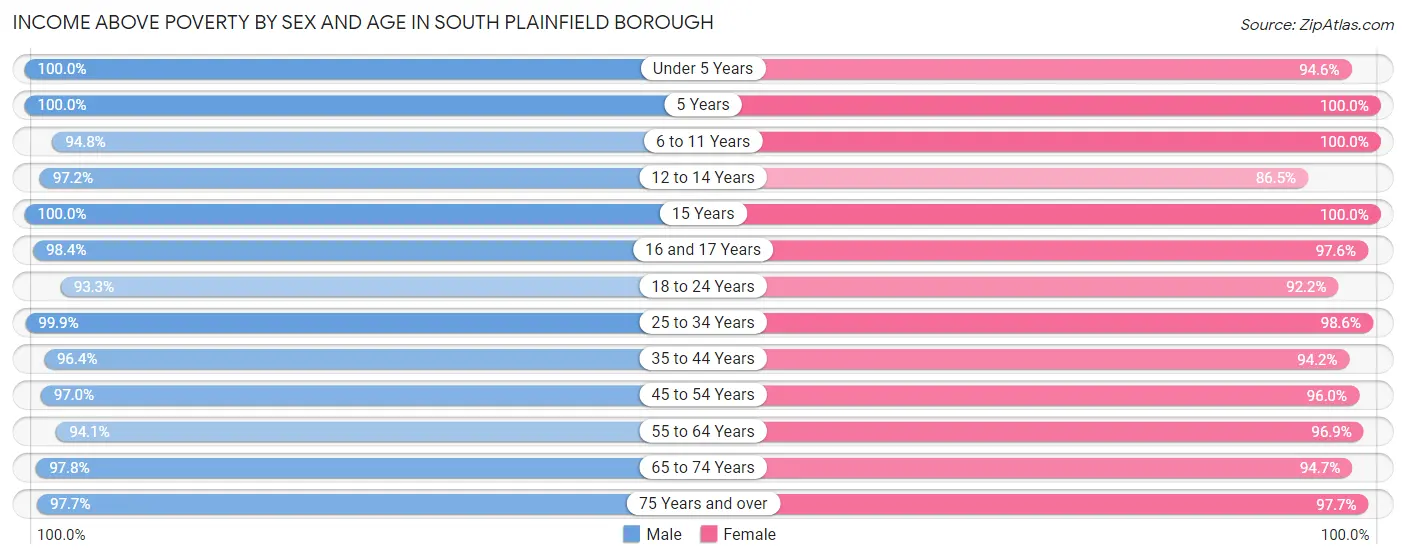
| Age Bracket | Male | Female |
| Under 5 Years | 605 (100.0%) | 978 (94.6%) |
| 5 Years | 119 (100.0%) | 141 (100.0%) |
| 6 to 11 Years | 569 (94.8%) | 639 (100.0%) |
| 12 to 14 Years | 309 (97.2%) | 475 (86.5%) |
| 15 Years | 237 (100.0%) | 57 (100.0%) |
| 16 and 17 Years | 313 (98.4%) | 206 (97.6%) |
| 18 to 24 Years | 861 (93.3%) | 681 (92.1%) |
| 25 to 34 Years | 2,069 (99.9%) | 1,424 (98.6%) |
| 35 to 44 Years | 1,555 (96.4%) | 1,563 (94.2%) |
| 45 to 54 Years | 1,581 (97.0%) | 1,475 (96.0%) |
| 55 to 64 Years | 1,471 (94.1%) | 1,752 (96.9%) |
| 65 to 74 Years | 1,172 (97.8%) | 1,268 (94.7%) |
| 75 Years and over | 592 (97.7%) | 1,034 (97.7%) |
| Total | 11,453 (97.0%) | 11,693 (95.7%) |
Income Below Poverty Among Married-Couple Families in South Plainfield borough
The poverty statistics for married-couple families in South Plainfield borough show that 1.6% or 91 of the total 5,538 families live below the poverty line. Families with 1 or 2 children have the highest poverty rate of 3.2%, comprising of 72 families. On the other hand, families with 3 or 4 children have the lowest poverty rate of 0.0%, which includes 0 families.
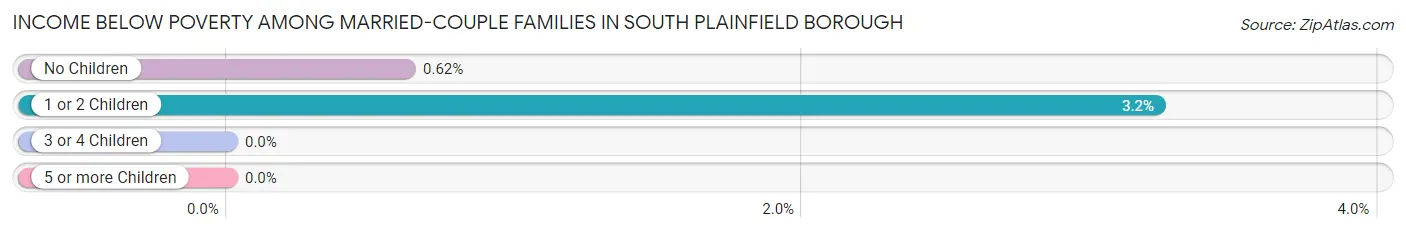
| Children | Above Poverty | Below Poverty |
| No Children | 3,047 (99.4%) | 19 (0.6%) |
| 1 or 2 Children | 2,155 (96.8%) | 72 (3.2%) |
| 3 or 4 Children | 243 (100.0%) | 0 (0.0%) |
| 5 or more Children | 2 (100.0%) | 0 (0.0%) |
| Total | 5,447 (98.4%) | 91 (1.6%) |
Income Below Poverty Among Single-Parent Households in South Plainfield borough
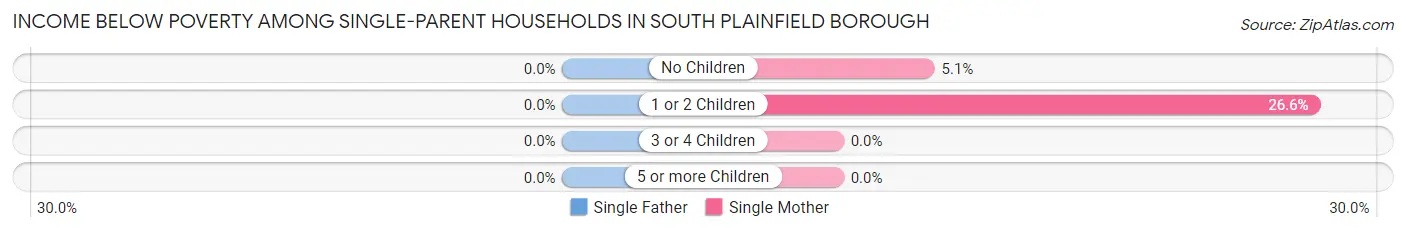
| Children | Single Father | Single Mother |
| No Children | 0 (0.0%) | 22 (5.1%) |
| 1 or 2 Children | 0 (0.0%) | 69 (26.6%) |
| 3 or 4 Children | 0 (0.0%) | 0 (0.0%) |
| 5 or more Children | 0 (0.0%) | 0 (0.0%) |
| Total | 0 (0.0%) | 91 (11.8%) |
Income Below Poverty Among Married-Couple vs Single-Parent Households in South Plainfield borough
The poverty data for South Plainfield borough shows that 91 of the married-couple family households (1.6%) and 91 of the single-parent households (8.5%) are living below the poverty level. Within the married-couple family households, those with 1 or 2 children have the highest poverty rate, with 72 households (3.2%) falling below the poverty line. Among the single-parent households, those with 1 or 2 children have the highest poverty rate, with 69 household (18.2%) living below poverty.
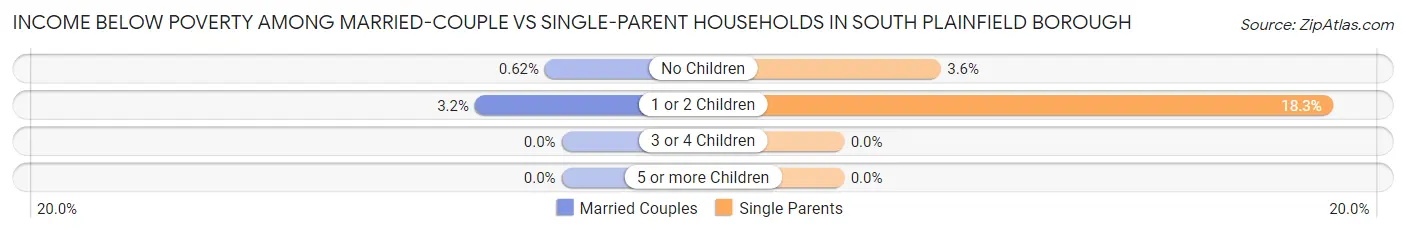
| Children | Married-Couple Families | Single-Parent Households |
| No Children | 19 (0.6%) | 22 (3.6%) |
| 1 or 2 Children | 72 (3.2%) | 69 (18.2%) |
| 3 or 4 Children | 0 (0.0%) | 0 (0.0%) |
| 5 or more Children | 0 (0.0%) | 0 (0.0%) |
| Total | 91 (1.6%) | 91 (8.5%) |
Race in South Plainfield borough
The most populous races in South Plainfield borough are White / Caucasian (13,386 | 55.1%), Hispanic or Latino (4,476 | 18.4%), and Asian (4,123 | 17.0%).
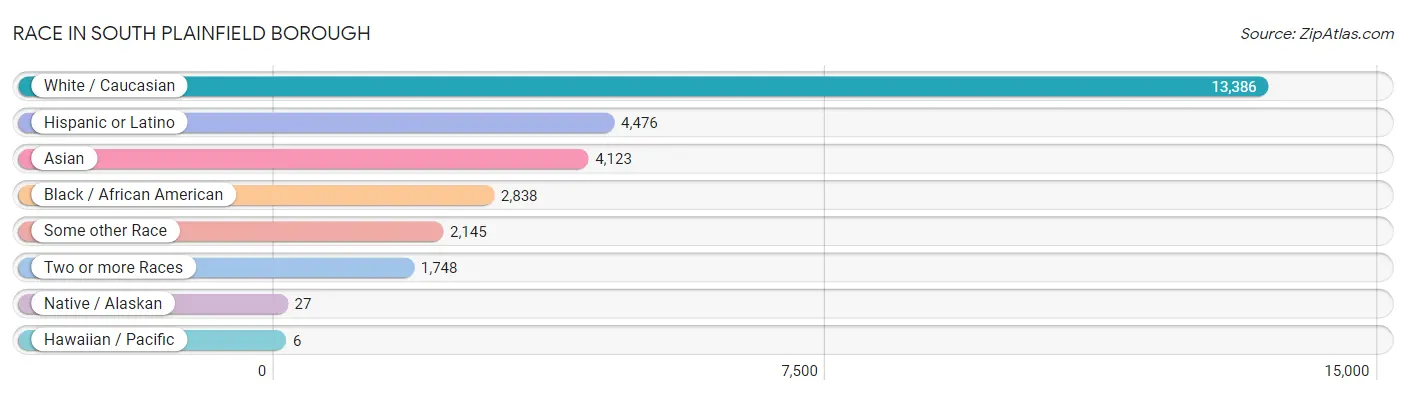
| Race | # Population | % Population |
| Asian | 4,123 | 17.0% |
| Black / African American | 2,838 | 11.7% |
| Hawaiian / Pacific | 6 | 0.0% |
| Hispanic or Latino | 4,476 | 18.4% |
| Native / Alaskan | 27 | 0.1% |
| White / Caucasian | 13,386 | 55.1% |
| Two or more Races | 1,748 | 7.2% |
| Some other Race | 2,145 | 8.8% |
| Total | 24,273 | 100.0% |
Ancestry in South Plainfield borough
The most populous ancestries reported in South Plainfield borough are Italian (4,590 | 18.9%), Irish (2,853 | 11.7%), Thai (2,345 | 9.7%), German (2,295 | 9.5%), and Polish (1,877 | 7.7%), together accounting for 57.5% of all South Plainfield borough residents.
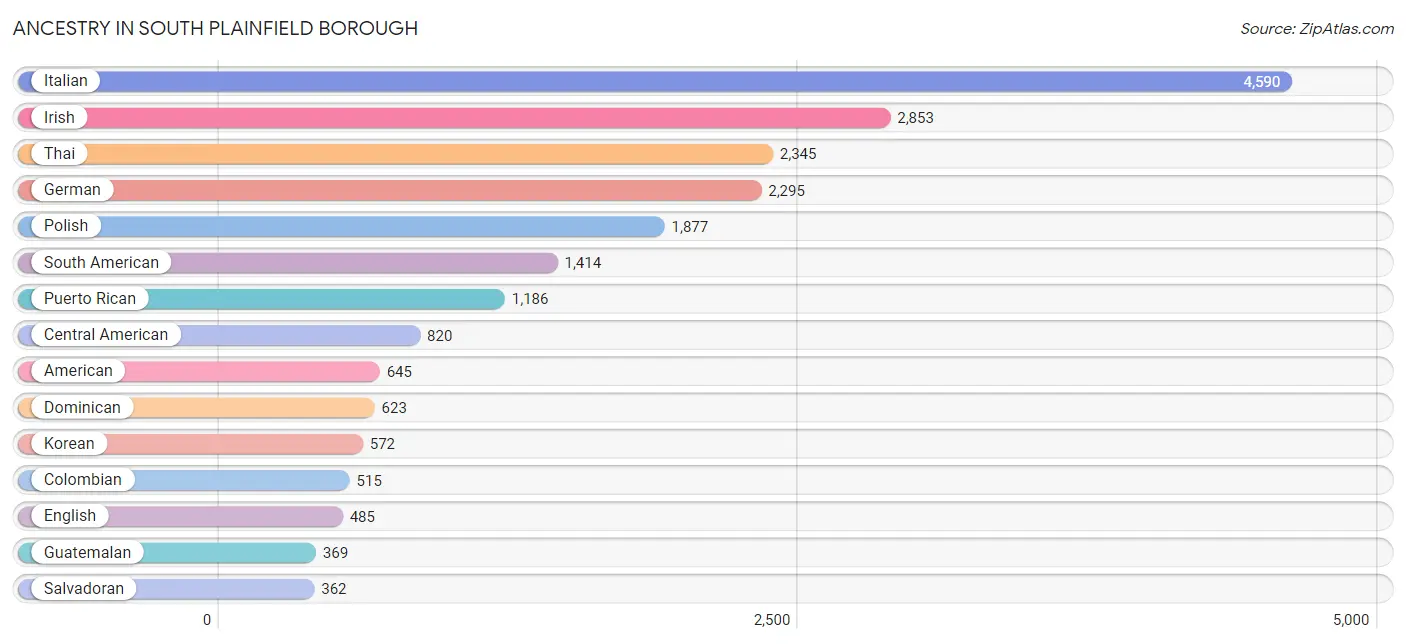
| Ancestry | # Population | % Population |
| Afghan | 77 | 0.3% |
| African | 5 | 0.0% |
| American | 645 | 2.7% |
| Arab | 225 | 0.9% |
| Argentinean | 35 | 0.1% |
| Austrian | 71 | 0.3% |
| Bahamian | 30 | 0.1% |
| Barbadian | 12 | 0.1% |
| Brazilian | 38 | 0.2% |
| British | 75 | 0.3% |
| British West Indian | 22 | 0.1% |
| Bulgarian | 22 | 0.1% |
| Burmese | 99 | 0.4% |
| Canadian | 7 | 0.0% |
| Central American | 820 | 3.4% |
| Central American Indian | 57 | 0.2% |
| Cherokee | 6 | 0.0% |
| Chilean | 46 | 0.2% |
| Colombian | 515 | 2.1% |
| Croatian | 46 | 0.2% |
| Cuban | 111 | 0.5% |
| Czech | 25 | 0.1% |
| Czechoslovakian | 46 | 0.2% |
| Danish | 110 | 0.4% |
| Dominican | 623 | 2.6% |
| Dutch | 170 | 0.7% |
| Eastern European | 140 | 0.6% |
| Ecuadorian | 255 | 1.1% |
| Egyptian | 79 | 0.3% |
| English | 485 | 2.0% |
| Ethiopian | 7 | 0.0% |
| European | 109 | 0.4% |
| Finnish | 4 | 0.0% |
| French | 165 | 0.7% |
| French Canadian | 26 | 0.1% |
| German | 2,295 | 9.5% |
| Greek | 160 | 0.7% |
| Guamanian / Chamorro | 12 | 0.1% |
| Guatemalan | 369 | 1.5% |
| Guyanese | 261 | 1.1% |
| Haitian | 28 | 0.1% |
| Honduran | 78 | 0.3% |
| Hungarian | 239 | 1.0% |
| Indian (Asian) | 263 | 1.1% |
| Irish | 2,853 | 11.7% |
| Israeli | 14 | 0.1% |
| Italian | 4,590 | 18.9% |
| Jamaican | 285 | 1.2% |
| Jordanian | 80 | 0.3% |
| Korean | 572 | 2.4% |
| Laotian | 8 | 0.0% |
| Lebanese | 20 | 0.1% |
| Liberian | 6 | 0.0% |
| Lithuanian | 76 | 0.3% |
| Luxembourger | 5 | 0.0% |
| Mexican | 110 | 0.4% |
| Moroccan | 4 | 0.0% |
| Nigerian | 171 | 0.7% |
| Norwegian | 56 | 0.2% |
| Palestinian | 35 | 0.1% |
| Panamanian | 11 | 0.1% |
| Pennsylvania German | 18 | 0.1% |
| Peruvian | 203 | 0.8% |
| Polish | 1,877 | 7.7% |
| Portuguese | 208 | 0.9% |
| Puerto Rican | 1,186 | 4.9% |
| Romanian | 26 | 0.1% |
| Russian | 341 | 1.4% |
| Salvadoran | 362 | 1.5% |
| Scandinavian | 41 | 0.2% |
| Scotch-Irish | 127 | 0.5% |
| Scottish | 162 | 0.7% |
| Slovak | 242 | 1.0% |
| South African | 18 | 0.1% |
| South American | 1,414 | 5.8% |
| Spaniard | 122 | 0.5% |
| Spanish | 43 | 0.2% |
| Sri Lankan | 236 | 1.0% |
| Subsaharan African | 213 | 0.9% |
| Swedish | 126 | 0.5% |
| Swiss | 78 | 0.3% |
| Syrian | 4 | 0.0% |
| Thai | 2,345 | 9.7% |
| Trinidadian and Tobagonian | 123 | 0.5% |
| Ukrainian | 183 | 0.7% |
| Venezuelan | 360 | 1.5% |
| Welsh | 47 | 0.2% |
| West Indian | 25 | 0.1% | View All 88 Rows |
Immigrants in South Plainfield borough
The most numerous immigrant groups reported in South Plainfield borough came from Asia (3,093 | 12.7%), South Central Asia (2,107 | 8.7%), Latin America (2,065 | 8.5%), India (1,565 | 6.5%), and South America (1,239 | 5.1%), together accounting for 41.5% of all South Plainfield borough residents.
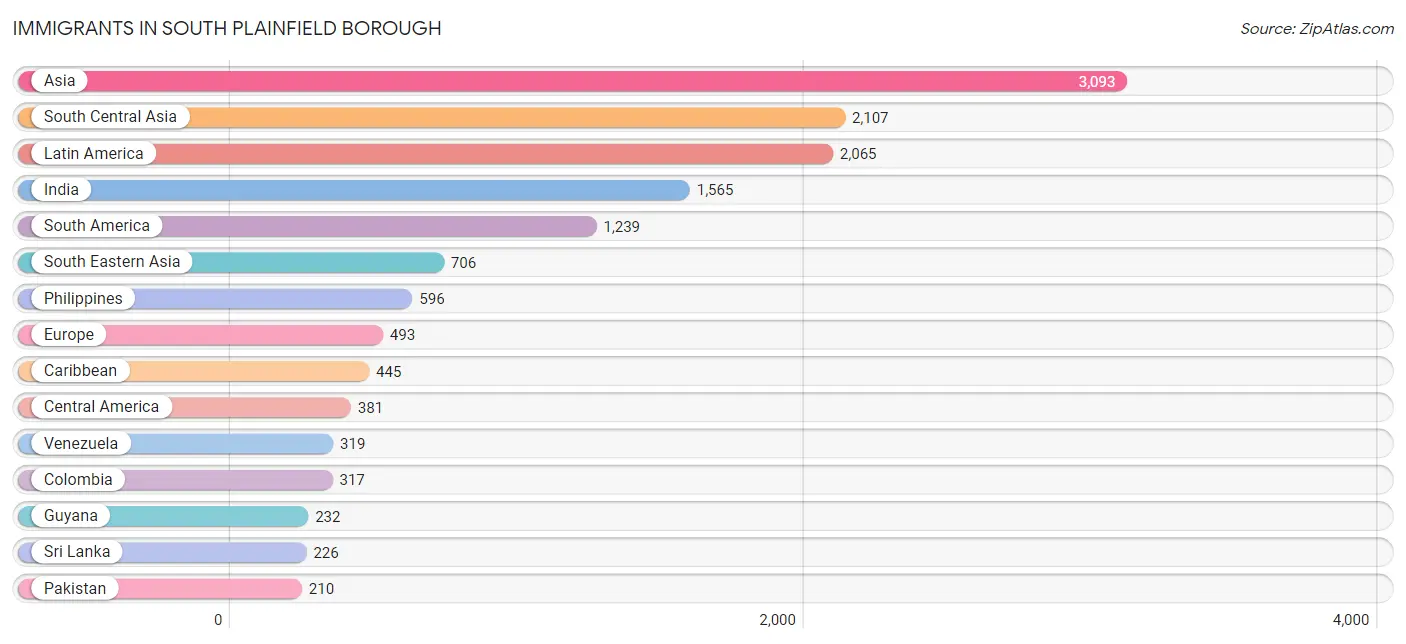
| Immigration Origin | # Population | % Population |
| Afghanistan | 39 | 0.2% |
| Africa | 142 | 0.6% |
| Argentina | 65 | 0.3% |
| Asia | 3,093 | 12.7% |
| Bahamas | 39 | 0.2% |
| Bangladesh | 67 | 0.3% |
| Belarus | 4 | 0.0% |
| Brazil | 4 | 0.0% |
| Bulgaria | 22 | 0.1% |
| Canada | 13 | 0.1% |
| Caribbean | 445 | 1.8% |
| Central America | 381 | 1.6% |
| Chile | 35 | 0.1% |
| China | 129 | 0.5% |
| Colombia | 317 | 1.3% |
| Cuba | 60 | 0.3% |
| Dominican Republic | 208 | 0.9% |
| Eastern Africa | 24 | 0.1% |
| Eastern Asia | 199 | 0.8% |
| Eastern Europe | 169 | 0.7% |
| Ecuador | 141 | 0.6% |
| Egypt | 29 | 0.1% |
| El Salvador | 139 | 0.6% |
| Ethiopia | 7 | 0.0% |
| Europe | 493 | 2.0% |
| Germany | 63 | 0.3% |
| Guatemala | 147 | 0.6% |
| Guyana | 232 | 1.0% |
| Honduras | 48 | 0.2% |
| India | 1,565 | 6.5% |
| Israel | 3 | 0.0% |
| Italy | 140 | 0.6% |
| Jamaica | 98 | 0.4% |
| Jordan | 24 | 0.1% |
| Kenya | 17 | 0.1% |
| Korea | 70 | 0.3% |
| Kuwait | 22 | 0.1% |
| Latin America | 2,065 | 8.5% |
| Latvia | 32 | 0.1% |
| Liberia | 6 | 0.0% |
| Mexico | 36 | 0.2% |
| Morocco | 4 | 0.0% |
| Nigeria | 67 | 0.3% |
| Northern Africa | 33 | 0.1% |
| Northern Europe | 58 | 0.2% |
| Pakistan | 210 | 0.9% |
| Panama | 11 | 0.1% |
| Peru | 126 | 0.5% |
| Philippines | 596 | 2.5% |
| Poland | 77 | 0.3% |
| Portugal | 59 | 0.2% |
| Romania | 26 | 0.1% |
| Russia | 4 | 0.0% |
| Saudi Arabia | 4 | 0.0% |
| South America | 1,239 | 5.1% |
| South Central Asia | 2,107 | 8.7% |
| South Eastern Asia | 706 | 2.9% |
| Southern Europe | 199 | 0.8% |
| Sri Lanka | 226 | 0.9% |
| Switzerland | 4 | 0.0% |
| Taiwan | 42 | 0.2% |
| Trinidad and Tobago | 31 | 0.1% |
| Venezuela | 319 | 1.3% |
| Vietnam | 110 | 0.4% |
| West Indies | 9 | 0.0% |
| Western Africa | 85 | 0.4% |
| Western Asia | 61 | 0.3% |
| Western Europe | 67 | 0.3% | View All 68 Rows |
Sex and Age in South Plainfield borough
Sex and Age in South Plainfield borough
The most populous age groups in South Plainfield borough are 25 to 29 Years (1,057 | 8.9%) for men and 40 to 44 Years (1,116 | 9.0%) for women.
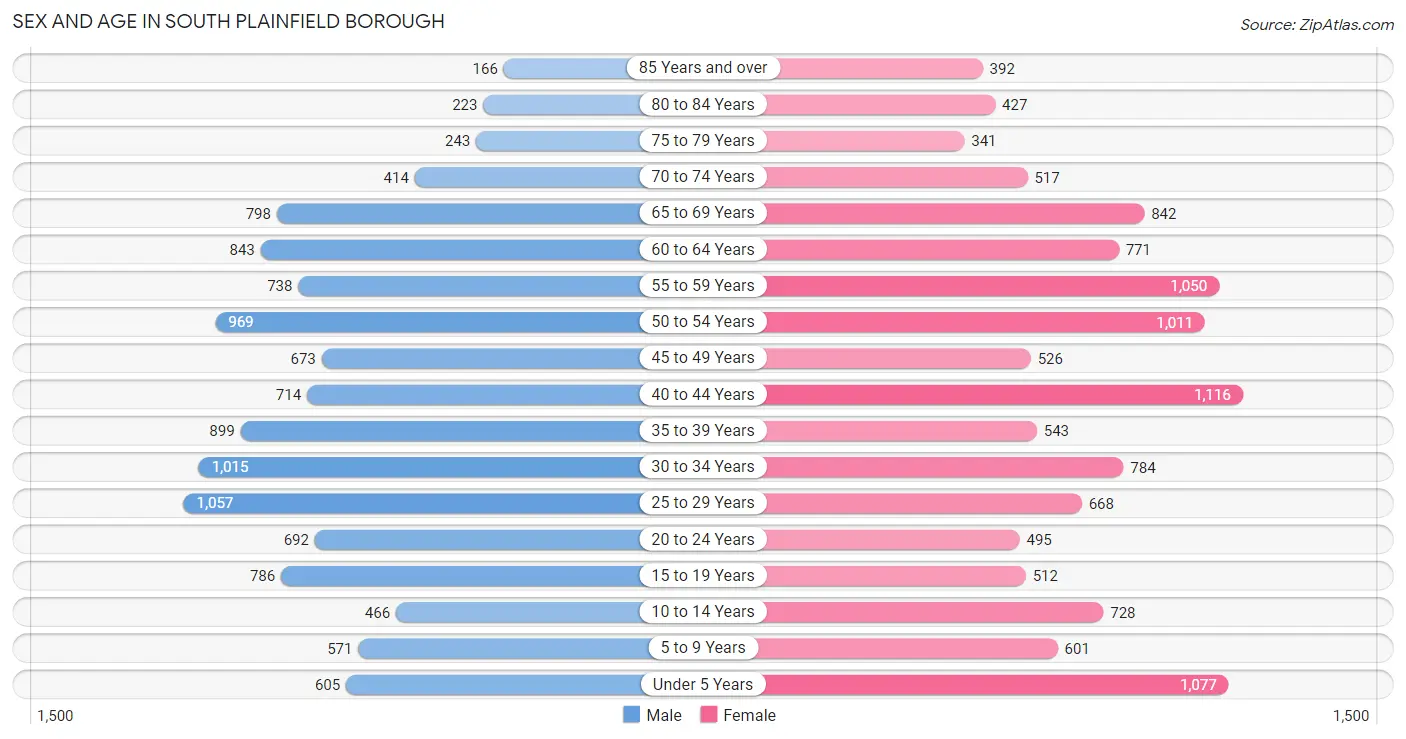
| Age Bracket | Male | Female |
| Under 5 Years | 605 (5.1%) | 1,077 (8.7%) |
| 5 to 9 Years | 571 (4.8%) | 601 (4.9%) |
| 10 to 14 Years | 466 (3.9%) | 728 (5.9%) |
| 15 to 19 Years | 786 (6.6%) | 512 (4.1%) |
| 20 to 24 Years | 692 (5.8%) | 495 (4.0%) |
| 25 to 29 Years | 1,057 (8.9%) | 668 (5.4%) |
| 30 to 34 Years | 1,015 (8.6%) | 784 (6.3%) |
| 35 to 39 Years | 899 (7.6%) | 543 (4.4%) |
| 40 to 44 Years | 714 (6.0%) | 1,116 (9.0%) |
| 45 to 49 Years | 673 (5.7%) | 526 (4.2%) |
| 50 to 54 Years | 969 (8.2%) | 1,011 (8.2%) |
| 55 to 59 Years | 738 (6.2%) | 1,050 (8.5%) |
| 60 to 64 Years | 843 (7.1%) | 771 (6.2%) |
| 65 to 69 Years | 798 (6.7%) | 842 (6.8%) |
| 70 to 74 Years | 414 (3.5%) | 517 (4.2%) |
| 75 to 79 Years | 243 (2.1%) | 341 (2.8%) |
| 80 to 84 Years | 223 (1.9%) | 427 (3.4%) |
| 85 Years and over | 166 (1.4%) | 392 (3.2%) |
| Total | 11,872 (100.0%) | 12,401 (100.0%) |
Families and Households in South Plainfield borough
Median Family Size in South Plainfield borough
The median family size in South Plainfield borough is 3.31 persons per family, with married-couple families (5,538 | 83.9%) accounting for the largest median family size of 3.39 persons per family. On the other hand, single male/father families (297 | 4.5%) represent the smallest median family size with 2.58 persons per family.
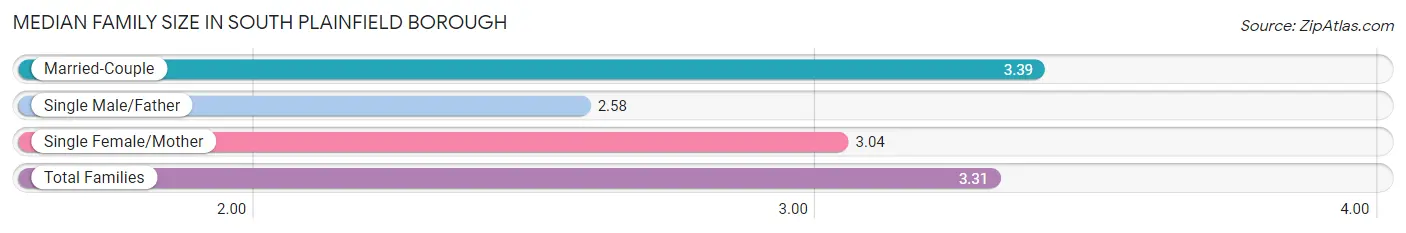
| Family Type | # Families | Family Size |
| Married-Couple | 5,538 (83.9%) | 3.39 |
| Single Male/Father | 297 (4.5%) | 2.58 |
| Single Female/Mother | 768 (11.6%) | 3.04 |
| Total Families | 6,603 (100.0%) | 3.31 |
Median Household Size in South Plainfield borough
The median household size in South Plainfield borough is 2.94 persons per household, with married-couple households (5,538 | 67.9%) accounting for the largest median household size of 3.41 persons per household. non-family households (1,547 | 19.0%) represent the smallest median household size with 1.16 persons per household.
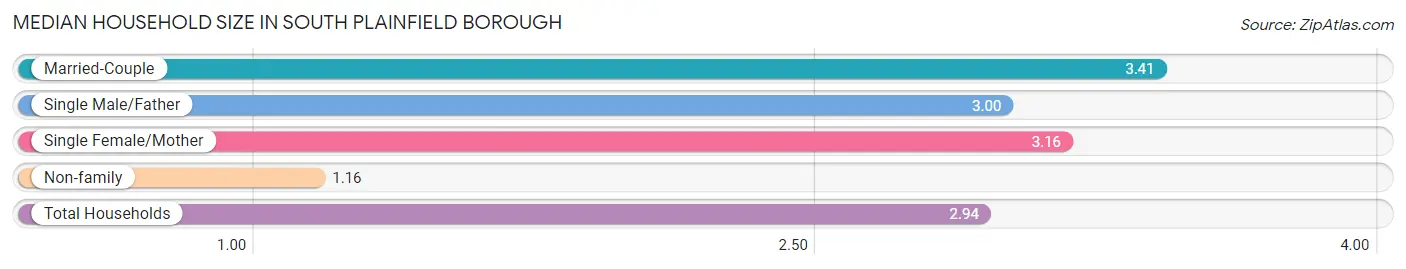
| Household Type | # Households | Household Size |
| Married-Couple | 5,538 (67.9%) | 3.41 |
| Single Male/Father | 297 (3.6%) | 3.00 |
| Single Female/Mother | 768 (9.4%) | 3.16 |
| Non-family | 1,547 (19.0%) | 1.16 |
| Total Households | 8,150 (100.0%) | 2.94 |
Household Size by Marriage Status in South Plainfield borough
Out of a total of 8,150 households in South Plainfield borough, 6,603 (81.0%) are family households, while 1,547 (19.0%) are nonfamily households. The most numerous type of family households are 2-person households, comprising 2,457, and the most common type of nonfamily households are 1-person households, comprising 1,321.
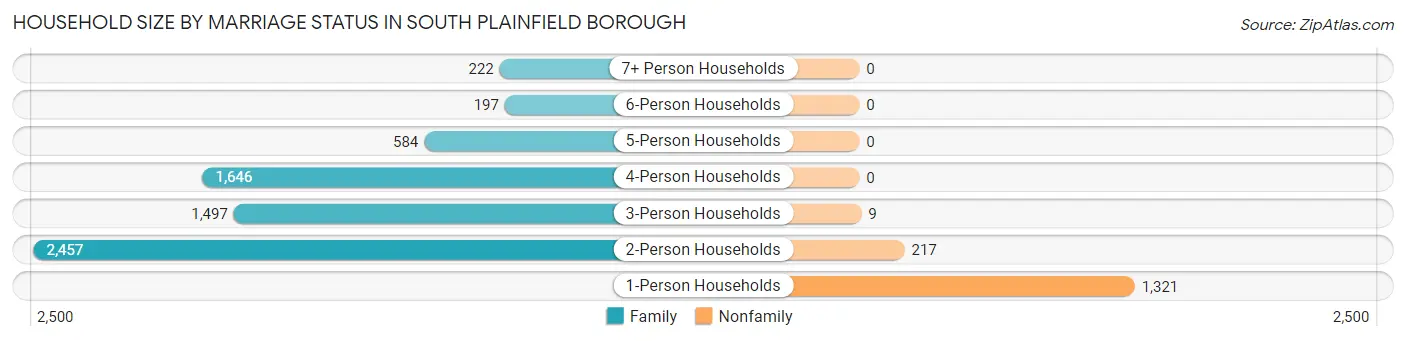
| Household Size | Family Households | Nonfamily Households |
| 1-Person Households | - | 1,321 (16.2%) |
| 2-Person Households | 2,457 (30.1%) | 217 (2.7%) |
| 3-Person Households | 1,497 (18.4%) | 9 (0.1%) |
| 4-Person Households | 1,646 (20.2%) | 0 (0.0%) |
| 5-Person Households | 584 (7.2%) | 0 (0.0%) |
| 6-Person Households | 197 (2.4%) | 0 (0.0%) |
| 7+ Person Households | 222 (2.7%) | 0 (0.0%) |
| Total | 6,603 (81.0%) | 1,547 (19.0%) |
Female Fertility in South Plainfield borough
Fertility by Age in South Plainfield borough
Average fertility rate in South Plainfield borough is 60.0 births per 1,000 women. Women in the age bracket of 20 to 34 years have the highest fertility rate with 113.0 births per 1,000 women. Women in the age bracket of 20 to 34 years acount for 77.2% of all women with births.
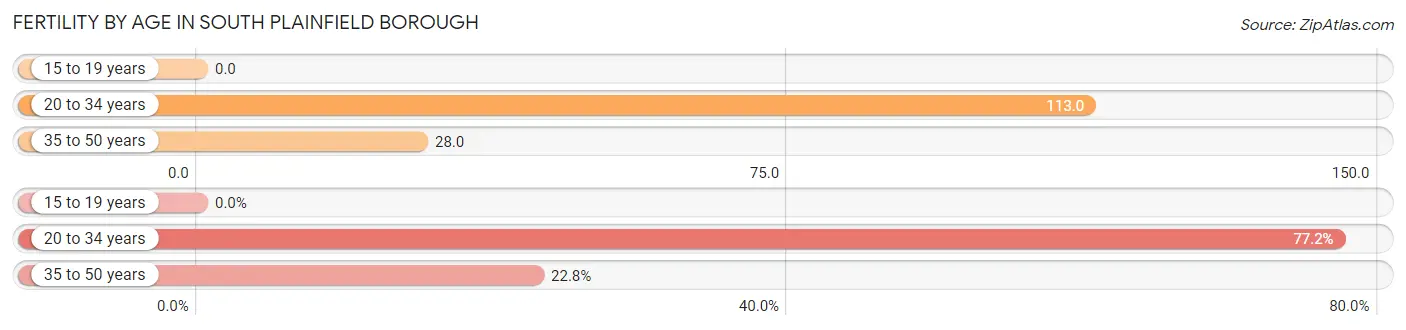
| Age Bracket | Women with Births | Births / 1,000 Women |
| 15 to 19 years | 0 (0.0%) | 0.0 |
| 20 to 34 years | 220 (77.2%) | 113.0 |
| 35 to 50 years | 65 (22.8%) | 28.0 |
| Total | 285 (100.0%) | 60.0 |
Fertility by Age by Marriage Status in South Plainfield borough
92.6% of women with births (285) in South Plainfield borough are married. The highest percentage of unmarried women with births falls into 20 to 34 years age bracket with 9.6% of them unmarried at the time of birth, while the lowest percentage of unmarried women with births belong to 35 to 50 years age bracket with 0.0% of them unmarried.
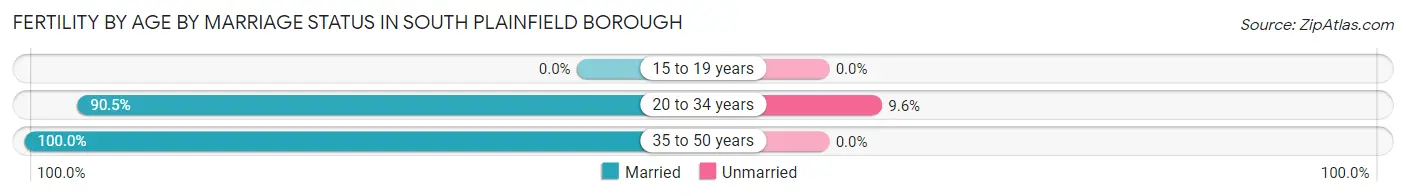
| Age Bracket | Married | Unmarried |
| 15 to 19 years | 0 (0.0%) | 0 (0.0%) |
| 20 to 34 years | 199 (90.4%) | 21 (9.6%) |
| 35 to 50 years | 65 (100.0%) | 0 (0.0%) |
| Total | 264 (92.6%) | 21 (7.4%) |
Fertility by Education in South Plainfield borough
Average fertility rate in South Plainfield borough is 60.0 births per 1,000 women. Women with the education attainment of graduate degree have the highest fertility rate of 101.0 births per 1,000 women, while women with the education attainment of less than high school have the lowest fertility at 8.0 births per 1,000 women. Women with the education attainment of graduate degree represent 42.5% of all women with births.
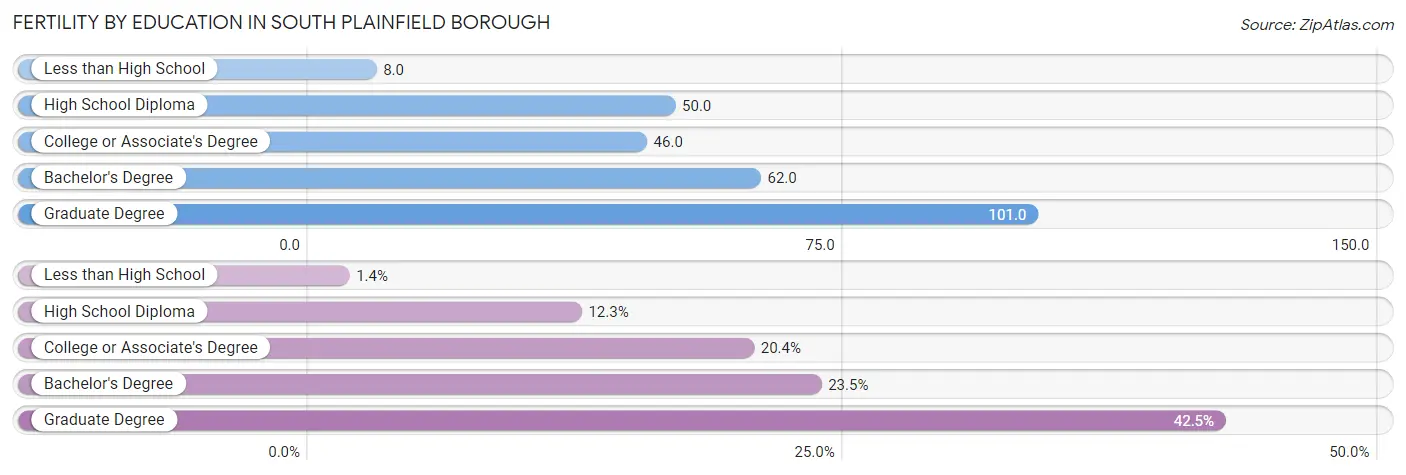
| Educational Attainment | Women with Births | Births / 1,000 Women |
| Less than High School | 4 (1.4%) | 8.0 |
| High School Diploma | 35 (12.3%) | 50.0 |
| College or Associate's Degree | 58 (20.3%) | 46.0 |
| Bachelor's Degree | 67 (23.5%) | 62.0 |
| Graduate Degree | 121 (42.5%) | 101.0 |
| Total | 285 (100.0%) | 60.0 |
Fertility by Education by Marriage Status in South Plainfield borough
7.4% of women with births in South Plainfield borough are unmarried. Women with the educational attainment of less than high school are most likely to be married with 100.0% of them married at childbirth, while women with the educational attainment of college or associate's degree are least likely to be married with 36.2% of them unmarried at childbirth.
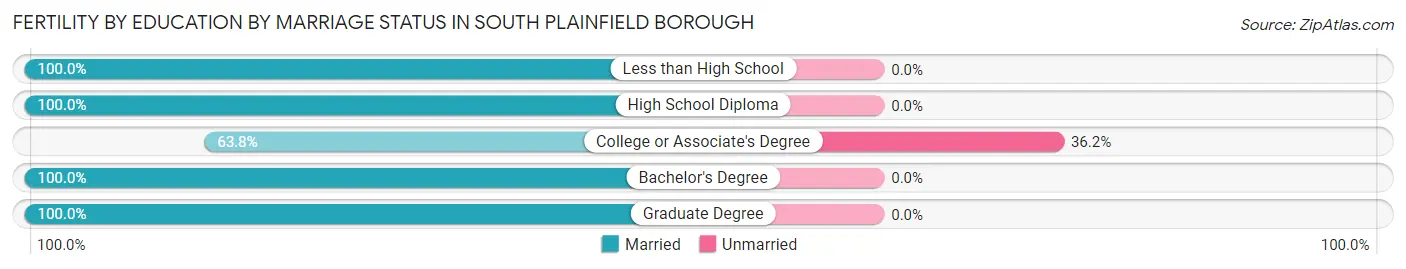
| Educational Attainment | Married | Unmarried |
| Less than High School | 4 (100.0%) | 0 (0.0%) |
| High School Diploma | 35 (100.0%) | 0 (0.0%) |
| College or Associate's Degree | 37 (63.8%) | 21 (36.2%) |
| Bachelor's Degree | 67 (100.0%) | 0 (0.0%) |
| Graduate Degree | 121 (100.0%) | 0 (0.0%) |
| Total | 264 (92.6%) | 21 (7.4%) |
Employment Characteristics in South Plainfield borough
Employment by Class of Employer in South Plainfield borough
Among the 12,631 employed individuals in South Plainfield borough, private company employees (8,548 | 67.7%), local government employees (1,216 | 9.6%), and not-for-profit organizations (1,020 | 8.1%) make up the most common classes of employment.
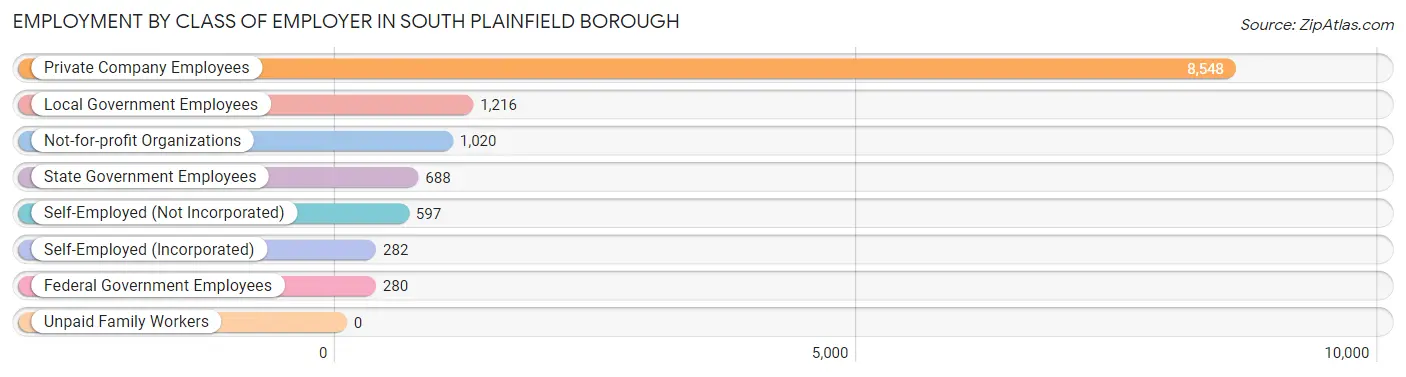
| Employer Class | # Employees | % Employees |
| Private Company Employees | 8,548 | 67.7% |
| Self-Employed (Incorporated) | 282 | 2.2% |
| Self-Employed (Not Incorporated) | 597 | 4.7% |
| Not-for-profit Organizations | 1,020 | 8.1% |
| Local Government Employees | 1,216 | 9.6% |
| State Government Employees | 688 | 5.4% |
| Federal Government Employees | 280 | 2.2% |
| Unpaid Family Workers | 0 | 0.0% |
| Total | 12,631 | 100.0% |
Employment Status by Age in South Plainfield borough
According to the labor force statistics for South Plainfield borough, out of the total population over 16 years of age (19,931), 69.6% or 13,872 individuals are in the labor force, with 7.2% or 999 of them unemployed. The age group with the highest labor force participation rate is 30 to 34 years, with 93.1% or 1,675 individuals in the labor force. Within the labor force, the 75 years and over age range has the highest percentage of unemployed individuals, with 33.6% or 103 of them being unemployed.
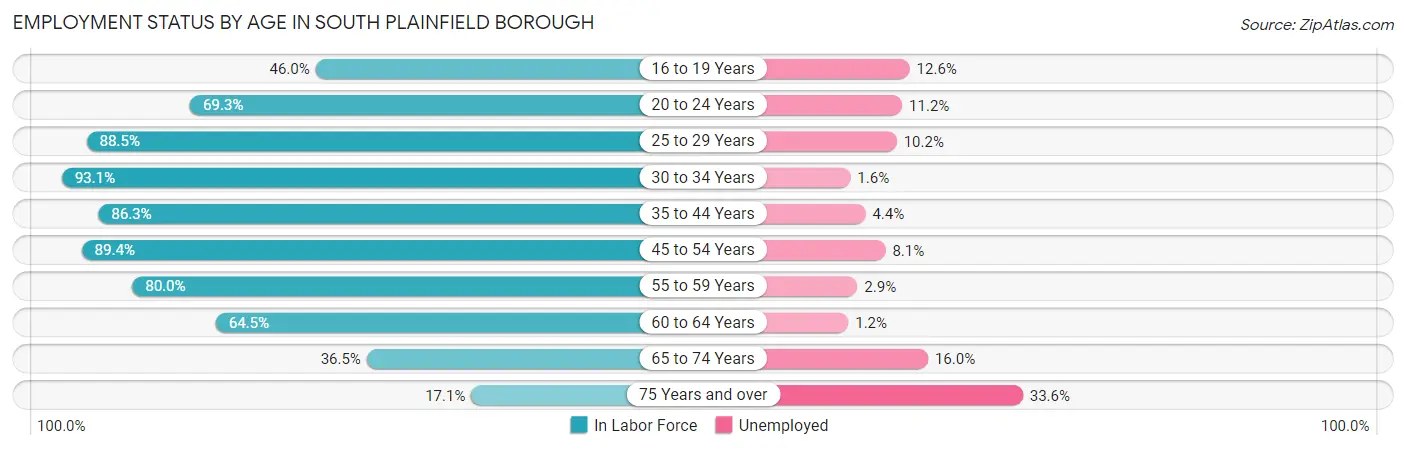
| Age Bracket | In Labor Force | Unemployed |
| 16 to 19 Years | 462 (46.0%) | 58 (12.6%) |
| 20 to 24 Years | 823 (69.3%) | 92 (11.2%) |
| 25 to 29 Years | 1,527 (88.5%) | 156 (10.2%) |
| 30 to 34 Years | 1,675 (93.1%) | 27 (1.6%) |
| 35 to 44 Years | 2,824 (86.3%) | 124 (4.4%) |
| 45 to 54 Years | 2,842 (89.4%) | 230 (8.1%) |
| 55 to 59 Years | 1,430 (80.0%) | 41 (2.9%) |
| 60 to 64 Years | 1,041 (64.5%) | 12 (1.2%) |
| 65 to 74 Years | 938 (36.5%) | 150 (16.0%) |
| 75 Years and over | 306 (17.1%) | 103 (33.6%) |
| Total | 13,872 (69.6%) | 999 (7.2%) |
Employment Status by Educational Attainment in South Plainfield borough
According to labor force statistics for South Plainfield borough, 84.7% of individuals (11,330) out of the total population between 25 and 64 years of age (13,377) are in the labor force, with 5.2% or 589 of them being unemployed. The group with the highest labor force participation rate are those with the educational attainment of bachelor's degree or higher, with 91.0% or 5,583 individuals in the labor force. Within the labor force, individuals with less than high school education have the highest percentage of unemployment, with 16.9% or 85 of them being unemployed.
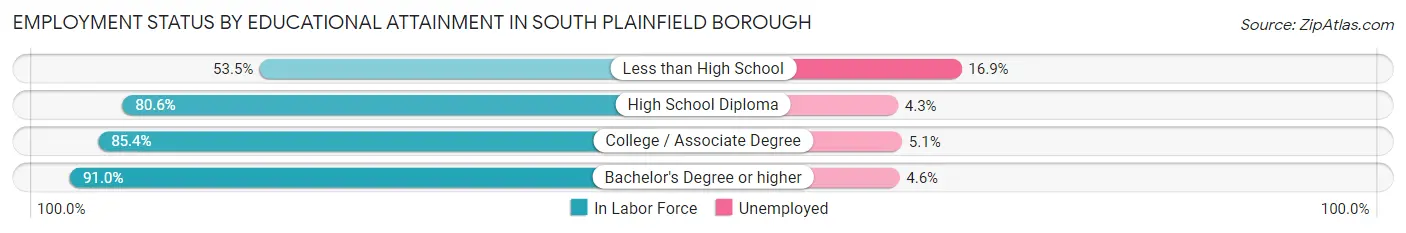
| Educational Attainment | In Labor Force | Unemployed |
| Less than High School | 502 (53.5%) | 159 (16.9%) |
| High School Diploma | 2,233 (80.6%) | 119 (4.3%) |
| College / Associate Degree | 3,017 (85.4%) | 180 (5.1%) |
| Bachelor's Degree or higher | 5,583 (91.0%) | 282 (4.6%) |
| Total | 11,330 (84.7%) | 696 (5.2%) |
Employment Occupations by Sex in South Plainfield borough
Management, Business, Science and Arts Occupations
The most common Management, Business, Science and Arts occupations in South Plainfield borough are Management (1,530 | 11.9%), Community & Social Service (1,453 | 11.3%), Computers, Engineering & Science (1,150 | 8.9%), Health Diagnosing & Treating (1,004 | 7.8%), and Business & Financial (957 | 7.4%).
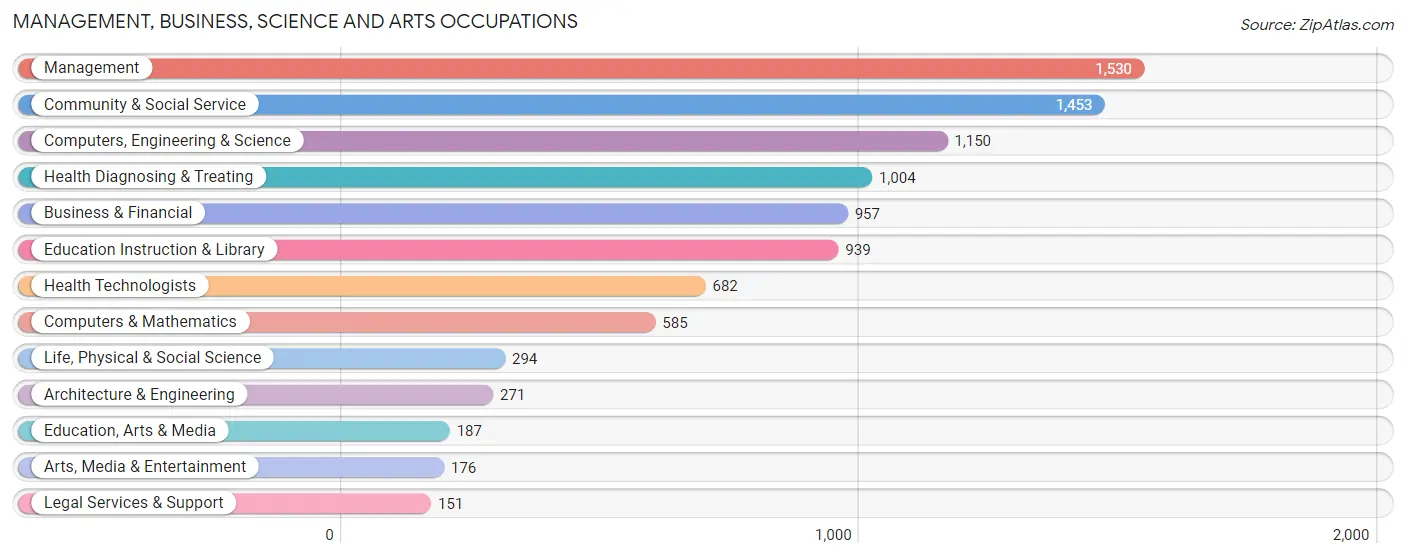
Management, Business, Science and Arts Occupations by Sex
Within the Management, Business, Science and Arts occupations in South Plainfield borough, the most male-oriented occupations are Architecture & Engineering (81.2%), Computers & Mathematics (75.9%), and Computers, Engineering & Science (71.5%), while the most female-oriented occupations are Health Technologists (83.6%), Education Instruction & Library (80.7%), and Health Diagnosing & Treating (76.3%).
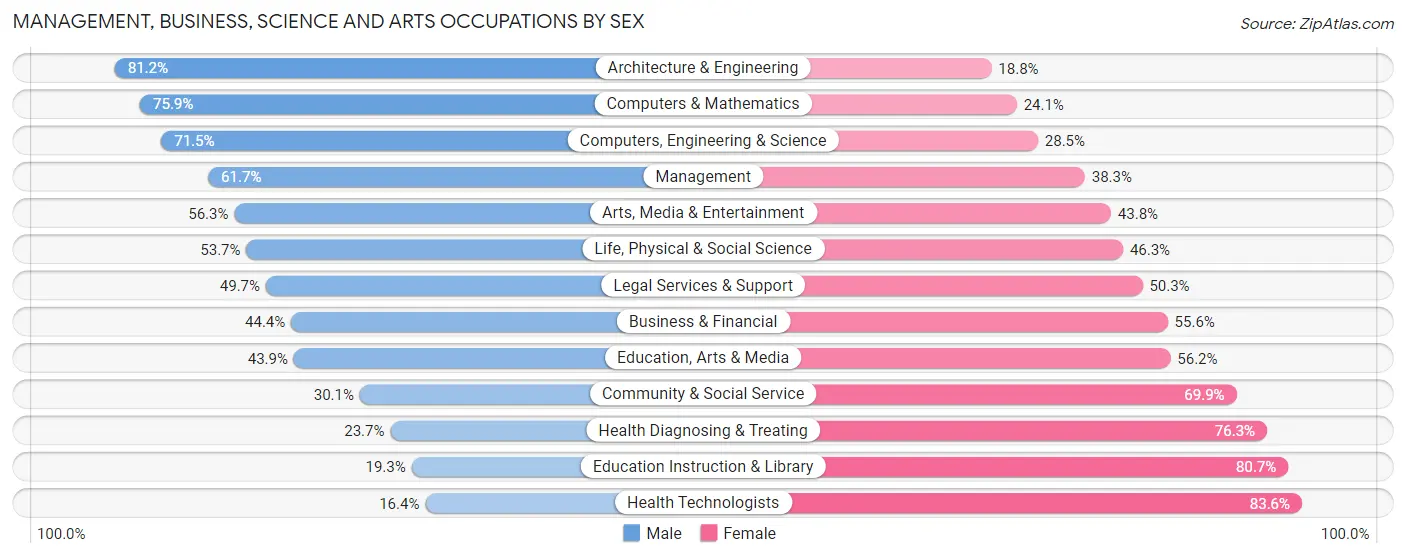
| Occupation | Male | Female |
| Management | 944 (61.7%) | 586 (38.3%) |
| Business & Financial | 425 (44.4%) | 532 (55.6%) |
| Computers, Engineering & Science | 822 (71.5%) | 328 (28.5%) |
| Computers & Mathematics | 444 (75.9%) | 141 (24.1%) |
| Architecture & Engineering | 220 (81.2%) | 51 (18.8%) |
| Life, Physical & Social Science | 158 (53.7%) | 136 (46.3%) |
| Community & Social Service | 437 (30.1%) | 1,016 (69.9%) |
| Education, Arts & Media | 82 (43.9%) | 105 (56.1%) |
| Legal Services & Support | 75 (49.7%) | 76 (50.3%) |
| Education Instruction & Library | 181 (19.3%) | 758 (80.7%) |
| Arts, Media & Entertainment | 99 (56.2%) | 77 (43.8%) |
| Health Diagnosing & Treating | 238 (23.7%) | 766 (76.3%) |
| Health Technologists | 112 (16.4%) | 570 (83.6%) |
| Total (Category) | 2,866 (47.0%) | 3,228 (53.0%) |
| Total (Overall) | 7,276 (56.5%) | 5,597 (43.5%) |
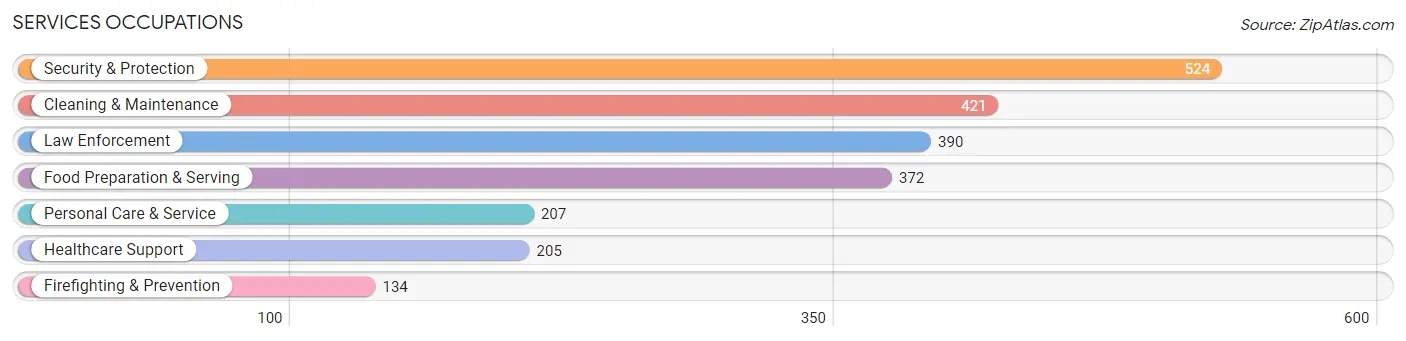
Services Occupations
The most common Services occupations in South Plainfield borough are Security & Protection (524 | 4.1%), Cleaning & Maintenance (421 | 3.3%), Law Enforcement (390 | 3.0%), Food Preparation & Serving (372 | 2.9%), and Personal Care & Service (207 | 1.6%).
Services Occupations by Sex
Within the Services occupations in South Plainfield borough, the most male-oriented occupations are Law Enforcement (100.0%), Security & Protection (92.4%), and Firefighting & Prevention (70.2%), while the most female-oriented occupations are Healthcare Support (88.3%), Personal Care & Service (63.3%), and Food Preparation & Serving (59.1%).
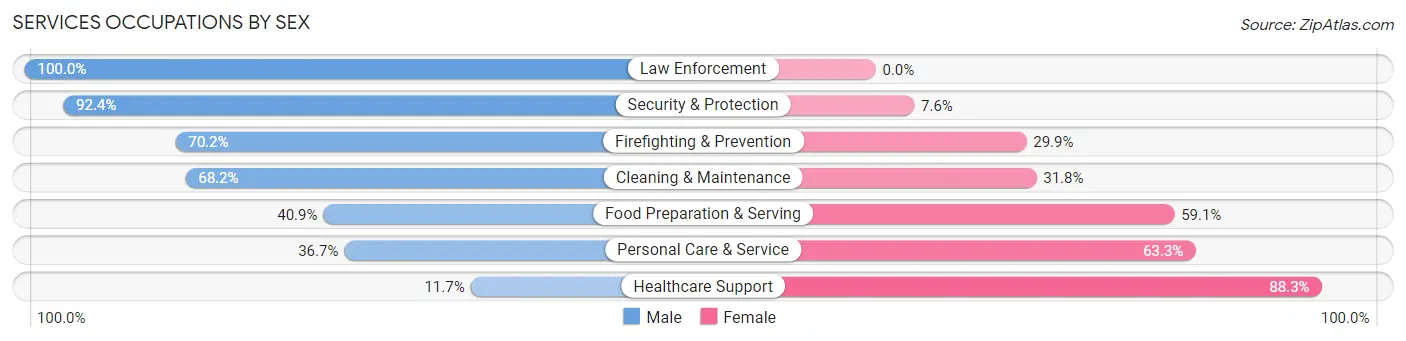
| Occupation | Male | Female |
| Healthcare Support | 24 (11.7%) | 181 (88.3%) |
| Security & Protection | 484 (92.4%) | 40 (7.6%) |
| Firefighting & Prevention | 94 (70.2%) | 40 (29.8%) |
| Law Enforcement | 390 (100.0%) | 0 (0.0%) |
| Food Preparation & Serving | 152 (40.9%) | 220 (59.1%) |
| Cleaning & Maintenance | 287 (68.2%) | 134 (31.8%) |
| Personal Care & Service | 76 (36.7%) | 131 (63.3%) |
| Total (Category) | 1,023 (59.2%) | 706 (40.8%) |
| Total (Overall) | 7,276 (56.5%) | 5,597 (43.5%) |
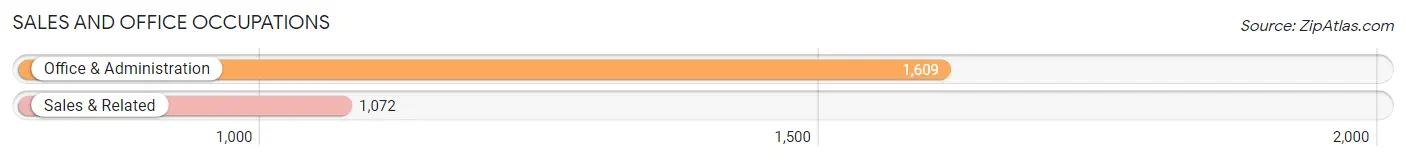
Sales and Office Occupations
The most common Sales and Office occupations in South Plainfield borough are Office & Administration (1,609 | 12.5%), and Sales & Related (1,072 | 8.3%).
Sales and Office Occupations by Sex
| Occupation | Male | Female |
| Sales & Related | 679 (63.3%) | 393 (36.7%) |
| Office & Administration | 530 (32.9%) | 1,079 (67.1%) |
| Total (Category) | 1,209 (45.1%) | 1,472 (54.9%) |
| Total (Overall) | 7,276 (56.5%) | 5,597 (43.5%) |
Natural Resources, Construction and Maintenance Occupations
The most common Natural Resources, Construction and Maintenance occupations in South Plainfield borough are Installation, Maintenance & Repair (428 | 3.3%), and Construction & Extraction (417 | 3.2%).
Natural Resources, Construction and Maintenance Occupations by Sex
| Occupation | Male | Female |
| Farming, Fishing & Forestry | 0 (0.0%) | 0 (0.0%) |
| Construction & Extraction | 414 (99.3%) | 3 (0.7%) |
| Installation, Maintenance & Repair | 428 (100.0%) | 0 (0.0%) |
| Total (Category) | 842 (99.6%) | 3 (0.4%) |
| Total (Overall) | 7,276 (56.5%) | 5,597 (43.5%) |
Production, Transportation and Moving Occupations
The most common Production, Transportation and Moving occupations in South Plainfield borough are Production (604 | 4.7%), Transportation (486 | 3.8%), and Material Moving (434 | 3.4%).
Production, Transportation and Moving Occupations by Sex
| Occupation | Male | Female |
| Production | 505 (83.6%) | 99 (16.4%) |
| Transportation | 483 (99.4%) | 3 (0.6%) |
| Material Moving | 348 (80.2%) | 86 (19.8%) |
| Total (Category) | 1,336 (87.7%) | 188 (12.3%) |
| Total (Overall) | 7,276 (56.5%) | 5,597 (43.5%) |
Employment Industries by Sex in South Plainfield borough
Employment Industries in South Plainfield borough
The major employment industries in South Plainfield borough include Health Care & Social Assistance (1,591 | 12.4%), Educational Services (1,419 | 11.0%), Manufacturing (1,325 | 10.3%), Retail Trade (1,272 | 9.9%), and Professional & Scientific (1,199 | 9.3%).
Employment Industries by Sex in South Plainfield borough
The South Plainfield borough industries that see more men than women are Utilities (97.1%), Enterprise Management (86.7%), and Public Administration (84.6%), whereas the industries that tend to have a higher number of women are Health Care & Social Assistance (74.3%), Educational Services (73.0%), and Accommodation & Food Services (50.4%).
| Industry | Male | Female |
| Agriculture, Fishing & Hunting | 0 (0.0%) | 0 (0.0%) |
| Mining, Quarrying, & Extraction | 0 (0.0%) | 0 (0.0%) |
| Construction | 518 (69.8%) | 224 (30.2%) |
| Manufacturing | 913 (68.9%) | 412 (31.1%) |
| Wholesale Trade | 212 (57.5%) | 157 (42.5%) |
| Retail Trade | 823 (64.7%) | 449 (35.3%) |
| Transportation & Warehousing | 689 (76.2%) | 215 (23.8%) |
| Utilities | 102 (97.1%) | 3 (2.9%) |
| Information | 150 (55.3%) | 121 (44.7%) |
| Finance & Insurance | 388 (50.2%) | 385 (49.8%) |
| Real Estate, Rental & Leasing | 146 (55.9%) | 115 (44.1%) |
| Professional & Scientific | 704 (58.7%) | 495 (41.3%) |
| Enterprise Management | 13 (86.7%) | 2 (13.3%) |
| Administrative & Support | 402 (61.5%) | 252 (38.5%) |
| Educational Services | 383 (27.0%) | 1,036 (73.0%) |
| Health Care & Social Assistance | 409 (25.7%) | 1,182 (74.3%) |
| Arts, Entertainment & Recreation | 141 (83.9%) | 27 (16.1%) |
| Accommodation & Food Services | 232 (49.6%) | 236 (50.4%) |
| Public Administration | 769 (84.6%) | 140 (15.4%) |
| Total | 7,276 (56.5%) | 5,597 (43.5%) |
Education in South Plainfield borough
School Enrollment in South Plainfield borough
The most common levels of schooling among the 5,514 students in South Plainfield borough are high school (1,310 | 23.8%), college / undergraduate (1,163 | 21.1%), and elementary school (936 | 17.0%).
| School Level | # Students | % Students |
| Nursery / Preschool | 535 | 9.7% |
| Kindergarten | 254 | 4.6% |
| Elementary School | 936 | 17.0% |
| Middle School | 724 | 13.1% |
| High School | 1,310 | 23.8% |
| College / Undergraduate | 1,163 | 21.1% |
| Graduate / Professional | 592 | 10.7% |
| Total | 5,514 | 100.0% |
School Enrollment by Age by Funding Source in South Plainfield borough
Out of a total of 5,514 students who are enrolled in schools in South Plainfield borough, 1,219 (22.1%) attend a private institution, while the remaining 4,295 (77.9%) are enrolled in public schools. The age group of 3 to 4 year olds has the highest likelihood of being enrolled in private schools, with 316 (71.7% in the age bracket) enrolled. Conversely, the age group of 15 to 17 year olds has the lowest likelihood of being enrolled in a private school, with 804 (97.7% in the age bracket) attending a public institution.
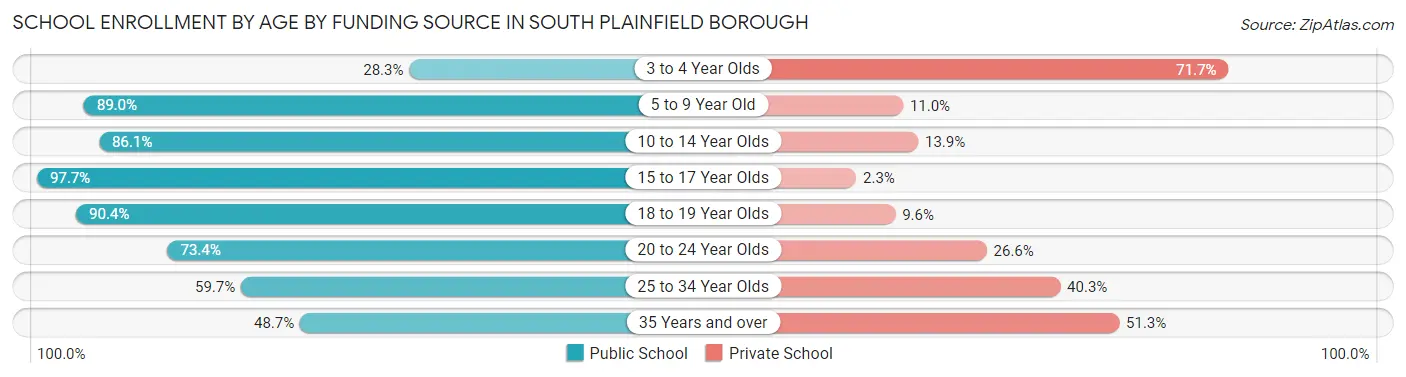
| Age Bracket | Public School | Private School |
| 3 to 4 Year Olds | 125 (28.3%) | 316 (71.7%) |
| 5 to 9 Year Old | 1,039 (89.0%) | 129 (11.0%) |
| 10 to 14 Year Olds | 994 (86.1%) | 160 (13.9%) |
| 15 to 17 Year Olds | 804 (97.7%) | 19 (2.3%) |
| 18 to 19 Year Olds | 386 (90.4%) | 41 (9.6%) |
| 20 to 24 Year Olds | 477 (73.4%) | 173 (26.6%) |
| 25 to 34 Year Olds | 302 (59.7%) | 204 (40.3%) |
| 35 Years and over | 168 (48.7%) | 177 (51.3%) |
| Total | 4,295 (77.9%) | 1,219 (22.1%) |
Educational Attainment by Field of Study in South Plainfield borough
Business (1,568 | 19.3%), science & technology (926 | 11.4%), education (774 | 9.5%), social sciences (738 | 9.1%), and engineering (641 | 7.9%) are the most common fields of study among 8,144 individuals in South Plainfield borough who have obtained a bachelor's degree or higher.
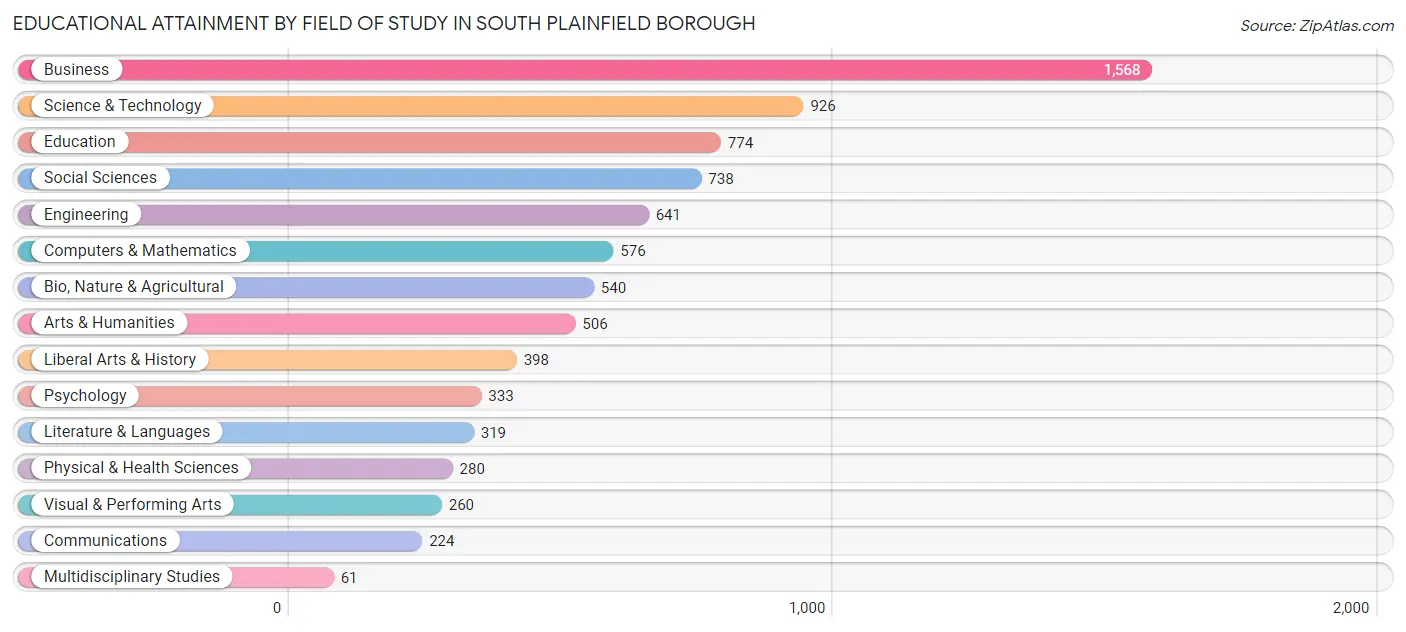
| Field of Study | # Graduates | % Graduates |
| Computers & Mathematics | 576 | 7.1% |
| Bio, Nature & Agricultural | 540 | 6.6% |
| Physical & Health Sciences | 280 | 3.4% |
| Psychology | 333 | 4.1% |
| Social Sciences | 738 | 9.1% |
| Engineering | 641 | 7.9% |
| Multidisciplinary Studies | 61 | 0.7% |
| Science & Technology | 926 | 11.4% |
| Business | 1,568 | 19.3% |
| Education | 774 | 9.5% |
| Literature & Languages | 319 | 3.9% |
| Liberal Arts & History | 398 | 4.9% |
| Visual & Performing Arts | 260 | 3.2% |
| Communications | 224 | 2.8% |
| Arts & Humanities | 506 | 6.2% |
| Total | 8,144 | 100.0% |
Transportation & Commute in South Plainfield borough
Vehicle Availability by Sex in South Plainfield borough
The most prevalent vehicle ownership categories in South Plainfield borough are males with 2 vehicles (3,018, accounting for 41.9%) and females with 2 vehicles (2,179, making up 55.6%).
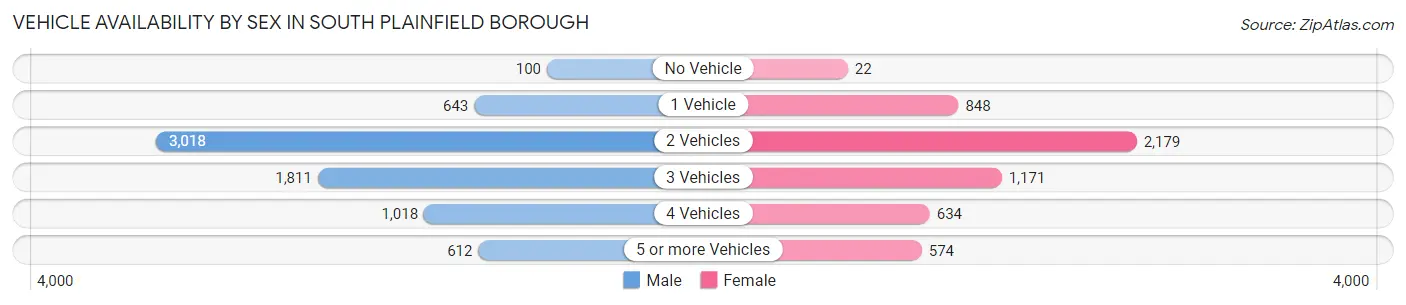
| Vehicles Available | Male | Female |
| No Vehicle | 100 (1.4%) | 22 (0.4%) |
| 1 Vehicle | 643 (8.9%) | 848 (15.6%) |
| 2 Vehicles | 3,018 (41.9%) | 2,179 (40.1%) |
| 3 Vehicles | 1,811 (25.2%) | 1,171 (21.6%) |
| 4 Vehicles | 1,018 (14.1%) | 634 (11.7%) |
| 5 or more Vehicles | 612 (8.5%) | 574 (10.6%) |
| Total | 7,202 (100.0%) | 5,428 (100.0%) |
Commute Time in South Plainfield borough
The most frequently occuring commute durations in South Plainfield borough are 30 to 34 minutes (1,554 commuters, 14.0%), 20 to 24 minutes (1,468 commuters, 13.2%), and 10 to 14 minutes (1,350 commuters, 12.1%).
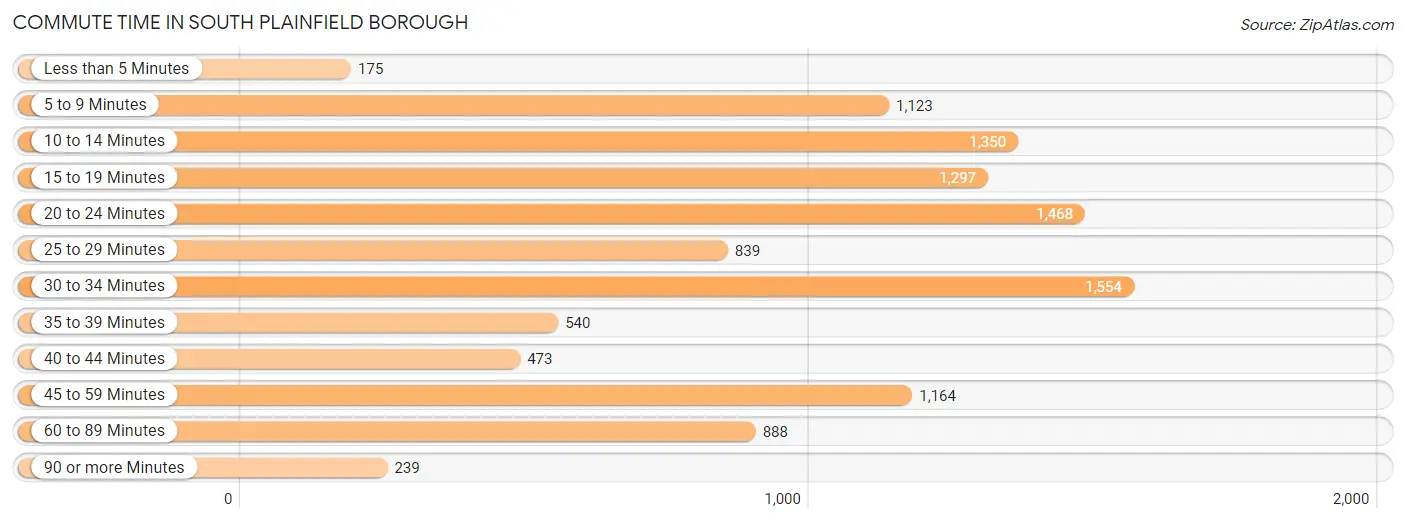
| Commute Time | # Commuters | % Commuters |
| Less than 5 Minutes | 175 | 1.6% |
| 5 to 9 Minutes | 1,123 | 10.1% |
| 10 to 14 Minutes | 1,350 | 12.1% |
| 15 to 19 Minutes | 1,297 | 11.7% |
| 20 to 24 Minutes | 1,468 | 13.2% |
| 25 to 29 Minutes | 839 | 7.5% |
| 30 to 34 Minutes | 1,554 | 14.0% |
| 35 to 39 Minutes | 540 | 4.9% |
| 40 to 44 Minutes | 473 | 4.3% |
| 45 to 59 Minutes | 1,164 | 10.5% |
| 60 to 89 Minutes | 888 | 8.0% |
| 90 or more Minutes | 239 | 2.1% |
Commute Time by Sex in South Plainfield borough
The most common commute times in South Plainfield borough are 30 to 34 minutes (947 commuters, 14.7%) for males and 20 to 24 minutes (655 commuters, 14.0%) for females.
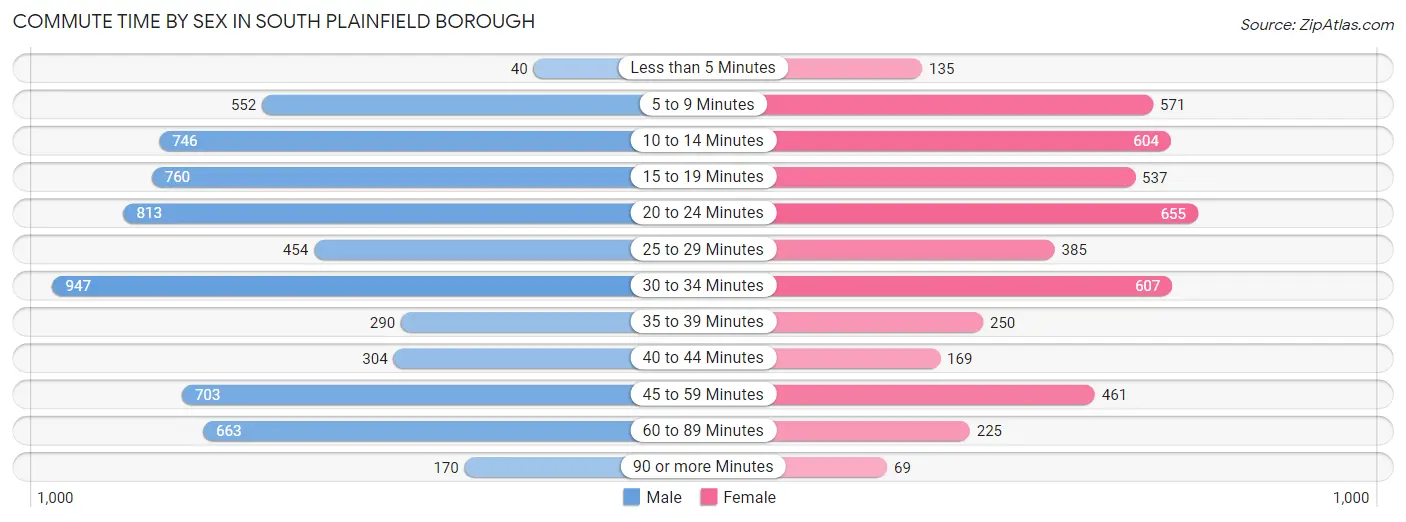
| Commute Time | Male | Female |
| Less than 5 Minutes | 40 (0.6%) | 135 (2.9%) |
| 5 to 9 Minutes | 552 (8.6%) | 571 (12.2%) |
| 10 to 14 Minutes | 746 (11.6%) | 604 (12.9%) |
| 15 to 19 Minutes | 760 (11.8%) | 537 (11.5%) |
| 20 to 24 Minutes | 813 (12.6%) | 655 (14.0%) |
| 25 to 29 Minutes | 454 (7.0%) | 385 (8.3%) |
| 30 to 34 Minutes | 947 (14.7%) | 607 (13.0%) |
| 35 to 39 Minutes | 290 (4.5%) | 250 (5.4%) |
| 40 to 44 Minutes | 304 (4.7%) | 169 (3.6%) |
| 45 to 59 Minutes | 703 (10.9%) | 461 (9.9%) |
| 60 to 89 Minutes | 663 (10.3%) | 225 (4.8%) |
| 90 or more Minutes | 170 (2.6%) | 69 (1.5%) |
Time of Departure to Work by Sex in South Plainfield borough
The most frequent times of departure to work in South Plainfield borough are 7:00 AM to 7:29 AM (811, 12.6%) for males and 7:30 AM to 7:59 AM (814, 17.4%) for females.
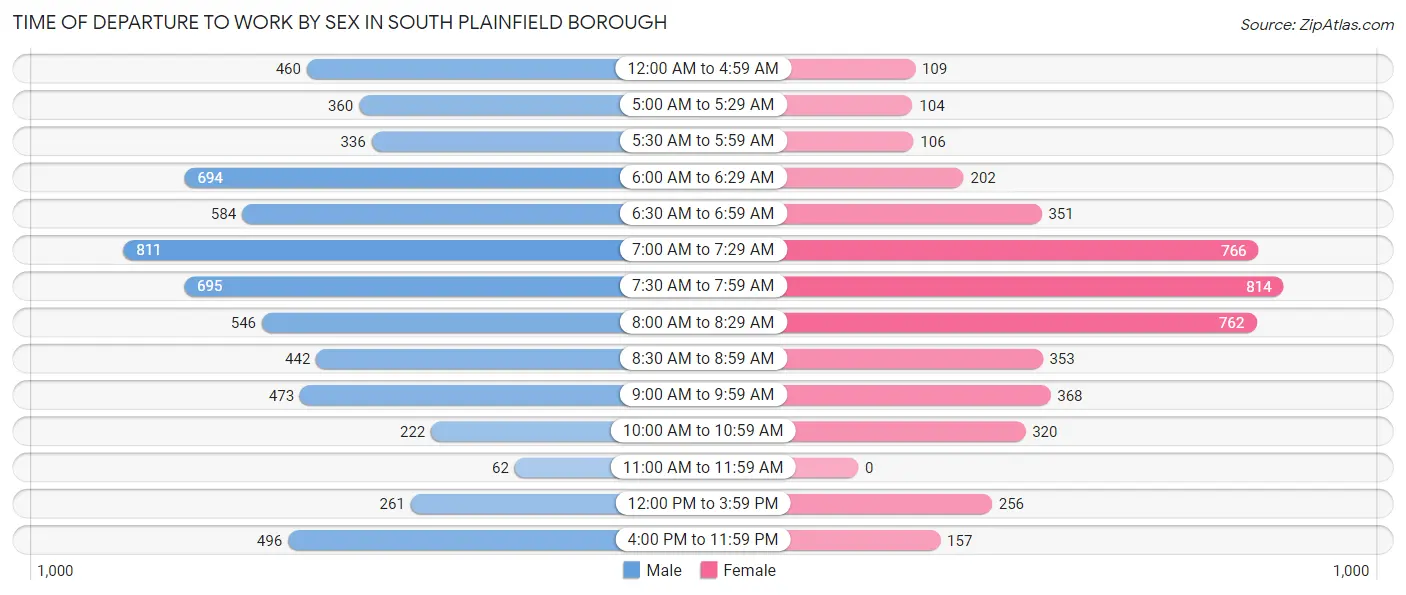
| Time of Departure | Male | Female |
| 12:00 AM to 4:59 AM | 460 (7.1%) | 109 (2.3%) |
| 5:00 AM to 5:29 AM | 360 (5.6%) | 104 (2.2%) |
| 5:30 AM to 5:59 AM | 336 (5.2%) | 106 (2.3%) |
| 6:00 AM to 6:29 AM | 694 (10.8%) | 202 (4.3%) |
| 6:30 AM to 6:59 AM | 584 (9.1%) | 351 (7.5%) |
| 7:00 AM to 7:29 AM | 811 (12.6%) | 766 (16.4%) |
| 7:30 AM to 7:59 AM | 695 (10.8%) | 814 (17.4%) |
| 8:00 AM to 8:29 AM | 546 (8.5%) | 762 (16.3%) |
| 8:30 AM to 8:59 AM | 442 (6.9%) | 353 (7.6%) |
| 9:00 AM to 9:59 AM | 473 (7.3%) | 368 (7.9%) |
| 10:00 AM to 10:59 AM | 222 (3.5%) | 320 (6.9%) |
| 11:00 AM to 11:59 AM | 62 (1.0%) | 0 (0.0%) |
| 12:00 PM to 3:59 PM | 261 (4.1%) | 256 (5.5%) |
| 4:00 PM to 11:59 PM | 496 (7.7%) | 157 (3.4%) |
| Total | 6,442 (100.0%) | 4,668 (100.0%) |
Housing Occupancy in South Plainfield borough
Occupancy by Ownership in South Plainfield borough
Of the total 8,150 dwellings in South Plainfield borough, owner-occupied units account for 6,961 (85.4%), while renter-occupied units make up 1,189 (14.6%).
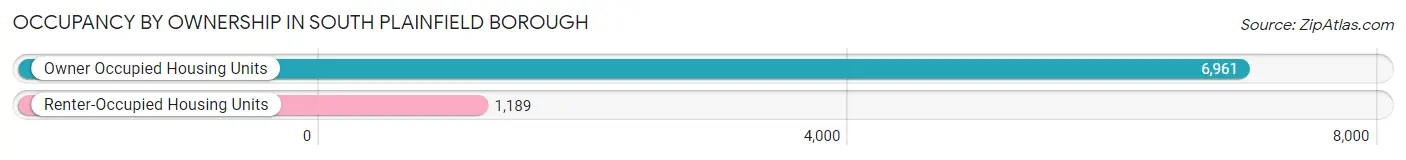
| Occupancy | # Housing Units | % Housing Units |
| Owner Occupied Housing Units | 6,961 | 85.4% |
| Renter-Occupied Housing Units | 1,189 | 14.6% |
| Total Occupied Housing Units | 8,150 | 100.0% |
Occupancy by Household Size in South Plainfield borough
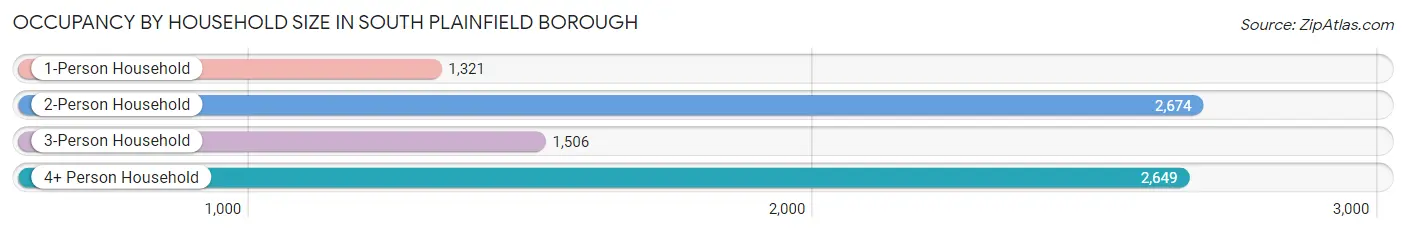
| Household Size | # Housing Units | % Housing Units |
| 1-Person Household | 1,321 | 16.2% |
| 2-Person Household | 2,674 | 32.8% |
| 3-Person Household | 1,506 | 18.5% |
| 4+ Person Household | 2,649 | 32.5% |
| Total Housing Units | 8,150 | 100.0% |
Occupancy by Ownership by Household Size in South Plainfield borough
| Household Size | Owner-occupied | Renter-occupied |
| 1-Person Household | 974 (73.7%) | 347 (26.3%) |
| 2-Person Household | 2,345 (87.7%) | 329 (12.3%) |
| 3-Person Household | 1,318 (87.5%) | 188 (12.5%) |
| 4+ Person Household | 2,324 (87.7%) | 325 (12.3%) |
| Total Housing Units | 6,961 (85.4%) | 1,189 (14.6%) |
Occupancy by Educational Attainment in South Plainfield borough
| Household Size | Owner-occupied | Renter-occupied |
| Less than High School | 407 (87.2%) | 60 (12.9%) |
| High School Diploma | 1,611 (86.4%) | 254 (13.6%) |
| College/Associate Degree | 1,755 (83.1%) | 357 (16.9%) |
| Bachelor's Degree or higher | 3,188 (86.0%) | 518 (14.0%) |
Occupancy by Age of Householder in South Plainfield borough
| Age Bracket | # Households | % Households |
| Under 35 Years | 920 | 11.3% |
| 35 to 44 Years | 1,648 | 20.2% |
| 45 to 54 Years | 1,542 | 18.9% |
| 55 to 64 Years | 1,688 | 20.7% |
| 65 to 74 Years | 1,390 | 17.1% |
| 75 to 84 Years | 584 | 7.2% |
| 85 Years and Over | 378 | 4.6% |
| Total | 8,150 | 100.0% |
Housing Finances in South Plainfield borough
Median Income by Occupancy in South Plainfield borough
| Occupancy Type | # Households | Median Income |
| Owner-Occupied | 6,961 (85.4%) | $134,107 |
| Renter-Occupied | 1,189 (14.6%) | $100,089 |
| Average | 8,150 (100.0%) | $123,417 |
Occupancy by Householder Income Bracket in South Plainfield borough
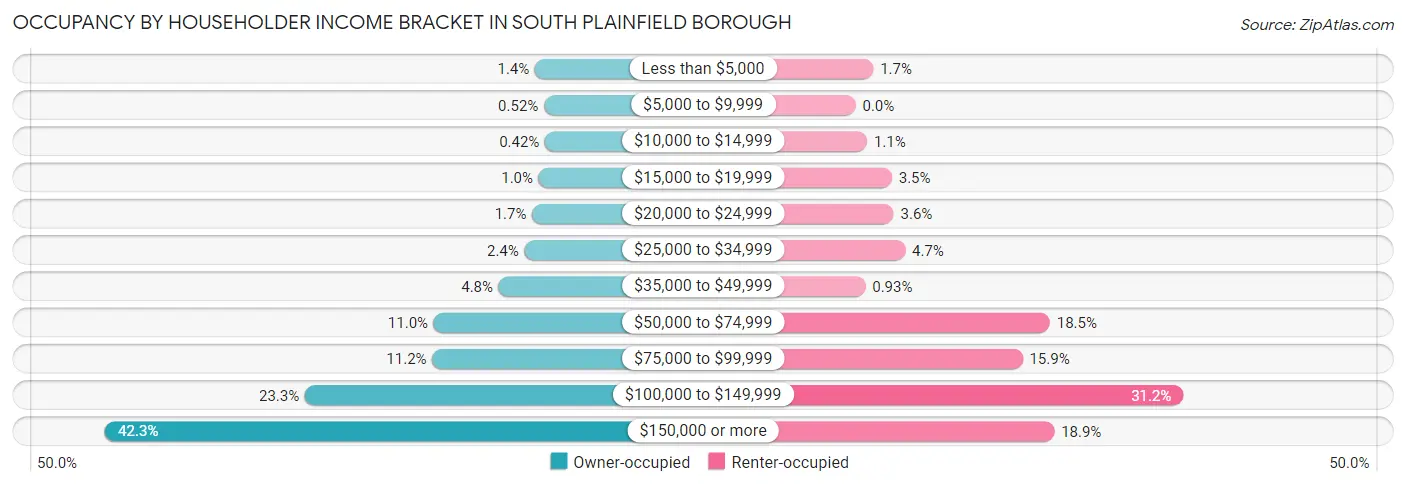
| Income Bracket | Owner-occupied | Renter-occupied |
| Less than $5,000 | 96 (1.4%) | 20 (1.7%) |
| $5,000 to $9,999 | 36 (0.5%) | 0 (0.0%) |
| $10,000 to $14,999 | 29 (0.4%) | 13 (1.1%) |
| $15,000 to $19,999 | 71 (1.0%) | 41 (3.5%) |
| $20,000 to $24,999 | 115 (1.7%) | 43 (3.6%) |
| $25,000 to $34,999 | 166 (2.4%) | 56 (4.7%) |
| $35,000 to $49,999 | 336 (4.8%) | 11 (0.9%) |
| $50,000 to $74,999 | 767 (11.0%) | 220 (18.5%) |
| $75,000 to $99,999 | 777 (11.2%) | 189 (15.9%) |
| $100,000 to $149,999 | 1,621 (23.3%) | 371 (31.2%) |
| $150,000 or more | 2,947 (42.3%) | 225 (18.9%) |
| Total | 6,961 (100.0%) | 1,189 (100.0%) |
Monthly Housing Cost Tiers in South Plainfield borough
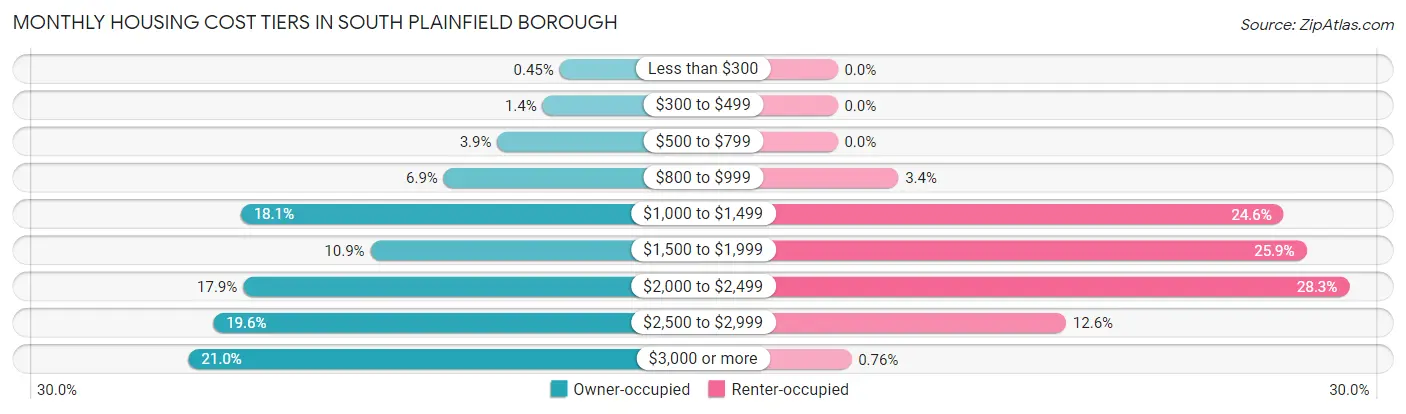
| Monthly Cost | Owner-occupied | Renter-occupied |
| Less than $300 | 31 (0.4%) | 0 (0.0%) |
| $300 to $499 | 97 (1.4%) | 0 (0.0%) |
| $500 to $799 | 271 (3.9%) | 0 (0.0%) |
| $800 to $999 | 477 (6.9%) | 40 (3.4%) |
| $1,000 to $1,499 | 1,257 (18.1%) | 293 (24.6%) |
| $1,500 to $1,999 | 759 (10.9%) | 308 (25.9%) |
| $2,000 to $2,499 | 1,248 (17.9%) | 336 (28.3%) |
| $2,500 to $2,999 | 1,363 (19.6%) | 150 (12.6%) |
| $3,000 or more | 1,458 (20.9%) | 9 (0.8%) |
| Total | 6,961 (100.0%) | 1,189 (100.0%) |
Physical Housing Characteristics in South Plainfield borough
Housing Structures in South Plainfield borough
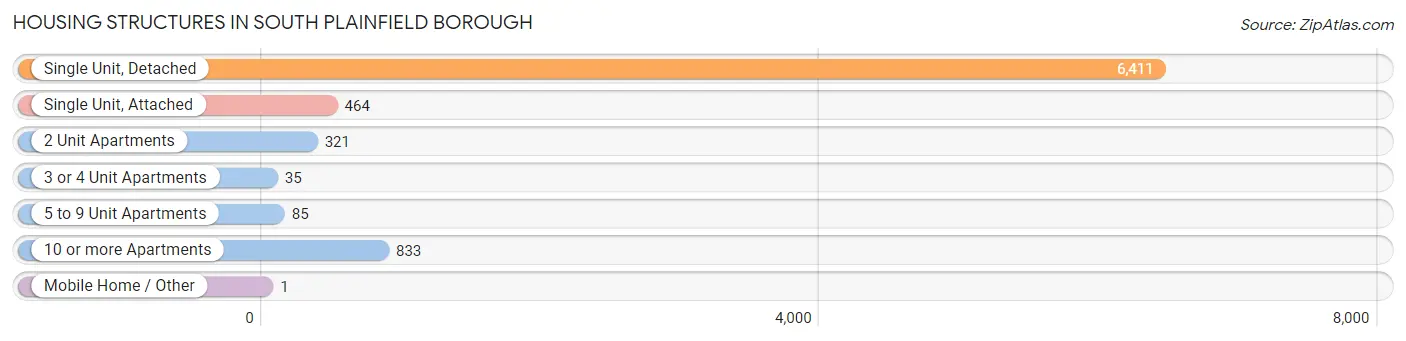
| Structure Type | # Housing Units | % Housing Units |
| Single Unit, Detached | 6,411 | 78.7% |
| Single Unit, Attached | 464 | 5.7% |
| 2 Unit Apartments | 321 | 3.9% |
| 3 or 4 Unit Apartments | 35 | 0.4% |
| 5 to 9 Unit Apartments | 85 | 1.0% |
| 10 or more Apartments | 833 | 10.2% |
| Mobile Home / Other | 1 | 0.0% |
| Total | 8,150 | 100.0% |
Housing Structures by Occupancy in South Plainfield borough
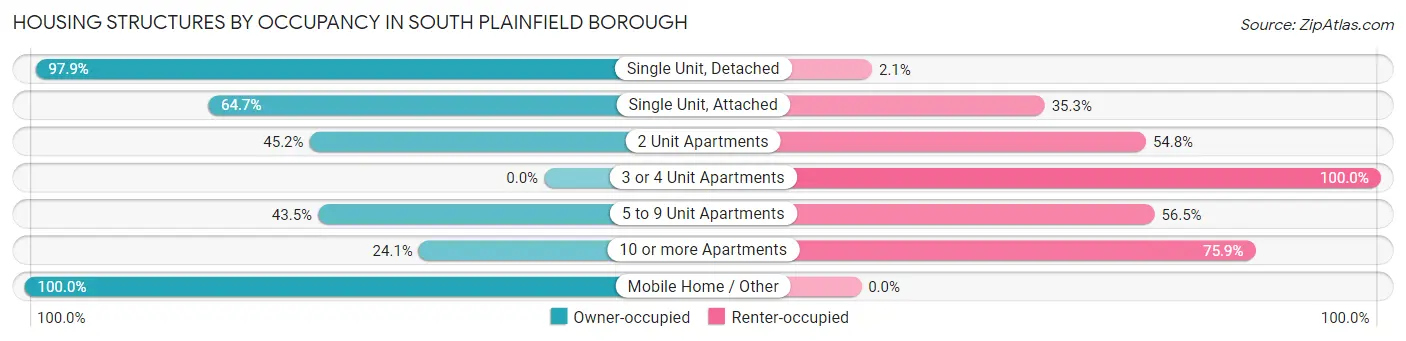
| Structure Type | Owner-occupied | Renter-occupied |
| Single Unit, Detached | 6,277 (97.9%) | 134 (2.1%) |
| Single Unit, Attached | 300 (64.7%) | 164 (35.3%) |
| 2 Unit Apartments | 145 (45.2%) | 176 (54.8%) |
| 3 or 4 Unit Apartments | 0 (0.0%) | 35 (100.0%) |
| 5 to 9 Unit Apartments | 37 (43.5%) | 48 (56.5%) |
| 10 or more Apartments | 201 (24.1%) | 632 (75.9%) |
| Mobile Home / Other | 1 (100.0%) | 0 (0.0%) |
| Total | 6,961 (85.4%) | 1,189 (14.6%) |
Housing Structures by Number of Rooms in South Plainfield borough
| Number of Rooms | Owner-occupied | Renter-occupied |
| 1 Room | 0 (0.0%) | 31 (2.6%) |
| 2 or 3 Rooms | 176 (2.5%) | 159 (13.4%) |
| 4 or 5 Rooms | 1,376 (19.8%) | 820 (69.0%) |
| 6 or 7 Rooms | 2,952 (42.4%) | 142 (11.9%) |
| 8 or more Rooms | 2,457 (35.3%) | 37 (3.1%) |
| Total | 6,961 (100.0%) | 1,189 (100.0%) |
Housing Structure by Heating Type in South Plainfield borough
| Heating Type | Owner-occupied | Renter-occupied |
| Utility Gas | 6,034 (86.7%) | 955 (80.3%) |
| Bottled, Tank, or LP Gas | 42 (0.6%) | 33 (2.8%) |
| Electricity | 455 (6.5%) | 148 (12.4%) |
| Fuel Oil or Kerosene | 263 (3.8%) | 53 (4.5%) |
| Coal or Coke | 0 (0.0%) | 0 (0.0%) |
| All other Fuels | 38 (0.5%) | 0 (0.0%) |
| No Fuel Used | 129 (1.8%) | 0 (0.0%) |
| Total | 6,961 (100.0%) | 1,189 (100.0%) |
Household Vehicle Usage in South Plainfield borough
| Vehicles per Household | Owner-occupied | Renter-occupied |
| No Vehicle | 130 (1.9%) | 125 (10.5%) |
| 1 Vehicle | 1,222 (17.5%) | 484 (40.7%) |
| 2 Vehicles | 3,259 (46.8%) | 449 (37.8%) |
| 3 or more Vehicles | 2,350 (33.8%) | 131 (11.0%) |
| Total | 6,961 (100.0%) | 1,189 (100.0%) |
Real Estate & Mortgages in South Plainfield borough
Real Estate and Mortgage Overview in South Plainfield borough
| Characteristic | Without Mortgage | With Mortgage |
| Housing Units | 2,124 | 4,837 |
| Median Property Value | $412,000 | $419,000 |
| Median Household Income | $101,218 | $2,424 |
| Monthly Housing Costs | $1,067 | $1,443 |
| Real Estate Taxes | $8,408 | $21 |
Property Value by Mortgage Status in South Plainfield borough
| Property Value | Without Mortgage | With Mortgage |
| Less than $50,000 | 84 (4.0%) | 47 (1.0%) |
| $50,000 to $99,999 | 0 (0.0%) | 86 (1.8%) |
| $100,000 to $299,999 | 299 (14.1%) | 265 (5.5%) |
| $300,000 to $499,999 | 1,234 (58.1%) | 3,585 (74.1%) |
| $500,000 to $749,999 | 450 (21.2%) | 785 (16.2%) |
| $750,000 to $999,999 | 8 (0.4%) | 39 (0.8%) |
| $1,000,000 or more | 49 (2.3%) | 30 (0.6%) |
| Total | 2,124 (100.0%) | 4,837 (100.0%) |
Household Income by Mortgage Status in South Plainfield borough
| Household Income | Without Mortgage | With Mortgage |
| Less than $10,000 | 50 (2.4%) | 88 (1.8%) |
| $10,000 to $24,999 | 135 (6.4%) | 82 (1.7%) |
| $25,000 to $34,999 | 137 (6.5%) | 80 (1.7%) |
| $35,000 to $49,999 | 193 (9.1%) | 29 (0.6%) |
| $50,000 to $74,999 | 246 (11.6%) | 143 (3.0%) |
| $75,000 to $99,999 | 282 (13.3%) | 521 (10.8%) |
| $100,000 to $149,999 | 558 (26.3%) | 495 (10.2%) |
| $150,000 or more | 523 (24.6%) | 1,063 (22.0%) |
| Total | 2,124 (100.0%) | 4,837 (100.0%) |
Property Value to Household Income Ratio in South Plainfield borough
| Value-to-Income Ratio | Without Mortgage | With Mortgage |
| Less than 2.0x | 256 (12.0%) | 150,598 (3,113.5%) |
| 2.0x to 2.9x | 518 (24.4%) | 1,184 (24.5%) |
| 3.0x to 3.9x | 308 (14.5%) | 1,519 (31.4%) |
| 4.0x or more | 1,024 (48.2%) | 759 (15.7%) |
| Total | 2,124 (100.0%) | 4,837 (100.0%) |
Real Estate Taxes by Mortgage Status in South Plainfield borough
| Property Taxes | Without Mortgage | With Mortgage |
| Less than $800 | 5 (0.2%) | 71 (1.5%) |
| $800 to $1,499 | 36 (1.7%) | 119 (2.5%) |
| $800 to $1,499 | 2,027 (95.4%) | 18 (0.4%) |
| Total | 2,124 (100.0%) | 4,837 (100.0%) |
Health & Disability in South Plainfield borough
Health Insurance Coverage by Age in South Plainfield borough
| Age Bracket | With Coverage | Without Coverage |
| Under 6 Years | 1,912 (98.5%) | 30 (1.5%) |
| 6 to 18 Years | 3,136 (98.4%) | 52 (1.6%) |
| 19 to 25 Years | 1,743 (97.3%) | 49 (2.7%) |
| 26 to 34 Years | 3,027 (96.8%) | 101 (3.2%) |
| 35 to 44 Years | 3,129 (95.6%) | 143 (4.4%) |
| 45 to 54 Years | 3,049 (96.3%) | 118 (3.7%) |
| 55 to 64 Years | 3,296 (97.8%) | 76 (2.2%) |
| 65 to 74 Years | 2,510 (98.9%) | 27 (1.1%) |
| 75 Years and older | 1,546 (92.9%) | 118 (7.1%) |
| Total | 23,348 (97.0%) | 714 (3.0%) |
Health Insurance Coverage by Citizenship Status in South Plainfield borough
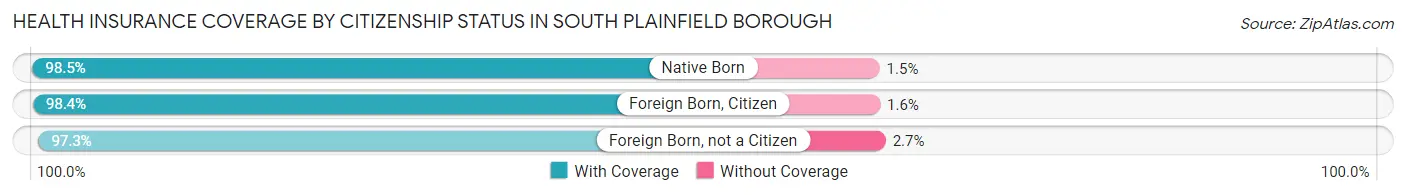
| Citizenship Status | With Coverage | Without Coverage |
| Native Born | 1,912 (98.5%) | 30 (1.5%) |
| Foreign Born, Citizen | 3,136 (98.4%) | 52 (1.6%) |
| Foreign Born, not a Citizen | 1,743 (97.3%) | 49 (2.7%) |
Health Insurance Coverage by Household Income in South Plainfield borough
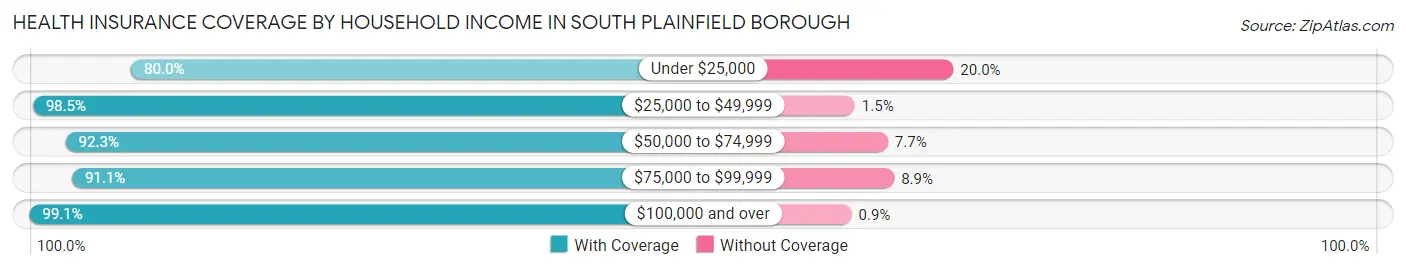
| Household Income | With Coverage | Without Coverage |
| Under $25,000 | 553 (80.0%) | 138 (20.0%) |
| $25,000 to $49,999 | 974 (98.5%) | 15 (1.5%) |
| $50,000 to $74,999 | 2,193 (92.3%) | 183 (7.7%) |
| $75,000 to $99,999 | 2,268 (91.1%) | 221 (8.9%) |
| $100,000 and over | 17,294 (99.1%) | 157 (0.9%) |
Public vs Private Health Insurance Coverage by Age in South Plainfield borough
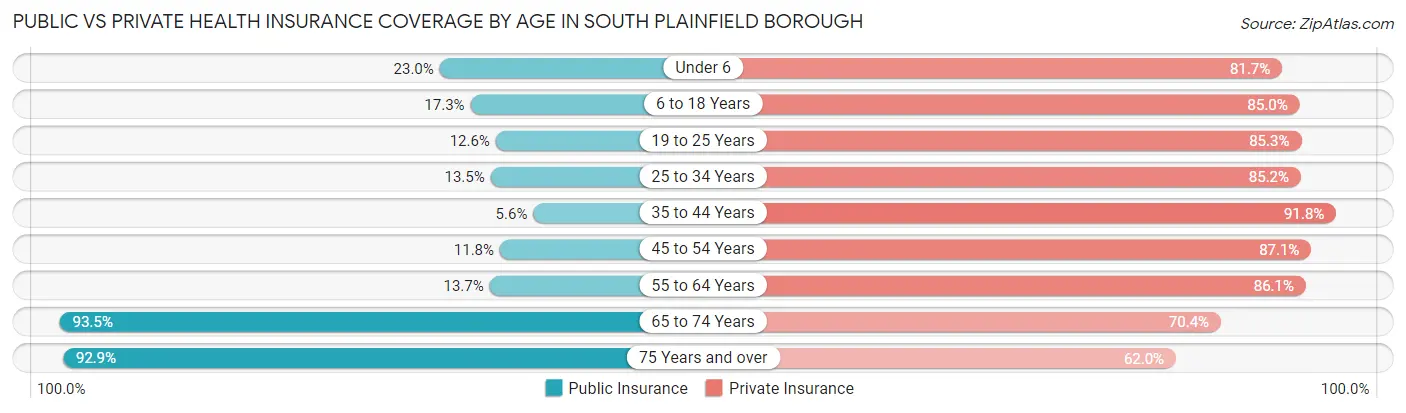
| Age Bracket | Public Insurance | Private Insurance |
| Under 6 | 446 (23.0%) | 1,587 (81.7%) |
| 6 to 18 Years | 550 (17.2%) | 2,709 (85.0%) |
| 19 to 25 Years | 225 (12.6%) | 1,528 (85.3%) |
| 25 to 34 Years | 423 (13.5%) | 2,665 (85.2%) |
| 35 to 44 Years | 183 (5.6%) | 3,002 (91.7%) |
| 45 to 54 Years | 373 (11.8%) | 2,759 (87.1%) |
| 55 to 64 Years | 462 (13.7%) | 2,904 (86.1%) |
| 65 to 74 Years | 2,372 (93.5%) | 1,785 (70.4%) |
| 75 Years and over | 1,546 (92.9%) | 1,032 (62.0%) |
| Total | 6,580 (27.4%) | 19,971 (83.0%) |
Disability Status by Sex by Age in South Plainfield borough
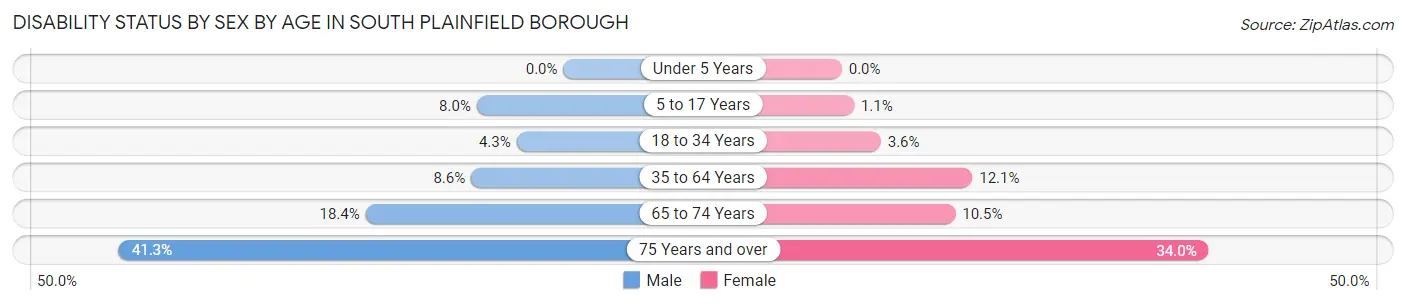
| Age Bracket | Male | Female |
| Under 5 Years | 0 (0.0%) | 0 (0.0%) |
| 5 to 17 Years | 128 (8.0%) | 18 (1.1%) |
| 18 to 34 Years | 130 (4.3%) | 79 (3.6%) |
| 35 to 64 Years | 412 (8.6%) | 606 (12.1%) |
| 65 to 74 Years | 220 (18.4%) | 141 (10.5%) |
| 75 Years and over | 250 (41.2%) | 360 (34.0%) |
Disability Class by Sex by Age in South Plainfield borough
Disability Class: Hearing Difficulty
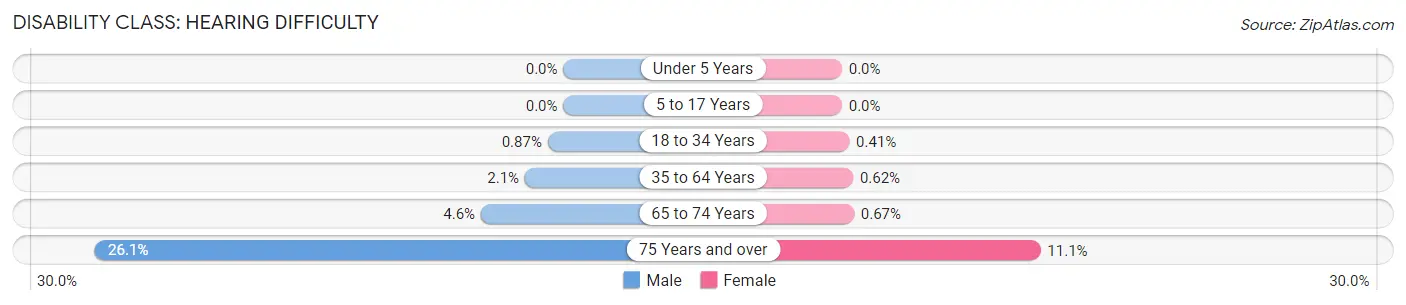
| Age Bracket | Male | Female |
| Under 5 Years | 0 (0.0%) | 0 (0.0%) |
| 5 to 17 Years | 0 (0.0%) | 0 (0.0%) |
| 18 to 34 Years | 26 (0.9%) | 9 (0.4%) |
| 35 to 64 Years | 103 (2.1%) | 31 (0.6%) |
| 65 to 74 Years | 55 (4.6%) | 9 (0.7%) |
| 75 Years and over | 158 (26.1%) | 117 (11.1%) |
Disability Class: Vision Difficulty
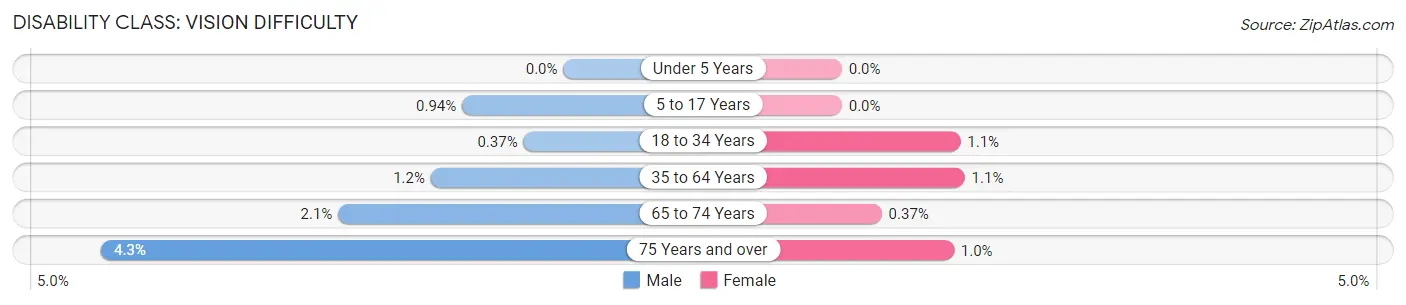
| Age Bracket | Male | Female |
| Under 5 Years | 0 (0.0%) | 0 (0.0%) |
| 5 to 17 Years | 15 (0.9%) | 0 (0.0%) |
| 18 to 34 Years | 11 (0.4%) | 24 (1.1%) |
| 35 to 64 Years | 59 (1.2%) | 57 (1.1%) |
| 65 to 74 Years | 25 (2.1%) | 5 (0.4%) |
| 75 Years and over | 26 (4.3%) | 11 (1.0%) |
Disability Class: Cognitive Difficulty
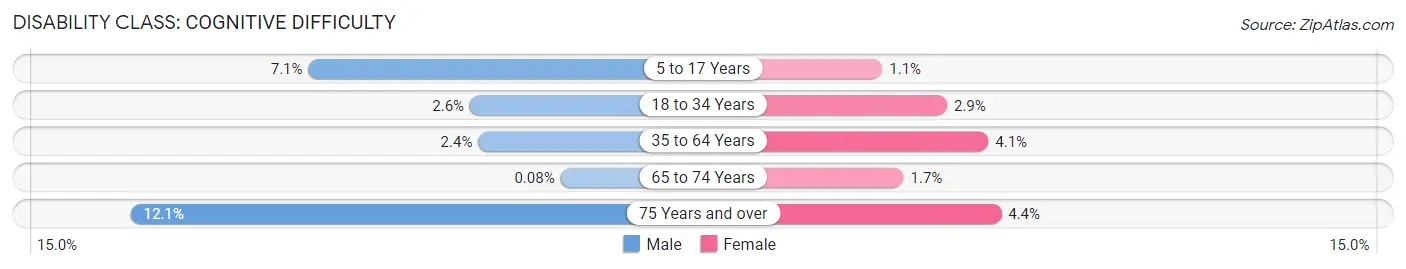
| Age Bracket | Male | Female |
| 5 to 17 Years | 113 (7.1%) | 18 (1.1%) |
| 18 to 34 Years | 78 (2.6%) | 64 (2.9%) |
| 35 to 64 Years | 114 (2.4%) | 204 (4.1%) |
| 65 to 74 Years | 1 (0.1%) | 23 (1.7%) |
| 75 Years and over | 73 (12.0%) | 47 (4.4%) |
Disability Class: Ambulatory Difficulty
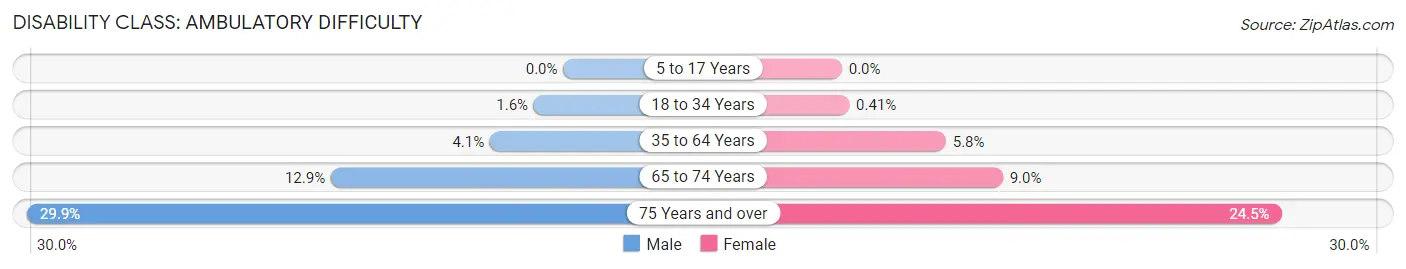
| Age Bracket | Male | Female |
| 5 to 17 Years | 0 (0.0%) | 0 (0.0%) |
| 18 to 34 Years | 49 (1.6%) | 9 (0.4%) |
| 35 to 64 Years | 196 (4.1%) | 290 (5.8%) |
| 65 to 74 Years | 155 (12.9%) | 120 (9.0%) |
| 75 Years and over | 181 (29.9%) | 259 (24.5%) |
Disability Class: Self-Care Difficulty
| Age Bracket | Male | Female |
| 5 to 17 Years | 0 (0.0%) | 0 (0.0%) |
| 18 to 34 Years | 53 (1.8%) | 9 (0.4%) |
| 35 to 64 Years | 155 (3.2%) | 169 (3.4%) |
| 65 to 74 Years | 21 (1.8%) | 0 (0.0%) |
| 75 Years and over | 47 (7.8%) | 29 (2.7%) |
Technology Access in South Plainfield borough
Computing Device Access in South Plainfield borough
| Device Type | # Households | % Households |
| Desktop or Laptop | 7,375 | 90.5% |
| Smartphone | 7,238 | 88.8% |
| Tablet | 6,187 | 75.9% |
| No Computing Device | 360 | 4.4% |
| Total | 8,150 | 100.0% |
Internet Access in South Plainfield borough
| Internet Type | # Households | % Households |
| Dial-Up Internet | 5 | 0.1% |
| Broadband Home | 6,884 | 84.5% |
| Cellular Data Only | 586 | 7.2% |
| Satellite Internet | 364 | 4.5% |
| No Internet | 563 | 6.9% |
| Total | 8,150 | 100.0% |
South Plainfield borough Summary
Introduction
South Plainfield Borough is a small borough located in Middlesex County, New Jersey. It is situated in the Raritan Valley region of Central New Jersey and is part of the larger New York metropolitan area. The borough is home to a population of approximately 23,000 people and is known for its small-town charm and close-knit community.
History
The area that is now South Plainfield was originally inhabited by the Lenape Native Americans. The first European settlers arrived in the area in the late 17th century and the area was officially incorporated as a borough in 1926. The borough was named after the nearby Plainfield Township, which was named for its flat terrain.
The borough experienced rapid growth in the early 20th century due to its proximity to New York City and its access to major transportation routes. The borough was home to several factories and businesses, including the National Biscuit Company (now Nabisco) and the American Can Company.
Geography
South Plainfield is located in the Raritan Valley region of Central New Jersey. It is situated in the northern part of Middlesex County, approximately 25 miles southwest of New York City. The borough is bordered by Plainfield Township to the north, Piscataway Township to the east, Edison Township to the south, and Dunellen Borough to the west.
The borough has a total area of 4.2 square miles, all of which is land. The borough is located in the Raritan Valley, which is a low-lying area between the Watchung Mountains and the Sourland Mountains. The borough is located in the Piedmont region of New Jersey, which is characterized by rolling hills and valleys.
Economy
South Plainfield is home to a diverse economy. The borough is home to several large companies, including the pharmaceutical company Bristol-Myers Squibb, the food manufacturer Nestle, and the electronics company Panasonic. The borough is also home to several smaller businesses, including restaurants, retail stores, and professional services.
The borough is home to several industrial parks, which are home to a variety of businesses. The borough is also home to several corporate headquarters, including the headquarters of the pharmaceutical company Merck & Co. and the food manufacturer Nestle.
Demographics
As of the 2010 census, South Plainfield had a population of 23,385. The racial makeup of the borough was 79.2% White, 8.3% African American, 0.3% Native American, 6.7% Asian, and 4.5% from other races. Hispanic or Latino of any race were 15.2% of the population.
The median household income in the borough was $76,837, and the median family income was $90,917. The per capita income in the borough was $32,945. About 4.2% of families and 5.7% of the population were below the poverty line.
Conclusion
South Plainfield Borough is a small borough located in Middlesex County, New Jersey. It is situated in the Raritan Valley region of Central New Jersey and is part of the larger New York metropolitan area. The borough is home to a population of approximately 23,000 people and is known for its small-town charm and close-knit community. The borough has a diverse economy and is home to several large companies, including the pharmaceutical company Bristol-Myers Squibb, the food manufacturer Nestle, and the electronics company Panasonic. The borough is also home to several smaller businesses, including restaurants, retail stores, and professional services. The racial makeup of the borough is 79.2% White, 8.3% African American, 0.3% Native American, 6.7% Asian, and 4.5% from other races. The median household income in the borough was $76,837, and the median family income was $90,917. South Plainfield is a vibrant borough with a rich history and a bright future.
Common Questions
What is Per Capita Income in South Plainfield borough?
Per Capita income in South Plainfield borough is $48,206.
What is the Median Family Income in South Plainfield borough?
Median Family Income in South Plainfield borough is $145,288.
What is the Median Household income in South Plainfield borough?
Median Household Income in South Plainfield borough is $123,417.
What is Income or Wage Gap in South Plainfield borough?
Income or Wage Gap in South Plainfield borough is 23.1%.
Women in South Plainfield borough earn 76.9 cents for every dollar earned by a man.
What is Family Income Deficit in South Plainfield borough?
Family Income Deficit in South Plainfield borough is $10,381.
Families that are below poverty line in South Plainfield borough earn $10,381 less on average than the poverty threshold level.
What is Inequality or Gini Index in South Plainfield borough?
Inequality or Gini Index in South Plainfield borough is 0.34.
What is the Total Population of South Plainfield borough?
Total Population of South Plainfield borough is 24,273.
What is the Total Male Population of South Plainfield borough?
Total Male Population of South Plainfield borough is 11,872.
What is the Total Female Population of South Plainfield borough?
Total Female Population of South Plainfield borough is 12,401.
What is the Ratio of Males per 100 Females in South Plainfield borough?
There are 95.73 Males per 100 Females in South Plainfield borough.
What is the Ratio of Females per 100 Males in South Plainfield borough?
There are 104.46 Females per 100 Males in South Plainfield borough.
What is the Median Population Age in South Plainfield borough?
Median Population Age in South Plainfield borough is 41.8 Years.
What is the Average Family Size in South Plainfield borough
Average Family Size in South Plainfield borough is 3.3 People.
What is the Average Household Size in South Plainfield borough
Average Household Size in South Plainfield borough is 2.9 People.
How Large is the Labor Force in South Plainfield borough?
There are 13,872 People in the Labor Forcein in South Plainfield borough.
What is the Percentage of People in the Labor Force in South Plainfield borough?
69.6% of People are in the Labor Force in South Plainfield borough.
What is the Unemployment Rate in South Plainfield borough?
Unemployment Rate in South Plainfield borough is 7.2%.