Cities with the Highest Percentage of Asian Population in Utah
RELATED REPORTS & OPTIONS
Asian
Utah
Compare Cities
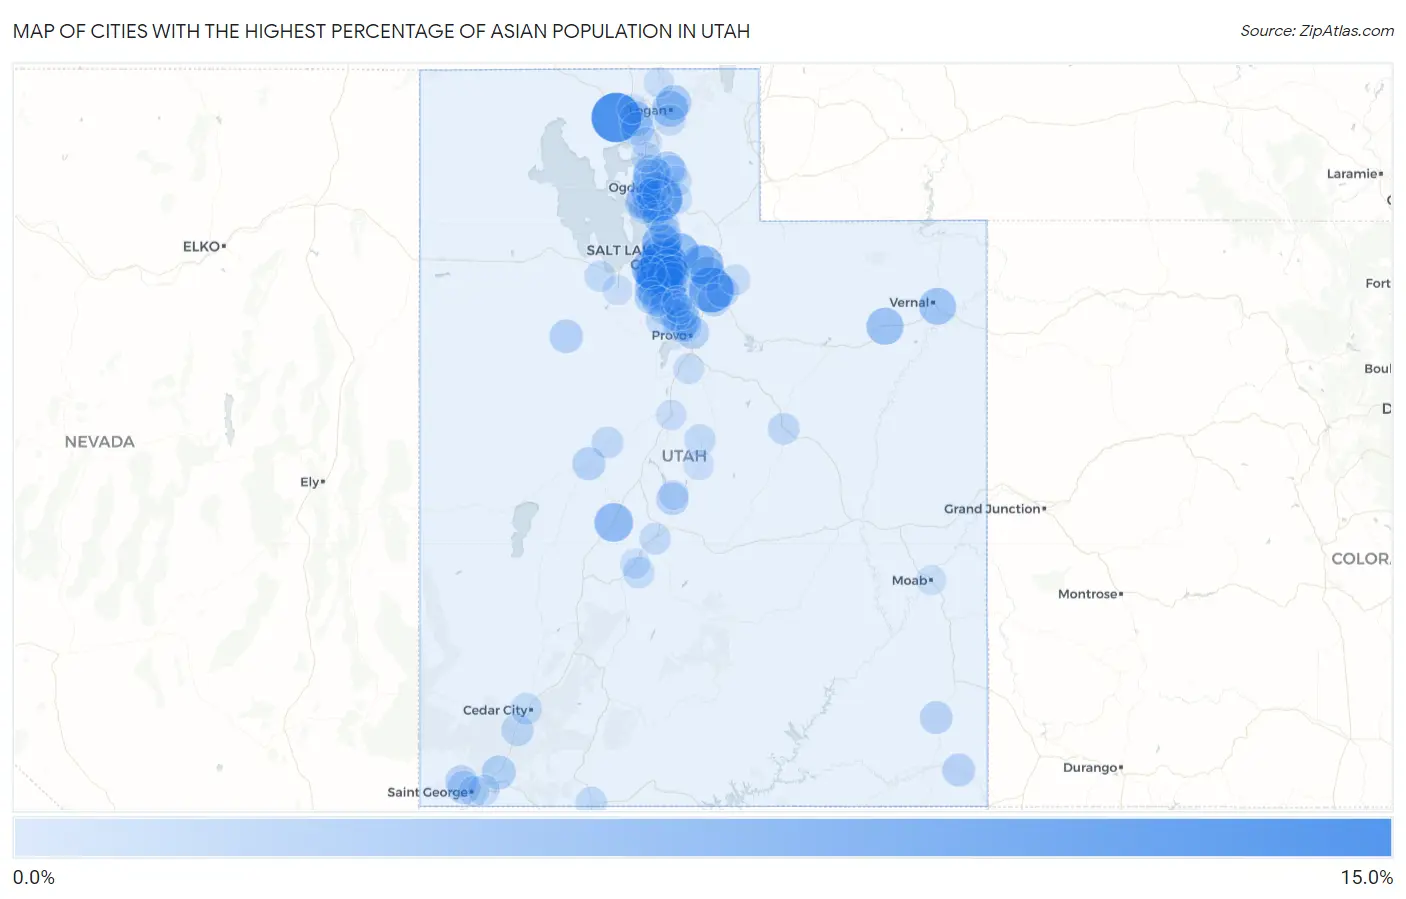
Map of Cities with the Highest Percentage of Asian Population in Utah
0.0%
15.0%
Cities with the Highest Percentage of Asian Population in Utah
| City | Asian | vs State | vs National | |
| 1. | Thatcher | 10.7% | 2.4%(+8.33)#1 | 5.8%(+4.93)#1,308 |
| 2. | South Salt Lake | 9.4% | 2.4%(+7.08)#2 | 5.8%(+3.67)#1,513 |
| 3. | Interlaken | 8.3% | 2.4%(+5.97)#3 | 5.8%(+2.56)#1,736 |
| 4. | Uintah | 8.1% | 2.4%(+5.76)#4 | 5.8%(+2.36)#1,783 |
| 5. | Taylorsville | 6.9% | 2.4%(+4.58)#5 | 5.8%(+1.17)#2,112 |
| 6. | West Valley City | 5.4% | 2.4%(+3.05)#6 | 5.8%(-0.359)#2,757 |
| 7. | Salt Lake City | 5.4% | 2.4%(+3.00)#7 | 5.8%(-0.403)#2,786 |
| 8. | Snyderville | 5.3% | 2.4%(+2.89)#8 | 5.8%(-0.520)#2,854 |
| 9. | North Salt Lake | 5.2% | 2.4%(+2.83)#9 | 5.8%(-0.579)#2,889 |
| 10. | Fillmore | 5.1% | 2.4%(+2.73)#10 | 5.8%(-0.679)#2,943 |
| 11. | Emigration Canyon | 5.1% | 2.4%(+2.69)#11 | 5.8%(-0.716)#2,961 |
| 12. | South Jordan | 4.5% | 2.4%(+2.13)#12 | 5.8%(-1.28)#3,310 |
| 13. | Ballard | 4.3% | 2.4%(+1.93)#13 | 5.8%(-1.48)#3,450 |
| 14. | Millcreek | 4.2% | 2.4%(+1.79)#14 | 5.8%(-1.61)#3,563 |
| 15. | Naples | 4.1% | 2.4%(+1.77)#15 | 5.8%(-1.63)#3,582 |
| 16. | Draper | 4.1% | 2.4%(+1.75)#16 | 5.8%(-1.65)#3,595 |
| 17. | Midvale | 3.9% | 2.4%(+1.54)#17 | 5.8%(-1.86)#3,772 |
| 18. | Murray | 3.9% | 2.4%(+1.52)#18 | 5.8%(-1.88)#3,791 |
| 19. | White | 3.8% | 2.4%(+1.41)#19 | 5.8%(-2.00)#3,879 |
| 20. | Logan | 3.7% | 2.4%(+1.34)#20 | 5.8%(-2.07)#3,937 |
| 21. | Sandy | 3.6% | 2.4%(+1.22)#21 | 5.8%(-2.18)#4,052 |
| 22. | Pleasant View | 3.4% | 2.4%(+1.04)#22 | 5.8%(-2.36)#4,237 |
| 23. | Cottonwood Heights | 3.4% | 2.4%(+1.04)#23 | 5.8%(-2.37)#4,239 |
| 24. | North Logan | 3.2% | 2.4%(+0.838)#24 | 5.8%(-2.57)#4,480 |
| 25. | Park City | 3.1% | 2.4%(+0.759)#25 | 5.8%(-2.65)#4,569 |
| 26. | Liberty | 3.0% | 2.4%(+0.675)#26 | 5.8%(-2.73)#4,681 |
| 27. | Elwood | 2.8% | 2.4%(+0.448)#27 | 5.8%(-2.96)#4,987 |
| 28. | Clinton | 2.8% | 2.4%(+0.445)#28 | 5.8%(-2.96)#4,994 |
| 29. | Riverton | 2.7% | 2.4%(+0.325)#29 | 5.8%(-3.08)#5,162 |
| 30. | Leeds | 2.6% | 2.4%(+0.264)#30 | 5.8%(-3.14)#5,254 |
| 31. | Vineyard | 2.6% | 2.4%(+0.254)#31 | 5.8%(-3.15)#5,268 |
| 32. | Lindon | 2.6% | 2.4%(+0.202)#32 | 5.8%(-3.20)#5,335 |
| 33. | West Jordan | 2.6% | 2.4%(+0.197)#33 | 5.8%(-3.21)#5,341 |
| 34. | Dugway | 2.5% | 2.4%(+0.170)#34 | 5.8%(-3.23)#5,378 |
| 35. | Holladay | 2.5% | 2.4%(+0.167)#35 | 5.8%(-3.24)#5,384 |
| 36. | Bear River City | 2.4% | 2.4%(+0.071)#36 | 5.8%(-3.33)#5,523 |
| 37. | Clearfield | 2.4% | 2.4%(+0.057)#37 | 5.8%(-3.35)#5,552 |
| 38. | Herriman | 2.4% | 2.4%(+0.042)#38 | 5.8%(-3.36)#5,580 |
| 39. | Santa Clara | 2.4% | 2.4%(+0.032)#39 | 5.8%(-3.37)#5,589 |
| 40. | Delta | 2.3% | 2.4%(-0.030)#40 | 5.8%(-3.43)#5,703 |
| 41. | Provo | 2.3% | 2.4%(-0.045)#41 | 5.8%(-3.45)#5,735 |
| 42. | Charleston | 2.3% | 2.4%(-0.085)#42 | 5.8%(-3.49)#5,799 |
| 43. | Montezuma Creek | 2.2% | 2.4%(-0.162)#43 | 5.8%(-3.57)#5,952 |
| 44. | Kearns | 2.2% | 2.4%(-0.209)#44 | 5.8%(-3.61)#6,044 |
| 45. | Centerfield | 2.1% | 2.4%(-0.225)#45 | 5.8%(-3.63)#6,069 |
| 46. | West Point | 2.1% | 2.4%(-0.230)#46 | 5.8%(-3.63)#6,083 |
| 47. | Blanding | 2.1% | 2.4%(-0.245)#47 | 5.8%(-3.65)#6,116 |
| 48. | Heber | 2.1% | 2.4%(-0.255)#48 | 5.8%(-3.66)#6,137 |
| 49. | Lehi | 2.0% | 2.4%(-0.363)#49 | 5.8%(-3.77)#6,363 |
| 50. | Pleasant Grove | 2.0% | 2.4%(-0.387)#50 | 5.8%(-3.79)#6,424 |
| 51. | Farmington | 1.9% | 2.4%(-0.451)#51 | 5.8%(-3.86)#6,555 |
| 52. | Ivins | 1.9% | 2.4%(-0.504)#52 | 5.8%(-3.91)#6,677 |
| 53. | Kanarraville | 1.8% | 2.4%(-0.533)#53 | 5.8%(-3.94)#6,729 |
| 54. | Layton | 1.8% | 2.4%(-0.542)#54 | 5.8%(-3.95)#6,752 |
| 55. | West Haven | 1.8% | 2.4%(-0.574)#55 | 5.8%(-3.98)#6,839 |
| 56. | Wolf Creek | 1.8% | 2.4%(-0.602)#56 | 5.8%(-4.01)#6,897 |
| 57. | Lynndyl | 1.7% | 2.4%(-0.687)#57 | 5.8%(-4.09)#7,119 |
| 58. | West Wood | 1.7% | 2.4%(-0.713)#58 | 5.8%(-4.12)#7,188 |
| 59. | American Fork | 1.6% | 2.4%(-0.741)#59 | 5.8%(-4.15)#7,256 |
| 60. | Sigurd | 1.6% | 2.4%(-0.762)#60 | 5.8%(-4.17)#7,315 |
| 61. | Summit Park | 1.6% | 2.4%(-0.806)#61 | 5.8%(-4.21)#7,458 |
| 62. | Farr West | 1.5% | 2.4%(-0.819)#62 | 5.8%(-4.22)#7,483 |
| 63. | Roy | 1.5% | 2.4%(-0.819)#63 | 5.8%(-4.22)#7,484 |
| 64. | Highland | 1.5% | 2.4%(-0.827)#64 | 5.8%(-4.23)#7,508 |
| 65. | Kanab | 1.5% | 2.4%(-0.832)#65 | 5.8%(-4.24)#7,526 |
| 66. | Cedar City | 1.5% | 2.4%(-0.835)#66 | 5.8%(-4.24)#7,533 |
| 67. | Ogden | 1.5% | 2.4%(-0.850)#67 | 5.8%(-4.25)#7,573 |
| 68. | Moroni | 1.5% | 2.4%(-0.859)#68 | 5.8%(-4.26)#7,606 |
| 69. | Monroe | 1.5% | 2.4%(-0.866)#69 | 5.8%(-4.27)#7,625 |
| 70. | Orem | 1.4% | 2.4%(-0.926)#70 | 5.8%(-4.33)#7,815 |
| 71. | Bountiful | 1.4% | 2.4%(-0.994)#71 | 5.8%(-4.40)#8,014 |
| 72. | Mountain Green | 1.4% | 2.4%(-0.997)#72 | 5.8%(-4.40)#8,018 |
| 73. | Saratoga Springs | 1.4% | 2.4%(-1.01)#73 | 5.8%(-4.41)#8,066 |
| 74. | Washington | 1.4% | 2.4%(-1.01)#74 | 5.8%(-4.41)#8,070 |
| 75. | Kaysville | 1.4% | 2.4%(-1.02)#75 | 5.8%(-4.42)#8,094 |
| 76. | Grantsville | 1.3% | 2.4%(-1.04)#76 | 5.8%(-4.44)#8,165 |
| 77. | Nibley | 1.3% | 2.4%(-1.04)#77 | 5.8%(-4.44)#8,166 |
| 78. | Bluffdale | 1.3% | 2.4%(-1.04)#78 | 5.8%(-4.45)#8,186 |
| 79. | Centerville | 1.3% | 2.4%(-1.07)#79 | 5.8%(-4.48)#8,291 |
| 80. | Francis | 1.3% | 2.4%(-1.10)#80 | 5.8%(-4.50)#8,388 |
| 81. | Huntsville | 1.3% | 2.4%(-1.12)#81 | 5.8%(-4.52)#8,455 |
| 82. | Marriott Slaterville | 1.2% | 2.4%(-1.14)#82 | 5.8%(-4.55)#8,543 |
| 83. | Elk Ridge | 1.2% | 2.4%(-1.14)#83 | 5.8%(-4.55)#8,549 |
| 84. | North Ogden | 1.2% | 2.4%(-1.18)#84 | 5.8%(-4.58)#8,644 |
| 85. | St George | 1.1% | 2.4%(-1.22)#85 | 5.8%(-4.62)#8,786 |
| 86. | Cedar Hills | 1.1% | 2.4%(-1.26)#86 | 5.8%(-4.66)#8,918 |
| 87. | Brigham City | 1.1% | 2.4%(-1.27)#87 | 5.8%(-4.67)#8,951 |
| 88. | Nephi | 1.1% | 2.4%(-1.28)#88 | 5.8%(-4.68)#8,990 |
| 89. | Ephraim | 1.1% | 2.4%(-1.31)#89 | 5.8%(-4.71)#9,095 |
| 90. | Riverdale | 1.1% | 2.4%(-1.32)#90 | 5.8%(-4.72)#9,138 |
| 91. | Willard | 1.0% | 2.4%(-1.34)#91 | 5.8%(-4.75)#9,221 |
| 92. | Alpine | 1.0% | 2.4%(-1.35)#92 | 5.8%(-4.76)#9,268 |
| 93. | Garland | 0.97% | 2.4%(-1.40)#93 | 5.8%(-4.80)#9,459 |
| 94. | Syracuse | 0.95% | 2.4%(-1.42)#94 | 5.8%(-4.82)#9,554 |
| 95. | Moab | 0.92% | 2.4%(-1.45)#95 | 5.8%(-4.85)#9,678 |
| 96. | Tooele | 0.91% | 2.4%(-1.46)#96 | 5.8%(-4.86)#9,716 |
| 97. | Elsinore | 0.89% | 2.4%(-1.48)#97 | 5.8%(-4.88)#9,809 |
| 98. | Trenton | 0.88% | 2.4%(-1.49)#98 | 5.8%(-4.89)#9,829 |
| 99. | Gunnison | 0.88% | 2.4%(-1.49)#99 | 5.8%(-4.89)#9,830 |
| 100. | South Ogden | 0.88% | 2.4%(-1.49)#100 | 5.8%(-4.89)#9,832 |
Common Questions
What are the Top 10 Cities with the Highest Percentage of Asian Population in Utah?
Top 10 Cities with the Highest Percentage of Asian Population in Utah are:
#1
10.7%
#2
9.4%
#3
8.3%
#4
8.1%
#5
6.9%
#6
5.4%
#7
5.4%
#8
5.3%
#9
5.2%
#10
5.1%
What city has the Highest Percentage of Asian Population in Utah?
Thatcher has the Highest Percentage of Asian Population in Utah with 10.7%.
What is the Percentage of Asian Population in the State of Utah?
Percentage of Asian Population in Utah is 2.4%.
What is the Percentage of Asian Population in the United States?
Percentage of Asian Population in the United States is 5.8%.