Cities with the Highest Percentage of Asian Population in Indiana
RELATED REPORTS & OPTIONS
Asian
Indiana
Compare Cities
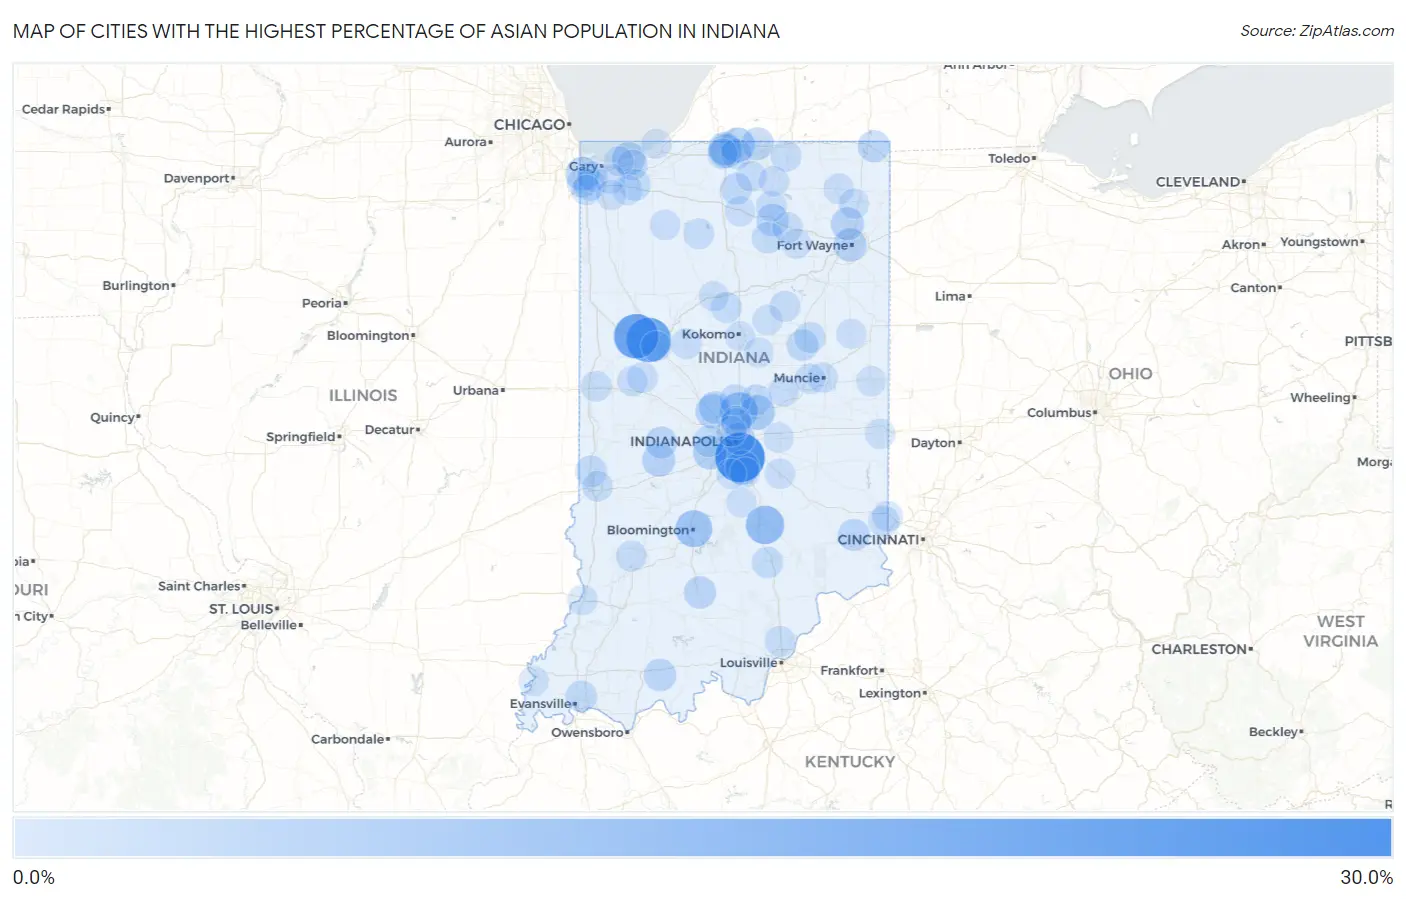
Map of Cities with the Highest Percentage of Asian Population in Indiana
0.0%
30.0%
Cities with the Highest Percentage of Asian Population in Indiana
| City | Asian | vs State | vs National | |
| 1. | Southport | 27.9% | 2.5%(+25.4)#1 | 5.8%(+22.1)#309 |
| 2. | West Lafayette | 21.1% | 2.5%(+18.6)#2 | 5.8%(+15.3)#487 |
| 3. | Montmorenci | 21.0% | 2.5%(+18.5)#3 | 5.8%(+15.2)#494 |
| 4. | New Lisbon | 17.5% | 2.5%(+15.1)#4 | 5.8%(+11.8)#664 |
| 5. | Grayford | 14.5% | 2.5%(+12.0)#5 | 5.8%(+8.74)#857 |
| 6. | Columbus | 12.7% | 2.5%(+10.2)#6 | 5.8%(+6.90)#1,035 |
| 7. | Carmel | 11.3% | 2.5%(+8.85)#7 | 5.8%(+5.57)#1,222 |
| 8. | Bloomington | 10.5% | 2.5%(+8.04)#8 | 5.8%(+4.76)#1,331 |
| 9. | Fishers | 7.9% | 2.5%(+5.37)#9 | 5.8%(+2.08)#1,844 |
| 10. | Granger | 7.5% | 2.5%(+5.05)#10 | 5.8%(+1.76)#1,923 |
| 11. | Greenwood | 6.7% | 2.5%(+4.21)#11 | 5.8%(+0.923)#2,196 |
| 12. | Munster | 6.6% | 2.5%(+4.07)#12 | 5.8%(+0.788)#2,242 |
| 13. | Whitestown | 6.5% | 2.5%(+4.05)#13 | 5.8%(+0.772)#2,253 |
| 14. | Plainfield | 6.5% | 2.5%(+3.96)#14 | 5.8%(+0.679)#2,282 |
| 15. | Notre Dame | 6.4% | 2.5%(+3.92)#15 | 5.8%(+0.633)#2,302 |
| 16. | Roseland | 6.0% | 2.5%(+3.56)#16 | 5.8%(+0.273)#2,448 |
| 17. | Dune Acres | 5.8% | 2.5%(+3.31)#17 | 5.8%(+0.029)#2,562 |
| 18. | Greencastle | 5.7% | 2.5%(+3.19)#18 | 5.8%(-0.096)#2,618 |
| 19. | Fort Wayne | 5.6% | 2.5%(+3.10)#19 | 5.8%(-0.185)#2,674 |
| 20. | Huntertown | 5.4% | 2.5%(+2.88)#20 | 5.8%(-0.404)#2,788 |
| 21. | Thayer | 5.1% | 2.5%(+2.61)#21 | 5.8%(-0.672)#2,936 |
| 22. | Duneland Beach | 5.0% | 2.5%(+2.48)#22 | 5.8%(-0.804)#3,002 |
| 23. | Zionsville | 4.8% | 2.5%(+2.32)#23 | 5.8%(-0.963)#3,086 |
| 24. | Simonton Lake | 4.8% | 2.5%(+2.30)#24 | 5.8%(-0.979)#3,098 |
| 25. | St Meinrad | 4.7% | 2.5%(+2.22)#25 | 5.8%(-1.07)#3,148 |
| 26. | Everton | 4.6% | 2.5%(+2.08)#26 | 5.8%(-1.20)#3,249 |
| 27. | Goldsmith | 4.6% | 2.5%(+2.08)#27 | 5.8%(-1.21)#3,255 |
| 28. | Warsaw | 4.5% | 2.5%(+2.00)#28 | 5.8%(-1.29)#3,319 |
| 29. | Mitchell | 4.5% | 2.5%(+1.97)#29 | 5.8%(-1.31)#3,342 |
| 30. | Bainbridge | 4.2% | 2.5%(+1.73)#30 | 5.8%(-1.55)#3,516 |
| 31. | Fremont | 4.2% | 2.5%(+1.70)#31 | 5.8%(-1.58)#3,540 |
| 32. | Indianapolis | 4.2% | 2.5%(+1.66)#32 | 5.8%(-1.62)#3,571 |
| 33. | Milan | 4.1% | 2.5%(+1.65)#33 | 5.8%(-1.63)#3,584 |
| 34. | Fowlerton | 3.7% | 2.5%(+1.16)#34 | 5.8%(-2.12)#3,985 |
| 35. | Bremen | 3.6% | 2.5%(+1.09)#35 | 5.8%(-2.19)#4,064 |
| 36. | Tecumseh | 3.5% | 2.5%(+1.01)#36 | 5.8%(-2.27)#4,135 |
| 37. | Avon | 3.5% | 2.5%(+0.999)#37 | 5.8%(-2.28)#4,151 |
| 38. | Schererville | 3.5% | 2.5%(+0.963)#38 | 5.8%(-2.32)#4,193 |
| 39. | Claypool | 3.4% | 2.5%(+0.949)#39 | 5.8%(-2.33)#4,210 |
| 40. | Valparaiso | 3.4% | 2.5%(+0.900)#40 | 5.8%(-2.38)#4,263 |
| 41. | Seymour | 3.3% | 2.5%(+0.832)#41 | 5.8%(-2.45)#4,339 |
| 42. | Melody Hill | 3.3% | 2.5%(+0.817)#42 | 5.8%(-2.47)#4,359 |
| 43. | Lake Bruce | 3.2% | 2.5%(+0.698)#43 | 5.8%(-2.59)#4,498 |
| 44. | Upland | 3.1% | 2.5%(+0.614)#44 | 5.8%(-2.67)#4,601 |
| 45. | Walton | 3.0% | 2.5%(+0.497)#45 | 5.8%(-2.79)#4,756 |
| 46. | Westfield | 3.0% | 2.5%(+0.494)#46 | 5.8%(-2.79)#4,764 |
| 47. | Noblesville | 2.8% | 2.5%(+0.317)#47 | 5.8%(-2.97)#5,001 |
| 48. | Meridian Hills | 2.7% | 2.5%(+0.204)#48 | 5.8%(-3.08)#5,159 |
| 49. | La Fontaine | 2.7% | 2.5%(+0.186)#49 | 5.8%(-3.10)#5,184 |
| 50. | Lyons | 2.6% | 2.5%(+0.129)#50 | 5.8%(-3.15)#5,270 |
| 51. | Bright | 2.6% | 2.5%(+0.122)#51 | 5.8%(-3.16)#5,282 |
| 52. | Chesterton | 2.6% | 2.5%(+0.104)#52 | 5.8%(-3.18)#5,312 |
| 53. | Mishawaka | 2.5% | 2.5%(+0.023)#53 | 5.8%(-3.26)#5,410 |
| 54. | Pierceton | 2.5% | 2.5%(-0.034)#54 | 5.8%(-3.32)#5,493 |
| 55. | Leesburg | 2.4% | 2.5%(-0.048)#55 | 5.8%(-3.33)#5,516 |
| 56. | Monterey | 2.4% | 2.5%(-0.094)#56 | 5.8%(-3.38)#5,599 |
| 57. | Sellersburg | 2.4% | 2.5%(-0.117)#57 | 5.8%(-3.40)#5,636 |
| 58. | Covington | 2.4% | 2.5%(-0.120)#58 | 5.8%(-3.40)#5,644 |
| 59. | Lafayette | 2.4% | 2.5%(-0.126)#59 | 5.8%(-3.41)#5,656 |
| 60. | Terre Haute | 2.3% | 2.5%(-0.145)#60 | 5.8%(-3.43)#5,687 |
| 61. | Rossville | 2.3% | 2.5%(-0.145)#61 | 5.8%(-3.43)#5,690 |
| 62. | Edgewood | 2.3% | 2.5%(-0.153)#62 | 5.8%(-3.44)#5,707 |
| 63. | Dyer | 2.3% | 2.5%(-0.161)#63 | 5.8%(-3.44)#5,726 |
| 64. | Middlebury | 2.3% | 2.5%(-0.178)#64 | 5.8%(-3.46)#5,755 |
| 65. | Wynnedale | 2.3% | 2.5%(-0.196)#65 | 5.8%(-3.48)#5,785 |
| 66. | Wakarusa | 2.3% | 2.5%(-0.199)#66 | 5.8%(-3.48)#5,789 |
| 67. | Griffith | 2.2% | 2.5%(-0.252)#67 | 5.8%(-3.54)#5,890 |
| 68. | Kendallville | 2.2% | 2.5%(-0.259)#68 | 5.8%(-3.54)#5,902 |
| 69. | New Richmond | 2.2% | 2.5%(-0.278)#69 | 5.8%(-3.56)#5,944 |
| 70. | Muncie | 2.2% | 2.5%(-0.278)#70 | 5.8%(-3.56)#5,945 |
| 71. | West Harrison | 2.2% | 2.5%(-0.316)#71 | 5.8%(-3.60)#6,010 |
| 72. | Yorktown | 2.2% | 2.5%(-0.327)#72 | 5.8%(-3.61)#6,038 |
| 73. | North Judson | 2.1% | 2.5%(-0.347)#73 | 5.8%(-3.63)#6,071 |
| 74. | New Paris | 2.1% | 2.5%(-0.365)#74 | 5.8%(-3.65)#6,111 |
| 75. | South Bend | 2.0% | 2.5%(-0.450)#75 | 5.8%(-3.73)#6,294 |
| 76. | Bourbon | 2.0% | 2.5%(-0.486)#76 | 5.8%(-3.77)#6,366 |
| 77. | Williams Creek | 2.0% | 2.5%(-0.490)#77 | 5.8%(-3.77)#6,378 |
| 78. | Wingate | 2.0% | 2.5%(-0.496)#78 | 5.8%(-3.78)#6,398 |
| 79. | Hobart | 2.0% | 2.5%(-0.508)#79 | 5.8%(-3.79)#6,423 |
| 80. | Converse | 2.0% | 2.5%(-0.525)#80 | 5.8%(-3.81)#6,458 |
| 81. | Shelbyville | 1.9% | 2.5%(-0.594)#81 | 5.8%(-3.88)#6,601 |
| 82. | Garrett | 1.9% | 2.5%(-0.609)#82 | 5.8%(-3.89)#6,635 |
| 83. | Aberdeen | 1.8% | 2.5%(-0.667)#83 | 5.8%(-3.95)#6,759 |
| 84. | Winfield | 1.8% | 2.5%(-0.675)#84 | 5.8%(-3.96)#6,784 |
| 85. | Whiteland | 1.8% | 2.5%(-0.713)#85 | 5.8%(-4.00)#6,874 |
| 86. | Logansport | 1.8% | 2.5%(-0.717)#86 | 5.8%(-4.00)#6,884 |
| 87. | Greenfield | 1.8% | 2.5%(-0.728)#87 | 5.8%(-4.01)#6,914 |
| 88. | Winchester | 1.7% | 2.5%(-0.749)#88 | 5.8%(-4.03)#6,955 |
| 89. | Richmond | 1.7% | 2.5%(-0.753)#89 | 5.8%(-4.04)#6,969 |
| 90. | Prince S Lakes | 1.7% | 2.5%(-0.765)#90 | 5.8%(-4.05)#6,998 |
| 91. | New Harmony | 1.7% | 2.5%(-0.793)#91 | 5.8%(-4.08)#7,074 |
| 92. | Vincennes | 1.7% | 2.5%(-0.808)#92 | 5.8%(-4.09)#7,116 |
| 93. | St John | 1.7% | 2.5%(-0.811)#93 | 5.8%(-4.09)#7,129 |
| 94. | South Whitley | 1.6% | 2.5%(-0.840)#94 | 5.8%(-4.12)#7,198 |
| 95. | Kokomo | 1.6% | 2.5%(-0.842)#95 | 5.8%(-4.12)#7,204 |
| 96. | Ogden Dunes | 1.6% | 2.5%(-0.849)#96 | 5.8%(-4.13)#7,223 |
| 97. | Windfall City | 1.6% | 2.5%(-0.868)#97 | 5.8%(-4.15)#7,274 |
| 98. | Bargersville | 1.6% | 2.5%(-0.872)#98 | 5.8%(-4.15)#7,283 |
| 99. | Pennville | 1.6% | 2.5%(-0.879)#99 | 5.8%(-4.16)#7,300 |
| 100. | Long Beach | 1.6% | 2.5%(-0.885)#100 | 5.8%(-4.17)#7,326 |
Common Questions
What are the Top 10 Cities with the Highest Percentage of Asian Population in Indiana?
Top 10 Cities with the Highest Percentage of Asian Population in Indiana are:
#1
27.9%
#2
21.1%
#3
21.0%
#4
12.7%
#5
11.3%
#6
10.5%
#7
7.9%
#8
7.5%
#9
6.7%
#10
6.6%
What city has the Highest Percentage of Asian Population in Indiana?
Southport has the Highest Percentage of Asian Population in Indiana with 27.9%.
What is the Percentage of Asian Population in the State of Indiana?
Percentage of Asian Population in Indiana is 2.5%.
What is the Percentage of Asian Population in the United States?
Percentage of Asian Population in the United States is 5.8%.