Cities with the Highest Percentage of Asian Population in Delaware
RELATED REPORTS & OPTIONS
Asian
Delaware
Compare Cities
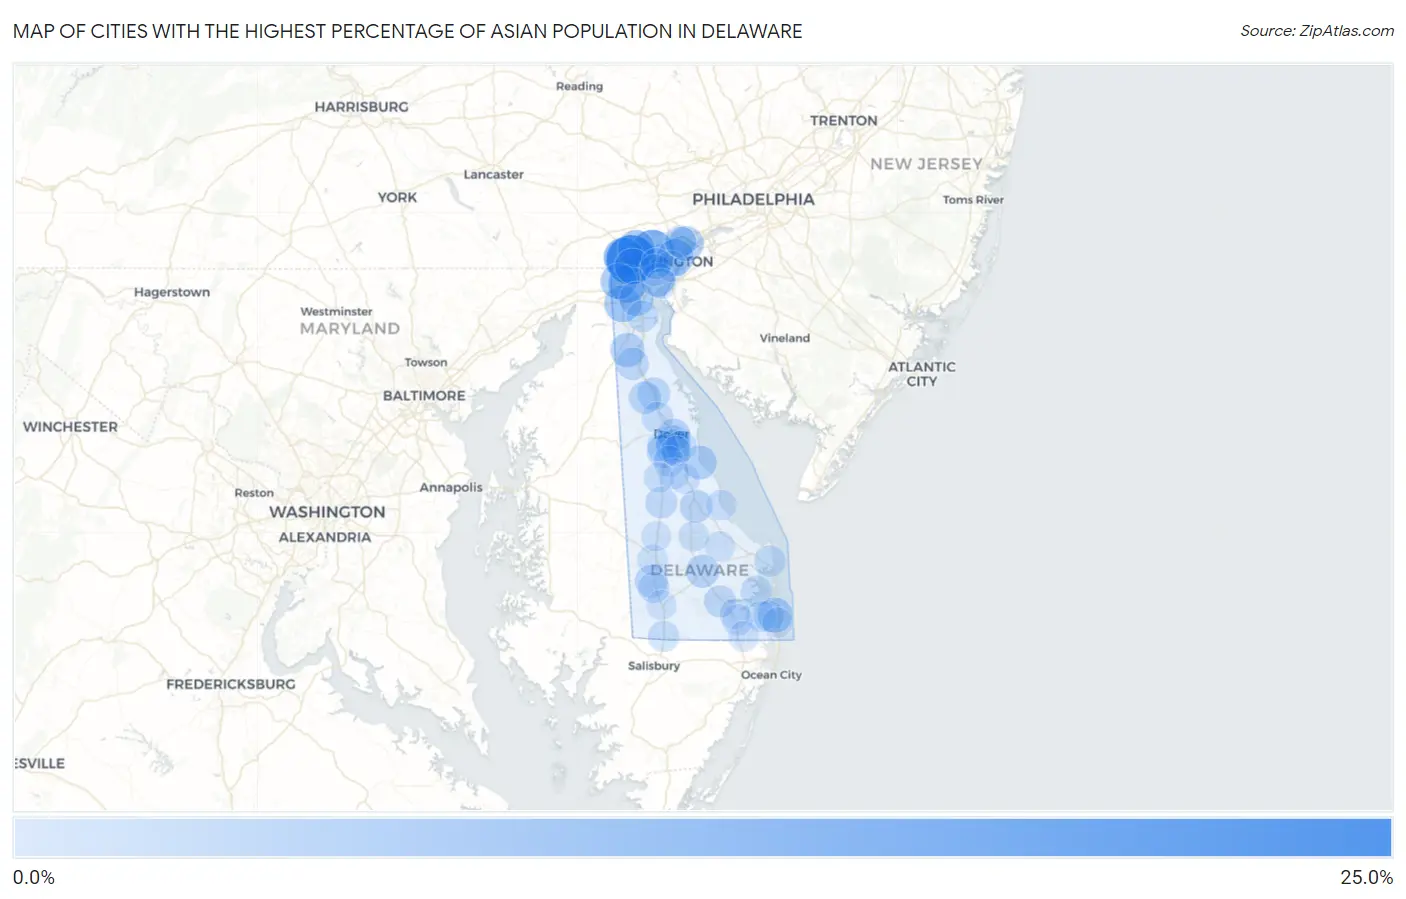
Map of Cities with the Highest Percentage of Asian Population in Delaware
0.0%
25.0%
Cities with the Highest Percentage of Asian Population in Delaware
| City | Asian | vs State | vs National | |
| 1. | Pike Creek | 24.3% | 4.1%(+20.3)#1 | 5.8%(+18.6)#402 |
| 2. | Greenville | 15.8% | 4.1%(+11.7)#2 | 5.8%(+9.99)#784 |
| 3. | North Star | 12.2% | 4.1%(+8.16)#3 | 5.8%(+6.47)#1,085 |
| 4. | Brookside | 9.7% | 4.1%(+5.60)#4 | 5.8%(+3.91)#1,477 |
| 5. | Hockessin | 8.7% | 4.1%(+4.64)#5 | 5.8%(+2.95)#1,660 |
| 6. | Edgemoor | 8.3% | 4.1%(+4.20)#6 | 5.8%(+2.51)#1,747 |
| 7. | Glasgow | 7.8% | 4.1%(+3.68)#7 | 5.8%(+1.99)#1,868 |
| 8. | Newark | 7.5% | 4.1%(+3.37)#8 | 5.8%(+1.68)#1,948 |
| 9. | Pike Creek Valley | 6.7% | 4.1%(+2.61)#9 | 5.8%(+0.916)#2,201 |
| 10. | Claymont | 5.9% | 4.1%(+1.78)#10 | 5.8%(+0.095)#2,533 |
| 11. | Bethany Beach | 5.8% | 4.1%(+1.74)#11 | 5.8%(+0.054)#2,554 |
| 12. | Bear | 5.1% | 4.1%(+1.07)#12 | 5.8%(-0.623)#2,920 |
| 13. | Middletown | 5.0% | 4.1%(+0.940)#13 | 5.8%(-0.750)#2,976 |
| 14. | Wilmington Manor | 4.7% | 4.1%(+0.626)#14 | 5.8%(-1.06)#3,145 |
| 15. | Kent Acres | 4.6% | 4.1%(+0.484)#15 | 5.8%(-1.21)#3,253 |
| 16. | Highland Acres | 4.5% | 4.1%(+0.388)#16 | 5.8%(-1.30)#3,331 |
| 17. | Bowers | 4.5% | 4.1%(+0.381)#17 | 5.8%(-1.31)#3,336 |
| 18. | Camden | 3.8% | 4.1%(-0.302)#18 | 5.8%(-1.99)#3,877 |
| 19. | Georgetown | 3.5% | 4.1%(-0.578)#19 | 5.8%(-2.27)#4,134 |
| 20. | Milford | 3.3% | 4.1%(-0.822)#20 | 5.8%(-2.51)#4,396 |
| 21. | Dover | 3.2% | 4.1%(-0.860)#21 | 5.8%(-2.55)#4,456 |
| 22. | Seaford | 3.1% | 4.1%(-0.954)#22 | 5.8%(-2.64)#4,566 |
| 23. | Smyrna | 2.9% | 4.1%(-1.15)#23 | 5.8%(-2.84)#4,816 |
| 24. | Townsend | 2.9% | 4.1%(-1.22)#24 | 5.8%(-2.91)#4,927 |
| 25. | Clayton | 2.7% | 4.1%(-1.39)#25 | 5.8%(-3.08)#5,170 |
| 26. | Millsboro | 2.3% | 4.1%(-1.77)#26 | 5.8%(-3.46)#5,754 |
| 27. | Harrington | 2.0% | 4.1%(-2.07)#27 | 5.8%(-3.76)#6,334 |
| 28. | Newport | 1.9% | 4.1%(-2.16)#28 | 5.8%(-3.85)#6,548 |
| 29. | Cheswold | 1.8% | 4.1%(-2.25)#29 | 5.8%(-3.94)#6,742 |
| 30. | St Georges | 1.8% | 4.1%(-2.32)#30 | 5.8%(-4.01)#6,908 |
| 31. | Arden | 1.5% | 4.1%(-2.55)#31 | 5.8%(-4.24)#7,530 |
| 32. | Wyoming | 1.4% | 4.1%(-2.65)#32 | 5.8%(-4.34)#7,850 |
| 33. | Rehoboth Beach | 1.4% | 4.1%(-2.68)#33 | 5.8%(-4.37)#7,946 |
| 34. | Wilmington | 1.3% | 4.1%(-2.75)#34 | 5.8%(-4.44)#8,144 |
| 35. | Elsmere | 1.3% | 4.1%(-2.81)#35 | 5.8%(-4.50)#8,369 |
| 36. | Ocean View | 1.2% | 4.1%(-2.84)#36 | 5.8%(-4.53)#8,498 |
| 37. | Long Neck | 1.2% | 4.1%(-2.84)#37 | 5.8%(-4.53)#8,499 |
| 38. | Delmar | 1.2% | 4.1%(-2.92)#38 | 5.8%(-4.60)#8,728 |
| 39. | Blades | 1.1% | 4.1%(-2.94)#39 | 5.8%(-4.63)#8,808 |
| 40. | Dover Base Housing | 1.1% | 4.1%(-2.95)#40 | 5.8%(-4.64)#8,844 |
| 41. | Millville | 1.1% | 4.1%(-3.01)#41 | 5.8%(-4.70)#9,055 |
| 42. | Frankford | 0.95% | 4.1%(-3.13)#42 | 5.8%(-4.82)#9,541 |
| 43. | Woodside East | 0.95% | 4.1%(-3.13)#43 | 5.8%(-4.82)#9,549 |
| 44. | Ardentown | 0.90% | 4.1%(-3.19)#44 | 5.8%(-4.88)#9,773 |
| 45. | Riverview | 0.84% | 4.1%(-3.25)#45 | 5.8%(-4.94)#10,007 |
| 46. | Dagsboro | 0.60% | 4.1%(-3.49)#46 | 5.8%(-5.17)#11,178 |
| 47. | Slaughter Beach | 0.51% | 4.1%(-3.57)#47 | 5.8%(-5.26)#11,678 |
| 48. | Bridgeville | 0.46% | 4.1%(-3.62)#48 | 5.8%(-5.31)#11,965 |
| 49. | Rising Sun Lebanon | 0.39% | 4.1%(-3.69)#49 | 5.8%(-5.38)#12,370 |
| 50. | Selbyville | 0.38% | 4.1%(-3.70)#50 | 5.8%(-5.39)#12,493 |
| 51. | Ellendale | 0.33% | 4.1%(-3.75)#51 | 5.8%(-5.44)#12,802 |
| 52. | New Castle | 0.31% | 4.1%(-3.78)#52 | 5.8%(-5.46)#12,937 |
| 53. | Felton | 0.26% | 4.1%(-3.82)#53 | 5.8%(-5.51)#13,236 |
| 54. | South Bethany | 0.20% | 4.1%(-3.88)#54 | 5.8%(-5.57)#13,613 |
| 55. | Frederica | 0.20% | 4.1%(-3.88)#55 | 5.8%(-5.57)#13,640 |
| 56. | Greenwood | 0.13% | 4.1%(-3.95)#56 | 5.8%(-5.64)#14,078 |
| 57. | Milton | 0.060% | 4.1%(-4.02)#57 | 5.8%(-5.71)#14,406 |
| 58. | Laurel | 0.025% | 4.1%(-4.06)#58 | 5.8%(-5.75)#14,509 |
1
Common Questions
What are the Top 10 Cities with the Highest Percentage of Asian Population in Delaware?
Top 10 Cities with the Highest Percentage of Asian Population in Delaware are:
#1
24.3%
#2
15.8%
#3
12.2%
#4
9.7%
#5
8.7%
#6
8.3%
#7
7.8%
#8
7.5%
#9
6.7%
#10
5.9%
What city has the Highest Percentage of Asian Population in Delaware?
Pike Creek has the Highest Percentage of Asian Population in Delaware with 24.3%.
What is the Percentage of Asian Population in the State of Delaware?
Percentage of Asian Population in Delaware is 4.1%.
What is the Percentage of Asian Population in the United States?
Percentage of Asian Population in the United States is 5.8%.