Cities with the Highest Percentage of Asian Population in Texas
RELATED REPORTS & OPTIONS
Asian
Texas
Compare Cities
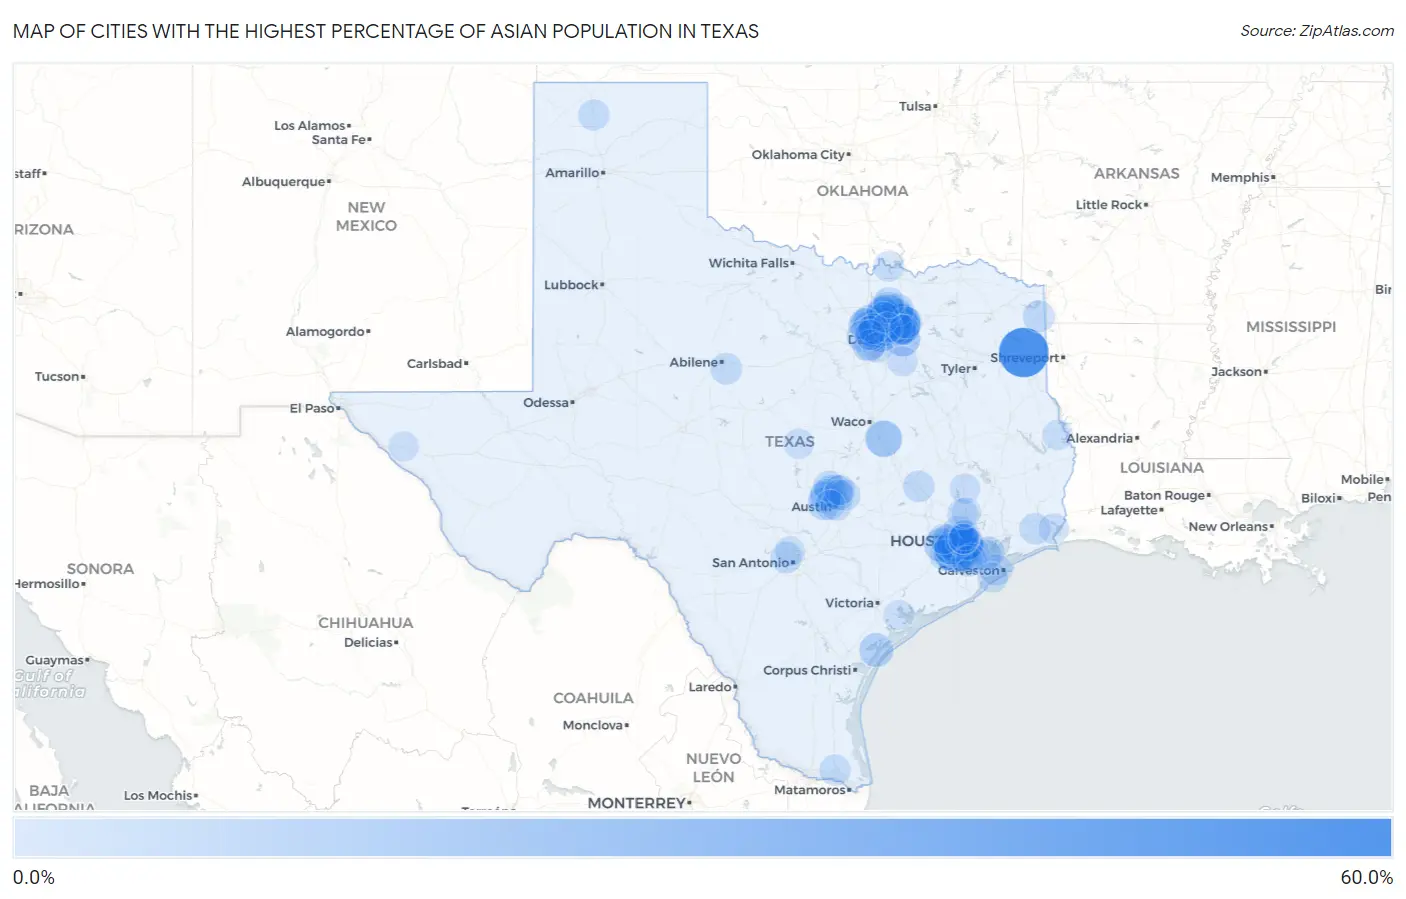
Map of Cities with the Highest Percentage of Asian Population in Texas
0.0%
60.0%
Cities with the Highest Percentage of Asian Population in Texas
| City | Asian | vs State | vs National | |
| 1. | Nesbitt | 57.6% | 5.2%(+52.5)#1 | 5.8%(+51.8)#42 |
| 2. | Sugar Land | 38.5% | 5.2%(+33.3)#2 | 5.8%(+32.7)#160 |
| 3. | Hebron | 34.6% | 5.2%(+29.4)#3 | 5.8%(+28.8)#204 |
| 4. | Murphy | 33.9% | 5.2%(+28.8)#4 | 5.8%(+28.2)#209 |
| 5. | Coppell | 31.1% | 5.2%(+25.9)#5 | 5.8%(+25.3)#254 |
| 6. | Four Corners | 29.3% | 5.2%(+24.1)#6 | 5.8%(+23.5)#291 |
| 7. | Stafford | 25.8% | 5.2%(+20.6)#7 | 5.8%(+20.0)#359 |
| 8. | Frisco | 25.5% | 5.2%(+20.3)#8 | 5.8%(+19.7)#367 |
| 9. | Plano | 22.7% | 5.2%(+17.5)#9 | 5.8%(+16.9)#435 |
| 10. | Irving | 22.3% | 5.2%(+17.1)#10 | 5.8%(+16.5)#455 |
| 11. | Marlin | 22.1% | 5.2%(+17.0)#11 | 5.8%(+16.4)#459 |
| 12. | Meadows Place | 21.6% | 5.2%(+16.4)#12 | 5.8%(+15.8)#471 |
| 13. | Bellaire | 21.2% | 5.2%(+16.0)#13 | 5.8%(+15.4)#485 |
| 14. | Sunnyvale | 20.0% | 5.2%(+14.8)#14 | 5.8%(+14.2)#535 |
| 15. | Sachse | 19.1% | 5.2%(+13.9)#15 | 5.8%(+13.3)#579 |
| 16. | Allen | 19.0% | 5.2%(+13.9)#16 | 5.8%(+13.3)#582 |
| 17. | Parker | 18.7% | 5.2%(+13.6)#17 | 5.8%(+13.0)#593 |
| 18. | Hedwig Village | 17.8% | 5.2%(+12.7)#18 | 5.8%(+12.1)#642 |
| 19. | Missouri City | 17.8% | 5.2%(+12.6)#19 | 5.8%(+12.0)#651 |
| 20. | Southlake | 17.0% | 5.2%(+11.8)#20 | 5.8%(+11.2)#701 |
| 21. | Fulshear | 16.7% | 5.2%(+11.5)#21 | 5.8%(+10.9)#725 |
| 22. | Fulton | 16.0% | 5.2%(+10.8)#22 | 5.8%(+10.2)#766 |
| 23. | Pearland | 15.9% | 5.2%(+10.7)#23 | 5.8%(+10.1)#772 |
| 24. | Carrollton | 15.5% | 5.2%(+10.3)#24 | 5.8%(+9.70)#800 |
| 25. | Richardson | 15.5% | 5.2%(+10.3)#25 | 5.8%(+9.70)#801 |
| 26. | Cinco Ranch | 14.4% | 5.2%(+9.22)#26 | 5.8%(+8.61)#868 |
| 27. | Mission Bend | 14.3% | 5.2%(+9.15)#27 | 5.8%(+8.55)#873 |
| 28. | Southside Place | 14.1% | 5.2%(+8.97)#28 | 5.8%(+8.36)#886 |
| 29. | Lewisville | 13.9% | 5.2%(+8.76)#29 | 5.8%(+8.15)#905 |
| 30. | Dalworthington Gardens | 13.5% | 5.2%(+8.37)#30 | 5.8%(+7.77)#949 |
| 31. | Flower Mound | 13.5% | 5.2%(+8.37)#31 | 5.8%(+7.77)#951 |
| 32. | Euless | 12.9% | 5.2%(+7.75)#32 | 5.8%(+7.15)#1,019 |
| 33. | Cedar Park | 12.6% | 5.2%(+7.48)#33 | 5.8%(+6.88)#1,040 |
| 34. | Bee Cave | 12.5% | 5.2%(+7.36)#34 | 5.8%(+6.76)#1,052 |
| 35. | Piney Point Village | 12.5% | 5.2%(+7.32)#35 | 5.8%(+6.72)#1,058 |
| 36. | Hackberry | 12.3% | 5.2%(+7.13)#36 | 5.8%(+6.53)#1,082 |
| 37. | Brushy Creek | 12.2% | 5.2%(+7.07)#37 | 5.8%(+6.47)#1,089 |
| 38. | Mckinney | 12.0% | 5.2%(+6.79)#38 | 5.8%(+6.19)#1,126 |
| 39. | Westlake | 11.8% | 5.2%(+6.68)#39 | 5.8%(+6.07)#1,141 |
| 40. | Petronilla | 11.6% | 5.2%(+6.43)#40 | 5.8%(+5.82)#1,171 |
| 41. | Steiner Ranch | 11.5% | 5.2%(+6.33)#41 | 5.8%(+5.72)#1,195 |
| 42. | Hudson Bend | 11.1% | 5.2%(+5.89)#42 | 5.8%(+5.28)#1,258 |
| 43. | West University Place | 11.0% | 5.2%(+5.82)#43 | 5.8%(+5.21)#1,268 |
| 44. | El Lago | 10.9% | 5.2%(+5.72)#44 | 5.8%(+5.12)#1,280 |
| 45. | Garland | 10.9% | 5.2%(+5.72)#45 | 5.8%(+5.12)#1,281 |
| 46. | Volente | 10.8% | 5.2%(+5.62)#46 | 5.8%(+5.01)#1,297 |
| 47. | Farmers Branch | 10.7% | 5.2%(+5.55)#47 | 5.8%(+4.95)#1,306 |
| 48. | Roanoke | 10.6% | 5.2%(+5.48)#48 | 5.8%(+4.87)#1,322 |
| 49. | Atlanta | 10.5% | 5.2%(+5.29)#49 | 5.8%(+4.68)#1,340 |
| 50. | Bunker Hill Village | 10.3% | 5.2%(+5.15)#50 | 5.8%(+4.54)#1,365 |
| 51. | Sienna | 10.2% | 5.2%(+5.07)#51 | 5.8%(+4.47)#1,379 |
| 52. | Haltom City | 10.0% | 5.2%(+4.82)#52 | 5.8%(+4.21)#1,413 |
| 53. | College Station | 9.9% | 5.2%(+4.76)#53 | 5.8%(+4.15)#1,426 |
| 54. | Leon Valley | 9.9% | 5.2%(+4.75)#54 | 5.8%(+4.14)#1,429 |
| 55. | Little Elm | 9.9% | 5.2%(+4.73)#55 | 5.8%(+4.12)#1,433 |
| 56. | Potosi | 9.9% | 5.2%(+4.71)#56 | 5.8%(+4.11)#1,437 |
| 57. | Wylie | 9.9% | 5.2%(+4.71)#57 | 5.8%(+4.11)#1,438 |
| 58. | Prosper | 9.8% | 5.2%(+4.63)#58 | 5.8%(+4.03)#1,451 |
| 59. | Tiki Island | 9.8% | 5.2%(+4.62)#59 | 5.8%(+4.01)#1,457 |
| 60. | Fannett | 9.4% | 5.2%(+4.19)#60 | 5.8%(+3.59)#1,530 |
| 61. | Jersey Village | 9.2% | 5.2%(+4.03)#61 | 5.8%(+3.42)#1,557 |
| 62. | Mcleod | 9.1% | 5.2%(+3.89)#62 | 5.8%(+3.29)#1,588 |
| 63. | Rosenberg | 9.0% | 5.2%(+3.85)#63 | 5.8%(+3.25)#1,596 |
| 64. | Cactus | 9.0% | 5.2%(+3.80)#64 | 5.8%(+3.20)#1,610 |
| 65. | Palm Valley | 8.8% | 5.2%(+3.68)#65 | 5.8%(+3.08)#1,637 |
| 66. | Pecan Grove | 8.8% | 5.2%(+3.65)#66 | 5.8%(+3.04)#1,645 |
| 67. | Leander | 8.6% | 5.2%(+3.40)#67 | 5.8%(+2.80)#1,687 |
| 68. | Nassau Bay | 8.5% | 5.2%(+3.37)#68 | 5.8%(+2.76)#1,693 |
| 69. | Austin | 8.4% | 5.2%(+3.21)#69 | 5.8%(+2.60)#1,723 |
| 70. | Pflugerville | 8.3% | 5.2%(+3.17)#70 | 5.8%(+2.57)#1,731 |
| 71. | Wells Branch | 8.2% | 5.2%(+3.04)#71 | 5.8%(+2.43)#1,760 |
| 72. | The Colony | 8.2% | 5.2%(+3.02)#72 | 5.8%(+2.41)#1,766 |
| 73. | Hilshire Village | 8.0% | 5.2%(+2.84)#73 | 5.8%(+2.23)#1,811 |
| 74. | Celina | 8.0% | 5.2%(+2.80)#74 | 5.8%(+2.19)#1,819 |
| 75. | Iowa Colony | 7.9% | 5.2%(+2.73)#75 | 5.8%(+2.12)#1,837 |
| 76. | Sherwood Shores | 7.8% | 5.2%(+2.67)#76 | 5.8%(+2.07)#1,849 |
| 77. | Colleyville | 7.5% | 5.2%(+2.35)#77 | 5.8%(+1.74)#1,932 |
| 78. | Manvel | 7.5% | 5.2%(+2.33)#78 | 5.8%(+1.73)#1,934 |
| 79. | Groves | 7.3% | 5.2%(+2.17)#79 | 5.8%(+1.57)#1,982 |
| 80. | The Woodlands | 7.3% | 5.2%(+2.10)#80 | 5.8%(+1.49)#2,003 |
| 81. | Arlington | 7.3% | 5.2%(+2.08)#81 | 5.8%(+1.48)#2,006 |
| 82. | Addison | 7.2% | 5.2%(+2.03)#82 | 5.8%(+1.43)#2,019 |
| 83. | Lometa | 7.2% | 5.2%(+2.00)#83 | 5.8%(+1.40)#2,033 |
| 84. | Rowlett | 7.1% | 5.2%(+1.93)#84 | 5.8%(+1.32)#2,055 |
| 85. | Katy | 7.0% | 5.2%(+1.87)#85 | 5.8%(+1.27)#2,072 |
| 86. | New Waverly | 7.0% | 5.2%(+1.82)#86 | 5.8%(+1.21)#2,095 |
| 87. | Bristol | 6.9% | 5.2%(+1.77)#87 | 5.8%(+1.16)#2,116 |
| 88. | Houston | 6.9% | 5.2%(+1.71)#88 | 5.8%(+1.11)#2,135 |
| 89. | Grand Prairie | 6.9% | 5.2%(+1.68)#89 | 5.8%(+1.08)#2,147 |
| 90. | Grapevine | 6.8% | 5.2%(+1.62)#90 | 5.8%(+1.01)#2,172 |
| 91. | Hemphill | 6.7% | 5.2%(+1.50)#91 | 5.8%(+0.899)#2,209 |
| 92. | Round Rock | 6.7% | 5.2%(+1.50)#92 | 5.8%(+0.895)#2,212 |
| 93. | Jamaica Beach | 6.6% | 5.2%(+1.45)#93 | 5.8%(+0.846)#2,226 |
| 94. | Port Lavaca | 6.5% | 5.2%(+1.33)#94 | 5.8%(+0.724)#2,267 |
| 95. | Lost Creek | 6.3% | 5.2%(+1.13)#95 | 5.8%(+0.526)#2,345 |
| 96. | Bedford | 6.3% | 5.2%(+1.09)#96 | 5.8%(+0.484)#2,363 |
| 97. | Spring Valley Village | 6.3% | 5.2%(+1.09)#97 | 5.8%(+0.480)#2,365 |
| 98. | Sierra Blanca | 6.2% | 5.2%(+1.08)#98 | 5.8%(+0.477)#2,367 |
| 99. | Shavano Park | 6.2% | 5.2%(+1.07)#99 | 5.8%(+0.463)#2,376 |
| 100. | Shenandoah | 6.2% | 5.2%(+1.01)#100 | 5.8%(+0.404)#2,394 |
Common Questions
What are the Top 10 Cities with the Highest Percentage of Asian Population in Texas?
Top 10 Cities with the Highest Percentage of Asian Population in Texas are:
#1
57.6%
#2
38.5%
#3
34.6%
#4
33.9%
#5
31.1%
#6
29.3%
#7
25.8%
#8
25.5%
#9
22.7%
#10
22.3%
What city has the Highest Percentage of Asian Population in Texas?
Nesbitt has the Highest Percentage of Asian Population in Texas with 57.6%.
What is the Percentage of Asian Population in the State of Texas?
Percentage of Asian Population in Texas is 5.2%.
What is the Percentage of Asian Population in the United States?
Percentage of Asian Population in the United States is 5.8%.