Weston, NJ Map & Demographics
Weston Map
Weston Overview
$63,867
PER CAPITA INCOME
$121,653
AVG FAMILY INCOME
$87,417
AVG HOUSEHOLD INCOME
0.41
INEQUALITY / GINI INDEX
2,144
TOTAL POPULATION
675
MALE POPULATION
1,469
FEMALE POPULATION
45.95
MALES / 100 FEMALES
217.63
FEMALES / 100 MALES
71.5
MEDIAN AGE
2.3
AVG FAMILY SIZE
1.8
AVG HOUSEHOLD SIZE
656
LABOR FORCE [ PEOPLE ]
30.6%
PERCENT IN LABOR FORCE
4.7%
UNEMPLOYMENT RATE
Income in Weston
Income Overview in Weston
Per Capita Income in Weston is $63,867, while median incomes of families and households are $121,653 and $87,417 respectively.
| Characteristic | Number | Measure |
| Per Capita Income | 2,144 | $63,867 |
| Median Family Income | 703 | $121,653 |
| Mean Family Income | 703 | $150,537 |
| Median Household Income | 1,203 | $87,417 |
| Mean Household Income | 1,203 | $111,909 |
| Income Deficit | 703 | $0 |
| Wage / Income Gap (%) | 2,144 | 0.00% |
| Wage / Income Gap ($) | 2,144 | 100.00¢ per $1 |
| Gini / Inequality Index | 2,144 | 0.41 |
Earnings by Sex in Weston
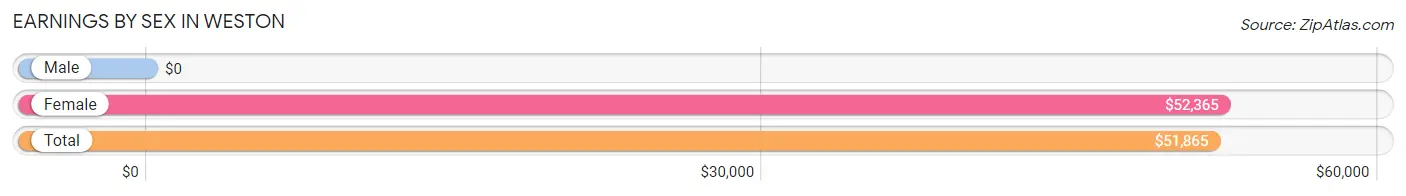
| Sex | Number | Average Earnings |
| Male | 296 (38.8%) | $0 |
| Female | 467 (61.2%) | $52,365 |
| Total | 763 (100.0%) | $51,865 |
Earnings by Sex by Income Bracket in Weston
The most common earnings brackets in Weston are $100,000+ for men (99 | 33.5%) and $100,000+ for women (115 | 24.6%).
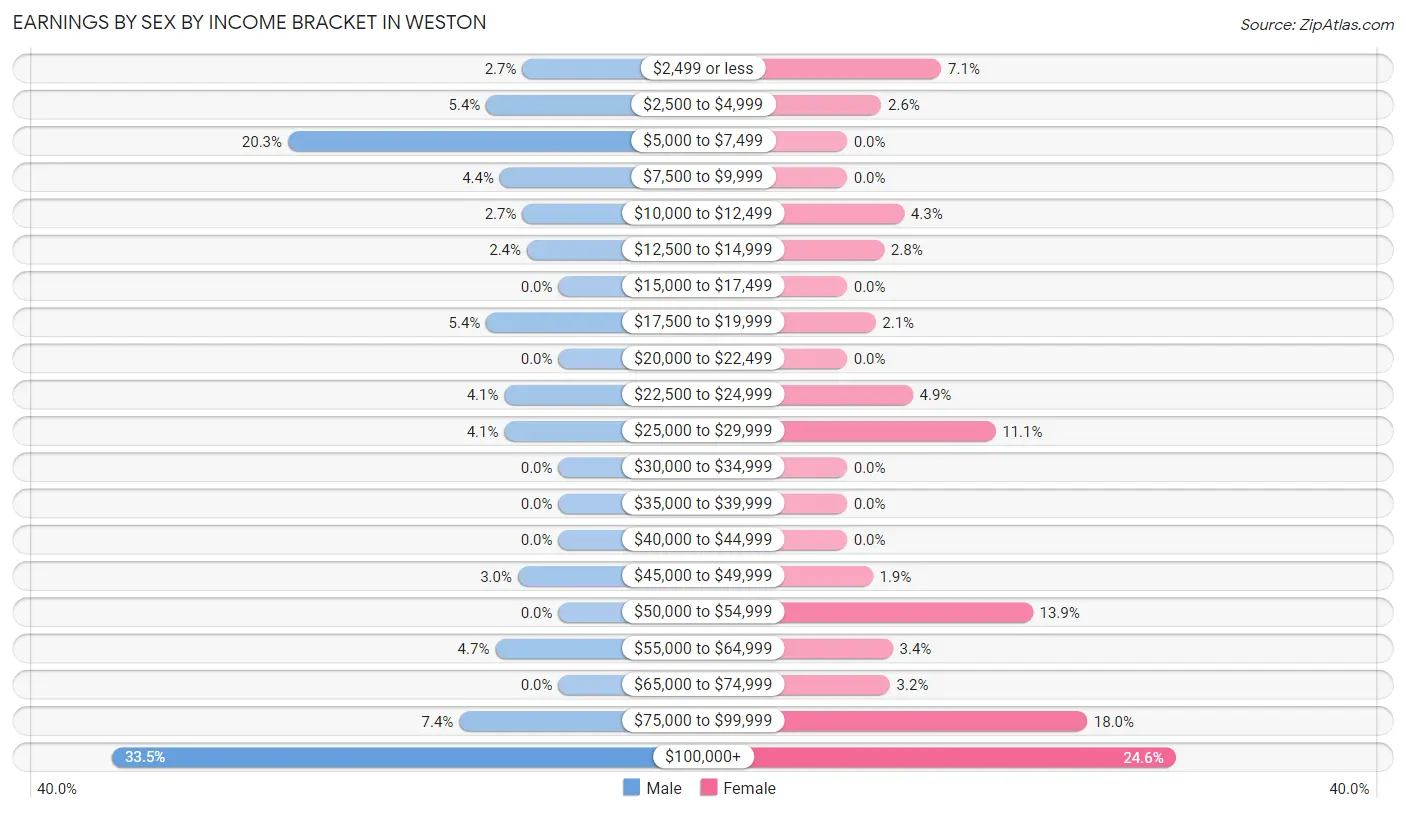
| Income | Male | Female |
| $2,499 or less | 8 (2.7%) | 33 (7.1%) |
| $2,500 to $4,999 | 16 (5.4%) | 12 (2.6%) |
| $5,000 to $7,499 | 60 (20.3%) | 0 (0.0%) |
| $7,500 to $9,999 | 13 (4.4%) | 0 (0.0%) |
| $10,000 to $12,499 | 8 (2.7%) | 20 (4.3%) |
| $12,500 to $14,999 | 7 (2.4%) | 13 (2.8%) |
| $15,000 to $17,499 | 0 (0.0%) | 0 (0.0%) |
| $17,500 to $19,999 | 16 (5.4%) | 10 (2.1%) |
| $20,000 to $22,499 | 0 (0.0%) | 0 (0.0%) |
| $22,500 to $24,999 | 12 (4.1%) | 23 (4.9%) |
| $25,000 to $29,999 | 12 (4.1%) | 52 (11.1%) |
| $30,000 to $34,999 | 0 (0.0%) | 0 (0.0%) |
| $35,000 to $39,999 | 0 (0.0%) | 0 (0.0%) |
| $40,000 to $44,999 | 0 (0.0%) | 0 (0.0%) |
| $45,000 to $49,999 | 9 (3.0%) | 9 (1.9%) |
| $50,000 to $54,999 | 0 (0.0%) | 65 (13.9%) |
| $55,000 to $64,999 | 14 (4.7%) | 16 (3.4%) |
| $65,000 to $74,999 | 0 (0.0%) | 15 (3.2%) |
| $75,000 to $99,999 | 22 (7.4%) | 84 (18.0%) |
| $100,000+ | 99 (33.5%) | 115 (24.6%) |
| Total | 296 (100.0%) | 467 (100.0%) |
Earnings by Sex by Educational Attainment in Weston
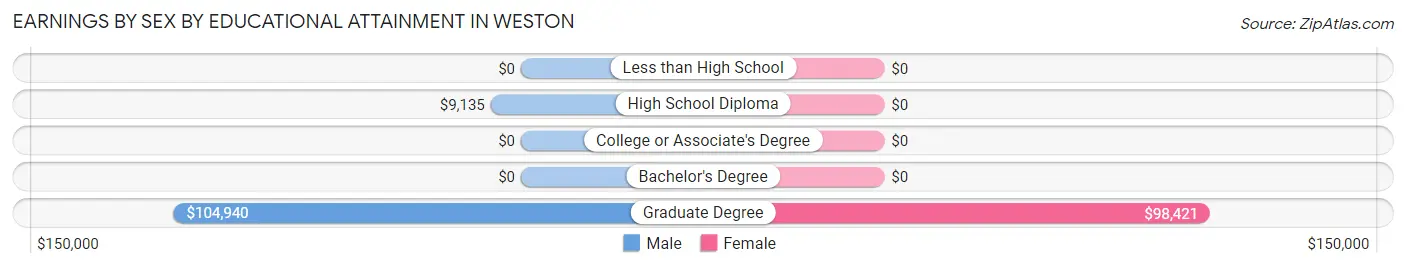
| Educational Attainment | Male Income | Female Income |
| Less than High School | - | - |
| High School Diploma | $9,135 | $0 |
| College or Associate's Degree | - | - |
| Bachelor's Degree | - | - |
| Graduate Degree | $104,940 | $98,421 |
| Total | - | - |
Family Income in Weston
Family Income Brackets in Weston
According to the Weston family income data, there are 202 families falling into the $200,000+ income range, which is the most common income bracket and makes up 28.7% of all families.
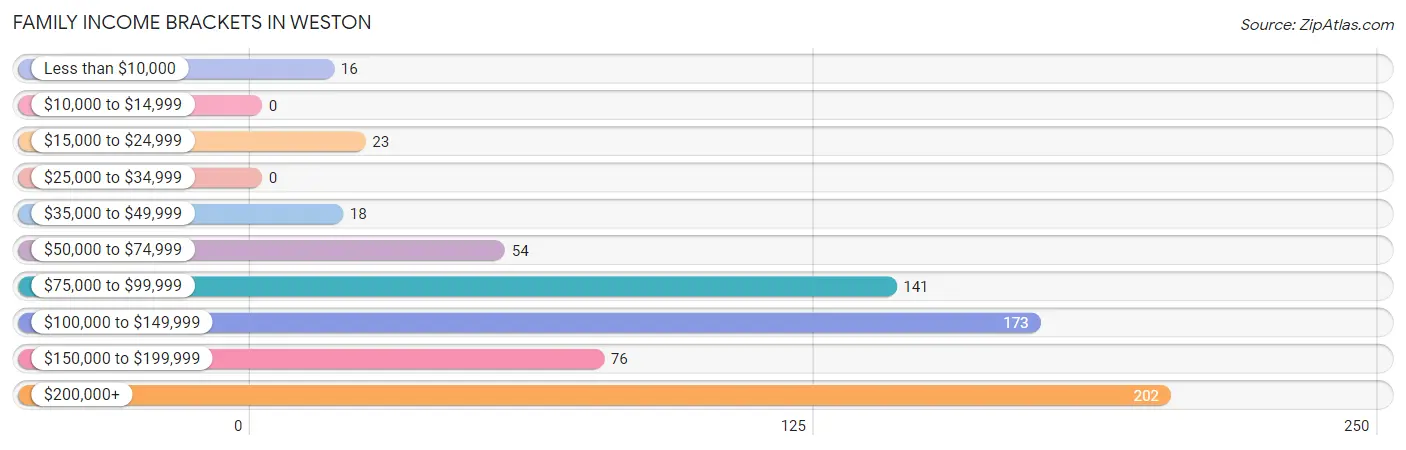
| Income Bracket | # Families | % Families |
| Less than $10,000 | 16 | 2.3% |
| $10,000 to $14,999 | 0 | 0.0% |
| $15,000 to $24,999 | 23 | 3.3% |
| $25,000 to $34,999 | 0 | 0.0% |
| $35,000 to $49,999 | 18 | 2.6% |
| $50,000 to $74,999 | 54 | 7.7% |
| $75,000 to $99,999 | 141 | 20.1% |
| $100,000 to $149,999 | 173 | 24.6% |
| $150,000 to $199,999 | 76 | 10.8% |
| $200,000+ | 202 | 28.7% |
Family Income by Famaliy Size in Weston
3-person families (54 | 7.7%) account for the highest median family income in Weston with $178,846 per family, while 3-person families (54 | 7.7%) have the highest median income of $59,615 per family member.
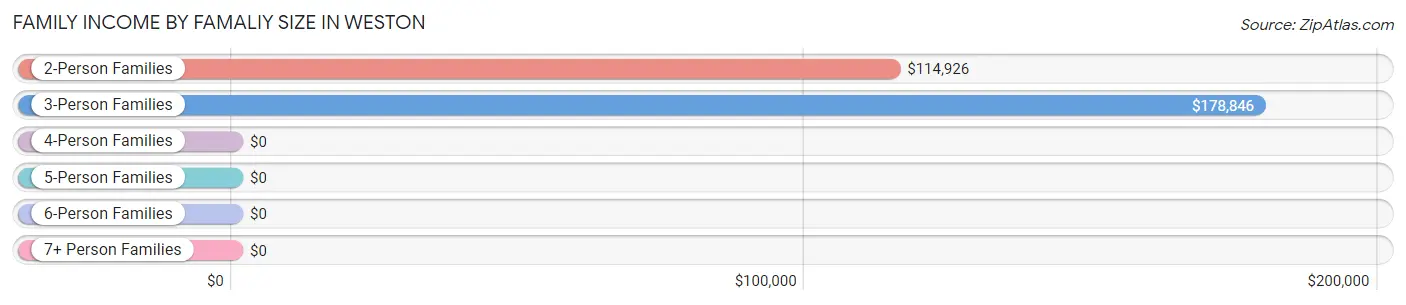
| Income Bracket | # Families | Median Income |
| 2-Person Families | 589 (83.8%) | $114,926 |
| 3-Person Families | 54 (7.7%) | $178,846 |
| 4-Person Families | 60 (8.5%) | $0 |
| 5-Person Families | 0 (0.0%) | $0 |
| 6-Person Families | 0 (0.0%) | $0 |
| 7+ Person Families | 0 (0.0%) | $0 |
| Total | 703 (100.0%) | $121,653 |
Family Income by Number of Earners in Weston
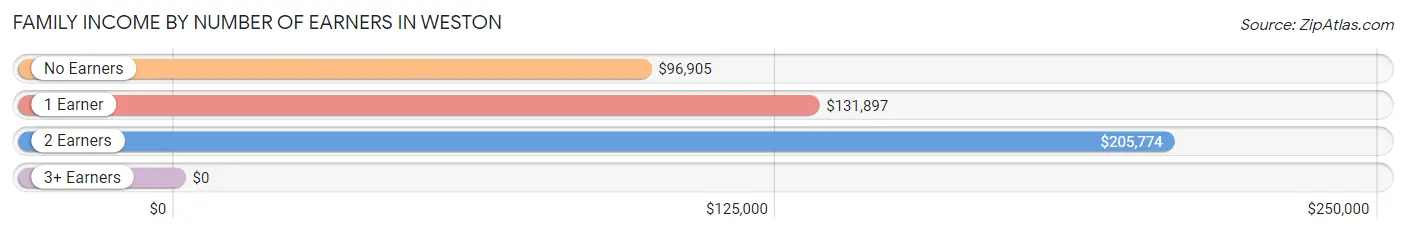
| Number of Earners | # Families | Median Income |
| No Earners | 286 (40.7%) | $96,905 |
| 1 Earner | 260 (37.0%) | $131,897 |
| 2 Earners | 97 (13.8%) | $205,774 |
| 3+ Earners | 60 (8.5%) | $0 |
| Total | 703 (100.0%) | $121,653 |
Household Income in Weston
Household Income Brackets in Weston
With 244 households falling in the category, the $100,000 to $149,999 income range is the most frequent in Weston, accounting for 20.3% of all households. In contrast, only 13 households (1.1%) fall into the $10,000 to $14,999 income bracket, making it the least populous group.
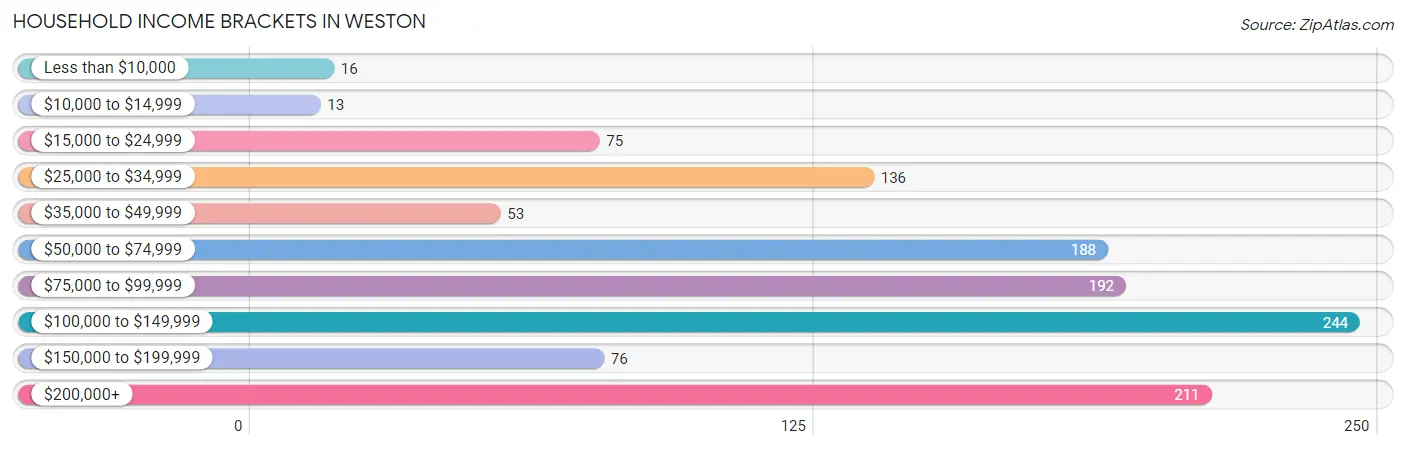
| Income Bracket | # Households | % Households |
| Less than $10,000 | 16 | 1.3% |
| $10,000 to $14,999 | 13 | 1.1% |
| $15,000 to $24,999 | 75 | 6.2% |
| $25,000 to $34,999 | 136 | 11.3% |
| $35,000 to $49,999 | 53 | 4.4% |
| $50,000 to $74,999 | 188 | 15.6% |
| $75,000 to $99,999 | 192 | 16.0% |
| $100,000 to $149,999 | 244 | 20.3% |
| $150,000 to $199,999 | 76 | 6.3% |
| $200,000+ | 211 | 17.5% |
Household Income by Householder Age in Weston
The median household income in Weston is $87,417, with the highest median household income of $84,917 found in the 65+ years age bracket for the primary householder. A total of 1,015 households (84.4%) fall into this category.
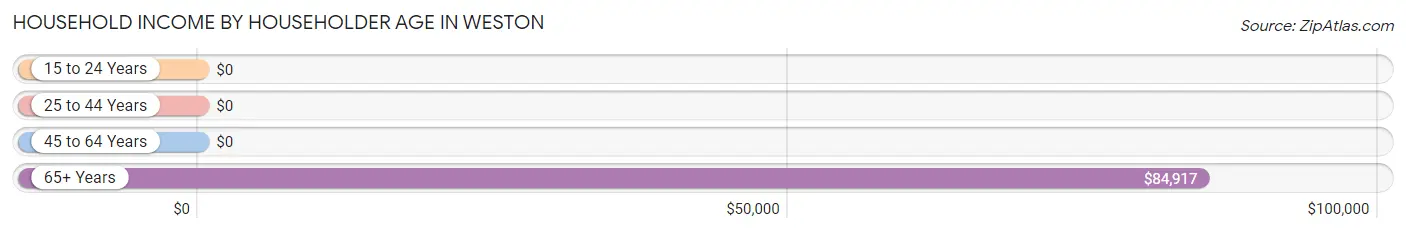
| Income Bracket | # Households | Median Income |
| 15 to 24 Years | 0 (0.0%) | $0 |
| 25 to 44 Years | 62 (5.1%) | $0 |
| 45 to 64 Years | 126 (10.5%) | $0 |
| 65+ Years | 1,015 (84.4%) | $84,917 |
| Total | 1,203 (100.0%) | $87,417 |
Poverty in Weston
Income Below Poverty by Sex and Age in Weston
With 2.4% poverty level for males and 2.0% for females among the residents of Weston, 55 to 64 year old males and 65 to 74 year old females are the most vulnerable to poverty, with 7 males (9.9%) and 23 females (4.1%) in their respective age groups living below the poverty level.
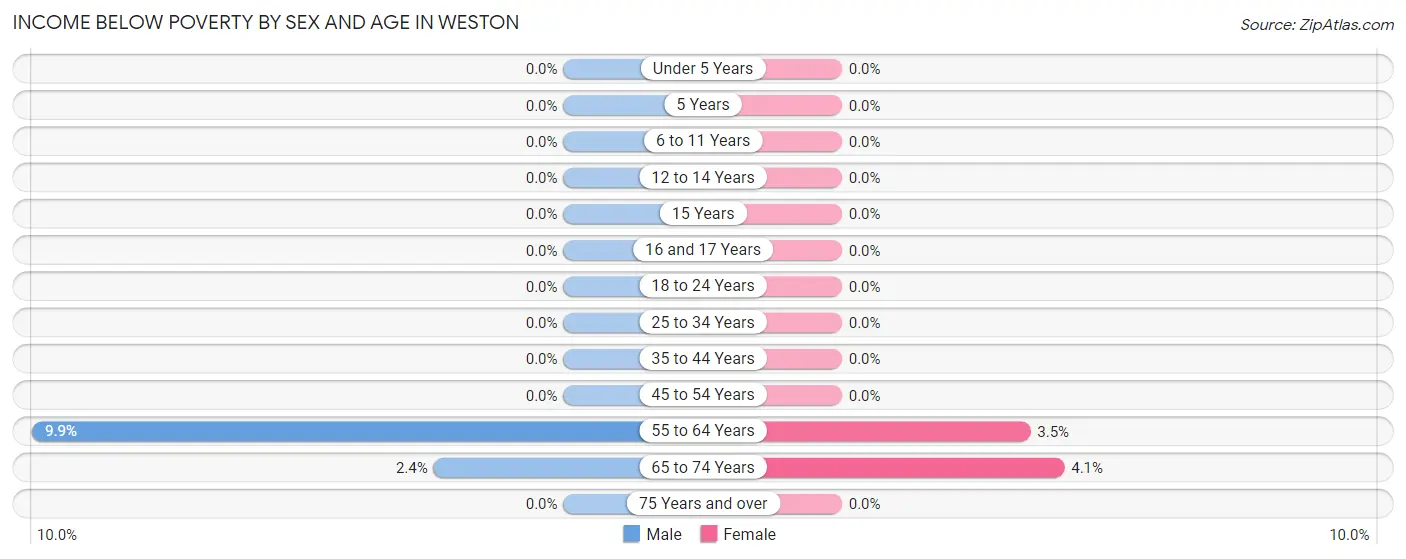
| Age Bracket | Male | Female |
| Under 5 Years | 0 (0.0%) | 0 (0.0%) |
| 5 Years | 0 (0.0%) | 0 (0.0%) |
| 6 to 11 Years | 0 (0.0%) | 0 (0.0%) |
| 12 to 14 Years | 0 (0.0%) | 0 (0.0%) |
| 15 Years | 0 (0.0%) | 0 (0.0%) |
| 16 and 17 Years | 0 (0.0%) | 0 (0.0%) |
| 18 to 24 Years | 0 (0.0%) | 0 (0.0%) |
| 25 to 34 Years | 0 (0.0%) | 0 (0.0%) |
| 35 to 44 Years | 0 (0.0%) | 0 (0.0%) |
| 45 to 54 Years | 0 (0.0%) | 0 (0.0%) |
| 55 to 64 Years | 7 (9.9%) | 7 (3.5%) |
| 65 to 74 Years | 9 (2.4%) | 23 (4.1%) |
| 75 Years and over | 0 (0.0%) | 0 (0.0%) |
| Total | 16 (2.4%) | 30 (2.0%) |
Income Above Poverty by Sex and Age in Weston
According to the poverty statistics in Weston, males aged 35 to 44 years and females aged 18 to 24 years are the age groups that are most secure financially, with 100.0% of males and 100.0% of females in these age groups living above the poverty line.
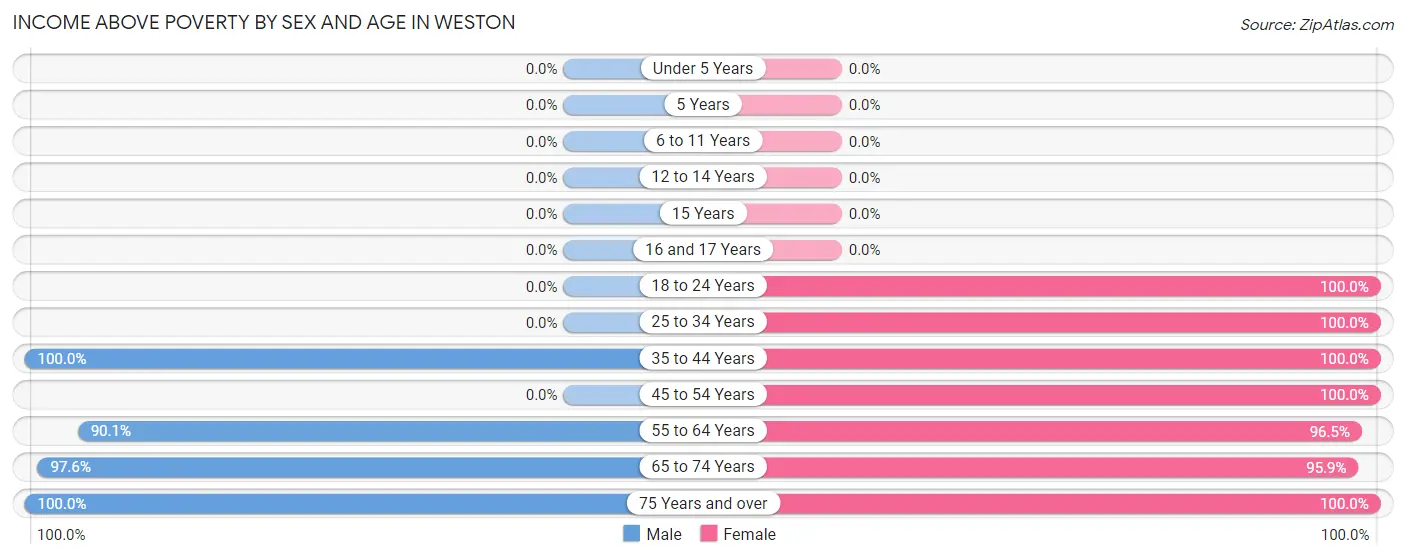
| Age Bracket | Male | Female |
| Under 5 Years | 0 (0.0%) | 0 (0.0%) |
| 5 Years | 0 (0.0%) | 0 (0.0%) |
| 6 to 11 Years | 0 (0.0%) | 0 (0.0%) |
| 12 to 14 Years | 0 (0.0%) | 0 (0.0%) |
| 15 Years | 0 (0.0%) | 0 (0.0%) |
| 16 and 17 Years | 0 (0.0%) | 0 (0.0%) |
| 18 to 24 Years | 0 (0.0%) | 16 (100.0%) |
| 25 to 34 Years | 0 (0.0%) | 104 (100.0%) |
| 35 to 44 Years | 27 (100.0%) | 87 (100.0%) |
| 45 to 54 Years | 0 (0.0%) | 21 (100.0%) |
| 55 to 64 Years | 64 (90.1%) | 193 (96.5%) |
| 65 to 74 Years | 365 (97.6%) | 534 (95.9%) |
| 75 Years and over | 203 (100.0%) | 484 (100.0%) |
| Total | 659 (97.6%) | 1,439 (98.0%) |
Income Below Poverty Among Married-Couple Families in Weston
The poverty statistics for married-couple families in Weston show that 2.7% or 16 of the total 585 families live below the poverty line. Families with no children have the highest poverty rate of 2.7%, comprising of 16 families. On the other hand, families with no children have the lowest poverty rate of 2.7%, which includes 16 families.
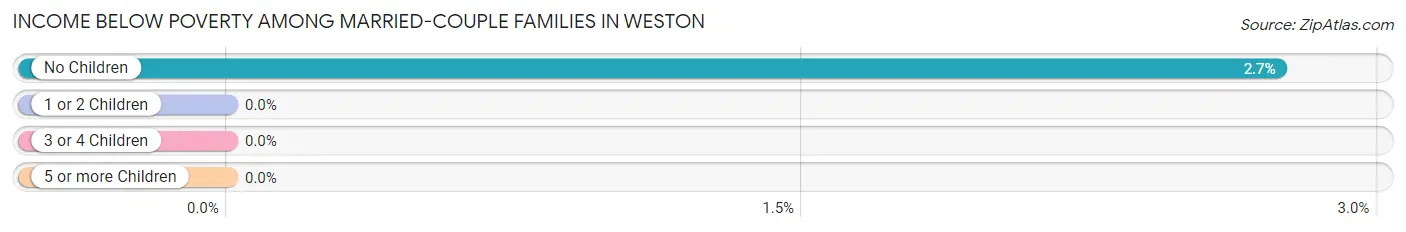
| Children | Above Poverty | Below Poverty |
| No Children | 569 (97.3%) | 16 (2.7%) |
| 1 or 2 Children | 0 (0.0%) | 0 (0.0%) |
| 3 or 4 Children | 0 (0.0%) | 0 (0.0%) |
| 5 or more Children | 0 (0.0%) | 0 (0.0%) |
| Total | 569 (97.3%) | 16 (2.7%) |
Income Below Poverty Among Single-Parent Households in Weston
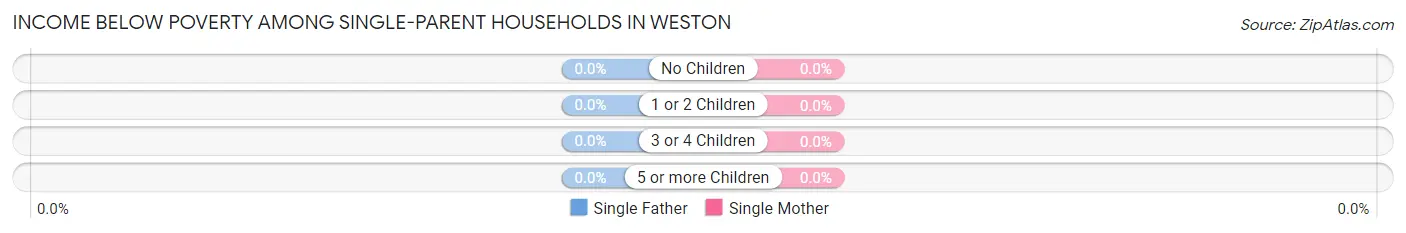
| Children | Single Father | Single Mother |
| No Children | 0 (0.0%) | 0 (0.0%) |
| 1 or 2 Children | 0 (0.0%) | 0 (0.0%) |
| 3 or 4 Children | 0 (0.0%) | 0 (0.0%) |
| 5 or more Children | 0 (0.0%) | 0 (0.0%) |
| Total | 0 (0.0%) | 0 (0.0%) |
Income Below Poverty Among Married-Couple vs Single-Parent Households in Weston
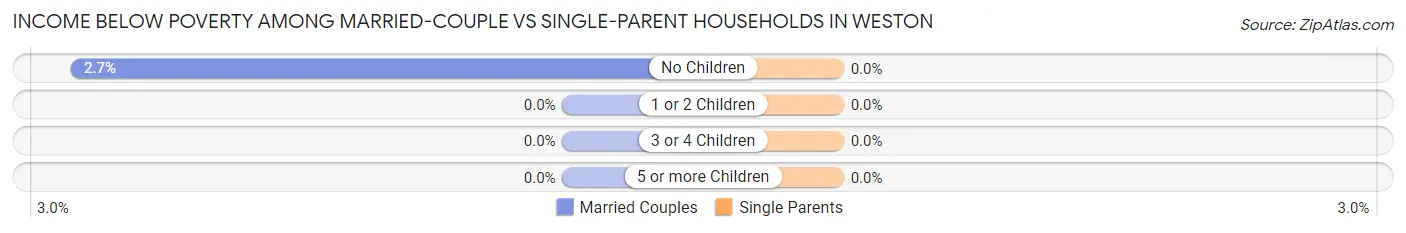
| Children | Married-Couple Families | Single-Parent Households |
| No Children | 16 (2.7%) | 0 (0.0%) |
| 1 or 2 Children | 0 (0.0%) | 0 (0.0%) |
| 3 or 4 Children | 0 (0.0%) | 0 (0.0%) |
| 5 or more Children | 0 (0.0%) | 0 (0.0%) |
| Total | 16 (2.7%) | 0 (0.0%) |
Race in Weston
The most populous races in Weston are White / Caucasian (1,399 | 65.2%), Asian (595 | 27.8%), and Black / African American (82 | 3.8%).
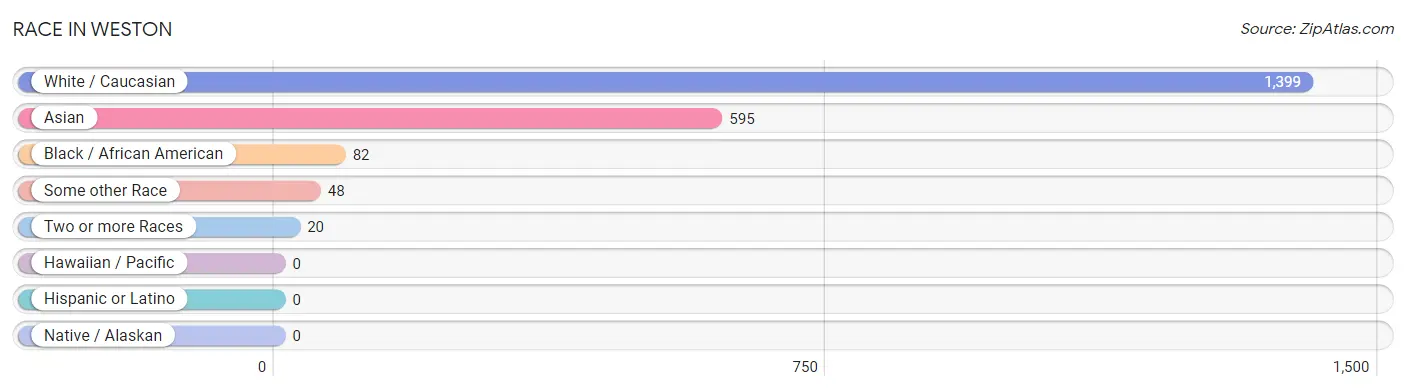
| Race | # Population | % Population |
| Asian | 595 | 27.8% |
| Black / African American | 82 | 3.8% |
| Hawaiian / Pacific | 0 | 0.0% |
| Hispanic or Latino | 0 | 0.0% |
| Native / Alaskan | 0 | 0.0% |
| White / Caucasian | 1,399 | 65.2% |
| Two or more Races | 20 | 0.9% |
| Some other Race | 48 | 2.2% |
| Total | 2,144 | 100.0% |
Ancestry in Weston
The most populous ancestries reported in Weston are Thai (468 | 21.8%), Italian (350 | 16.3%), Irish (231 | 10.8%), German (213 | 9.9%), and Polish (101 | 4.7%), together accounting for 63.6% of all Weston residents.
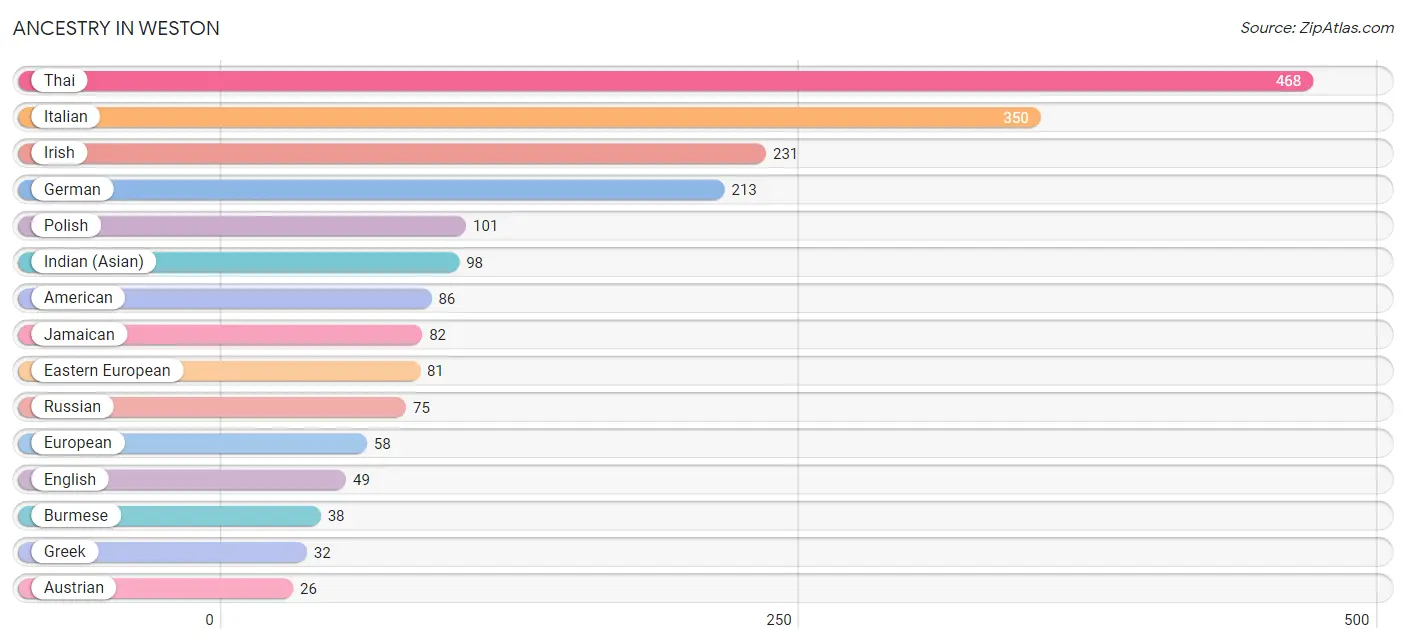
| Ancestry | # Population | % Population |
| American | 86 | 4.0% |
| Austrian | 26 | 1.2% |
| Burmese | 38 | 1.8% |
| Czech | 15 | 0.7% |
| Eastern European | 81 | 3.8% |
| English | 49 | 2.3% |
| European | 58 | 2.7% |
| French | 26 | 1.2% |
| German | 213 | 9.9% |
| Greek | 32 | 1.5% |
| Hungarian | 24 | 1.1% |
| Indian (Asian) | 98 | 4.6% |
| Irish | 231 | 10.8% |
| Israeli | 15 | 0.7% |
| Italian | 350 | 16.3% |
| Jamaican | 82 | 3.8% |
| Korean | 11 | 0.5% |
| Norwegian | 17 | 0.8% |
| Polish | 101 | 4.7% |
| Romanian | 11 | 0.5% |
| Russian | 75 | 3.5% |
| Slovak | 17 | 0.8% |
| Thai | 468 | 21.8% | View All 23 Rows |
Immigrants in Weston
The most numerous immigrant groups reported in Weston came from Asia (574 | 26.8%), India (432 | 20.2%), South Central Asia (432 | 20.2%), Eastern Asia (116 | 5.4%), and Europe (99 | 4.6%), together accounting for 77.1% of all Weston residents.
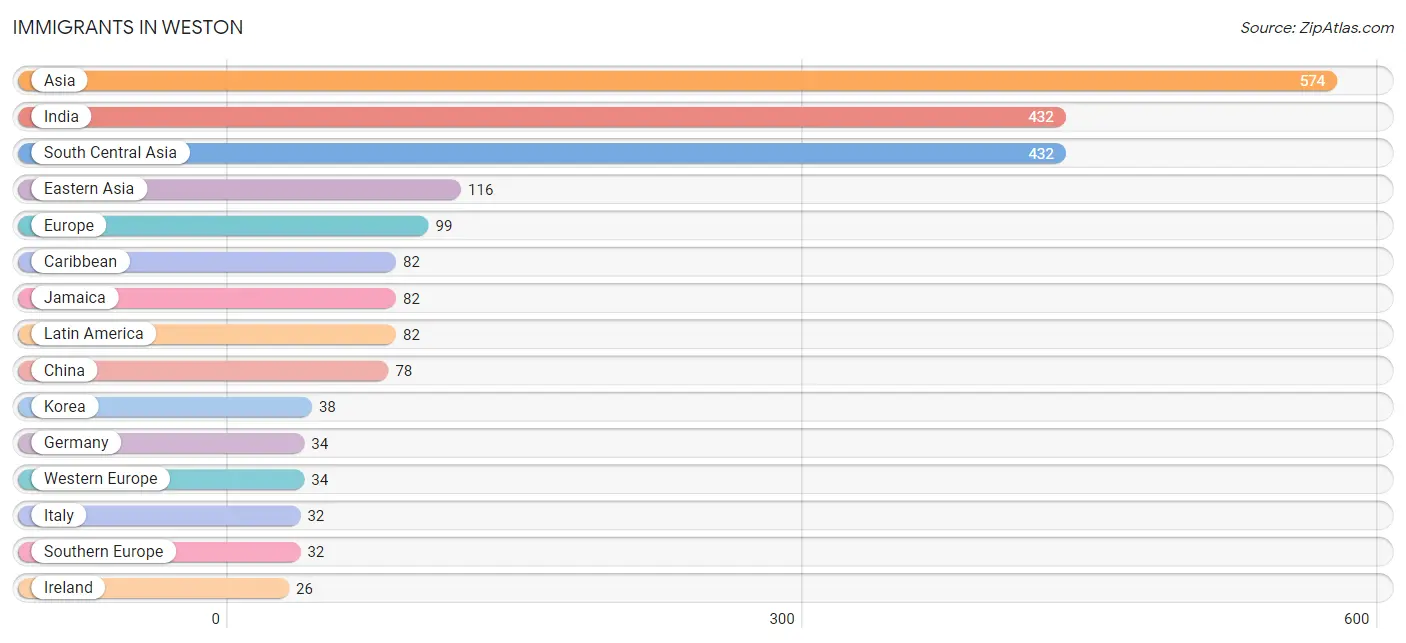
| Immigration Origin | # Population | % Population |
| Africa | 22 | 1.0% |
| Asia | 574 | 26.8% |
| Caribbean | 82 | 3.8% |
| China | 78 | 3.6% |
| Eastern Asia | 116 | 5.4% |
| Eastern Europe | 7 | 0.3% |
| Egypt | 13 | 0.6% |
| Europe | 99 | 4.6% |
| Germany | 34 | 1.6% |
| Hungary | 7 | 0.3% |
| India | 432 | 20.2% |
| Ireland | 26 | 1.2% |
| Israel | 15 | 0.7% |
| Italy | 32 | 1.5% |
| Jamaica | 82 | 3.8% |
| Korea | 38 | 1.8% |
| Latin America | 82 | 3.8% |
| Northern Africa | 22 | 1.0% |
| Northern Europe | 26 | 1.2% |
| Philippines | 11 | 0.5% |
| South Central Asia | 432 | 20.2% |
| South Eastern Asia | 11 | 0.5% |
| Southern Europe | 32 | 1.5% |
| Sudan | 9 | 0.4% |
| Western Asia | 15 | 0.7% |
| Western Europe | 34 | 1.6% | View All 26 Rows |
Sex and Age in Weston
Sex and Age in Weston
The most populous age groups in Weston are 70 to 74 Years (222 | 32.9%) for men and 70 to 74 Years (347 | 23.6%) for women.
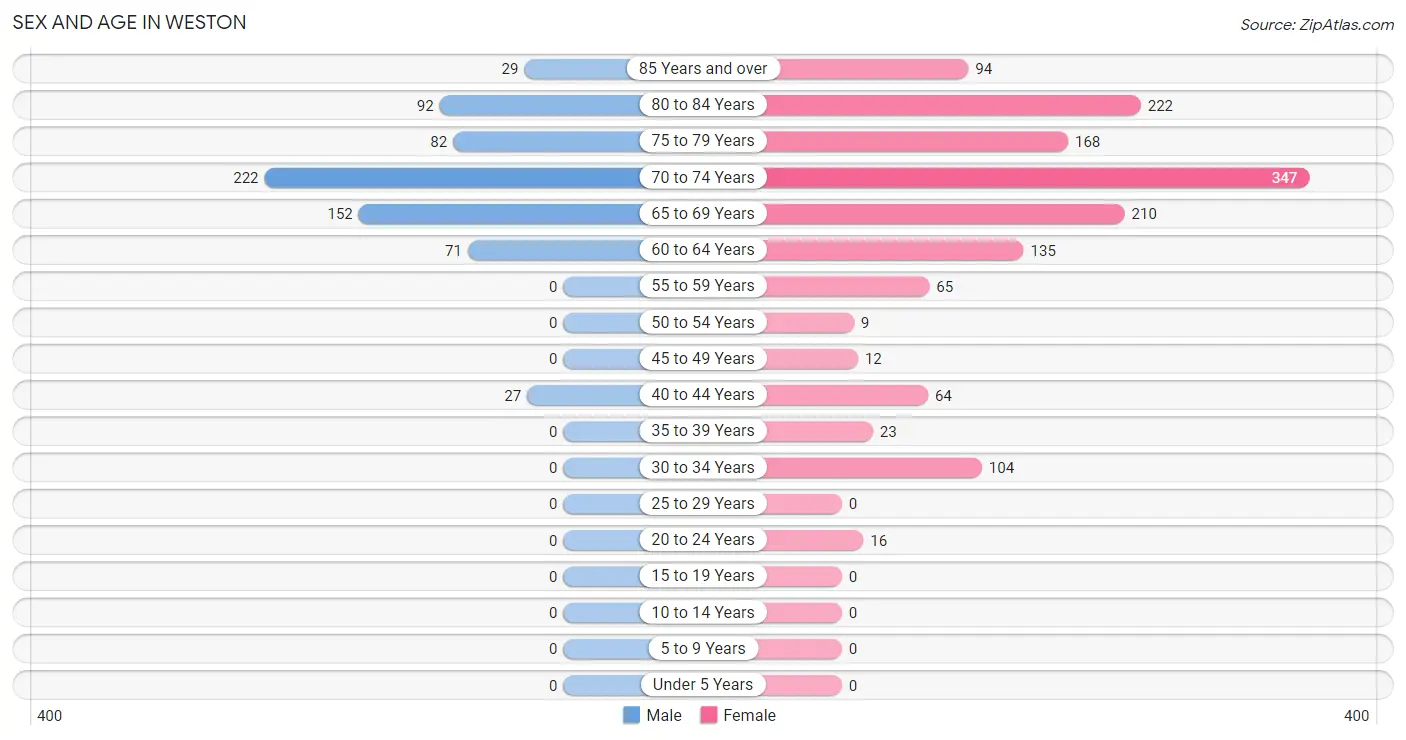
| Age Bracket | Male | Female |
| Under 5 Years | 0 (0.0%) | 0 (0.0%) |
| 5 to 9 Years | 0 (0.0%) | 0 (0.0%) |
| 10 to 14 Years | 0 (0.0%) | 0 (0.0%) |
| 15 to 19 Years | 0 (0.0%) | 0 (0.0%) |
| 20 to 24 Years | 0 (0.0%) | 16 (1.1%) |
| 25 to 29 Years | 0 (0.0%) | 0 (0.0%) |
| 30 to 34 Years | 0 (0.0%) | 104 (7.1%) |
| 35 to 39 Years | 0 (0.0%) | 23 (1.6%) |
| 40 to 44 Years | 27 (4.0%) | 64 (4.4%) |
| 45 to 49 Years | 0 (0.0%) | 12 (0.8%) |
| 50 to 54 Years | 0 (0.0%) | 9 (0.6%) |
| 55 to 59 Years | 0 (0.0%) | 65 (4.4%) |
| 60 to 64 Years | 71 (10.5%) | 135 (9.2%) |
| 65 to 69 Years | 152 (22.5%) | 210 (14.3%) |
| 70 to 74 Years | 222 (32.9%) | 347 (23.6%) |
| 75 to 79 Years | 82 (12.1%) | 168 (11.4%) |
| 80 to 84 Years | 92 (13.6%) | 222 (15.1%) |
| 85 Years and over | 29 (4.3%) | 94 (6.4%) |
| Total | 675 (100.0%) | 1,469 (100.0%) |
Families and Households in Weston
Median Family Size in Weston
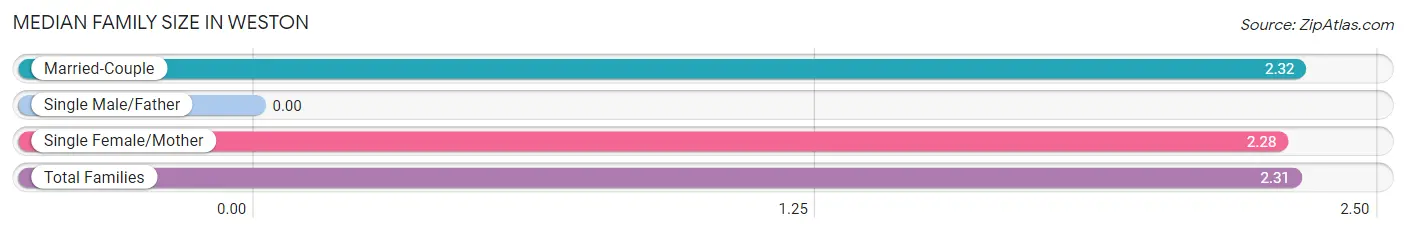
| Family Type | # Families | Family Size |
| Married-Couple | 585 (83.2%) | 2.32 |
| Single Male/Father | 0 (0.0%) | - |
| Single Female/Mother | 118 (16.8%) | 2.28 |
| Total Families | 703 (100.0%) | 2.31 |
Median Household Size in Weston
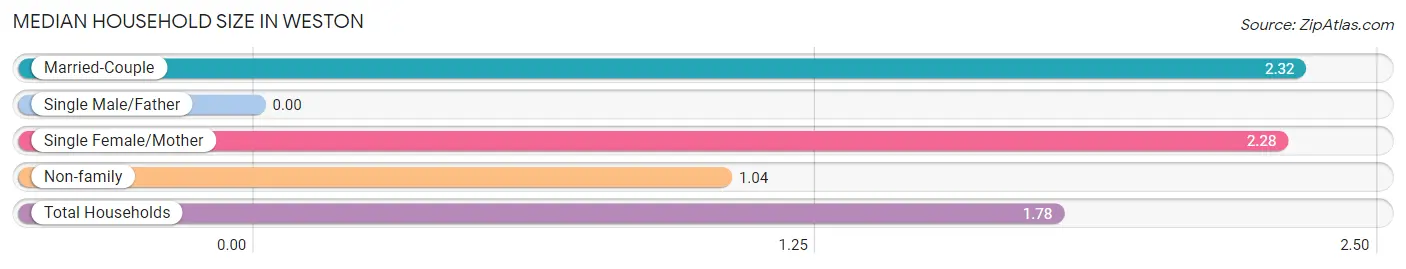
| Household Type | # Households | Household Size |
| Married-Couple | 585 (48.6%) | 2.32 |
| Single Male/Father | 0 (0.0%) | - |
| Single Female/Mother | 118 (9.8%) | 2.28 |
| Non-family | 500 (41.6%) | 1.04 |
| Total Households | 1,203 (100.0%) | 1.78 |
Household Size by Marriage Status in Weston
Out of a total of 1,203 households in Weston, 703 (58.4%) are family households, while 500 (41.6%) are nonfamily households. The most numerous type of family households are 2-person households, comprising 589, and the most common type of nonfamily households are 1-person households, comprising 482.
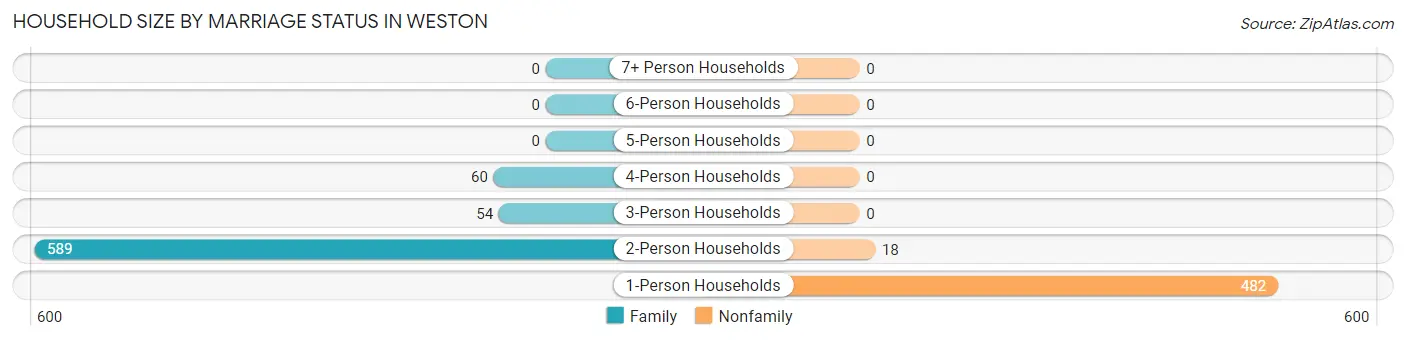
| Household Size | Family Households | Nonfamily Households |
| 1-Person Households | - | 482 (40.1%) |
| 2-Person Households | 589 (49.0%) | 18 (1.5%) |
| 3-Person Households | 54 (4.5%) | 0 (0.0%) |
| 4-Person Households | 60 (5.0%) | 0 (0.0%) |
| 5-Person Households | 0 (0.0%) | 0 (0.0%) |
| 6-Person Households | 0 (0.0%) | 0 (0.0%) |
| 7+ Person Households | 0 (0.0%) | 0 (0.0%) |
| Total | 703 (58.4%) | 500 (41.6%) |
Female Fertility in Weston
Fertility by Age in Weston
| Age Bracket | Women with Births | Births / 1,000 Women |
| 15 to 19 years | 0 (0.0%) | 0.0 |
| 20 to 34 years | 0 (0.0%) | 0.0 |
| 35 to 50 years | 0 (0.0%) | 0.0 |
| Total | 0 (0.0%) | 0.0 |
Fertility by Age by Marriage Status in Weston
| Age Bracket | Married | Unmarried |
| 15 to 19 years | 0 (0.0%) | 0 (0.0%) |
| 20 to 34 years | 0 (0.0%) | 0 (0.0%) |
| 35 to 50 years | 0 (0.0%) | 0 (0.0%) |
| Total | 0 (0.0%) | 0 (0.0%) |
Fertility by Education in Weston
| Educational Attainment | Women with Births | Births / 1,000 Women |
| Less than High School | 0 (0.0%) | 0.0 |
| High School Diploma | 0 (0.0%) | 0.0 |
| College or Associate's Degree | 0 (0.0%) | 0.0 |
| Bachelor's Degree | 0 (0.0%) | 0.0 |
| Graduate Degree | 0 (0.0%) | 0.0 |
| Total | 0 (0.0%) | 0.0 |
Fertility by Education by Marriage Status in Weston
| Educational Attainment | Married | Unmarried |
| Less than High School | 0 (0.0%) | 0 (0.0%) |
| High School Diploma | 0 (0.0%) | 0 (0.0%) |
| College or Associate's Degree | 0 (0.0%) | 0 (0.0%) |
| Bachelor's Degree | 0 (0.0%) | 0 (0.0%) |
| Graduate Degree | 0 (0.0%) | 0 (0.0%) |
| Total | 0 (0.0%) | 0 (0.0%) |
Employment Characteristics in Weston
Employment by Class of Employer in Weston
Among the 626 employed individuals in Weston, private company employees (450 | 71.9%), not-for-profit organizations (66 | 10.5%), and state government employees (39 | 6.2%) make up the most common classes of employment.
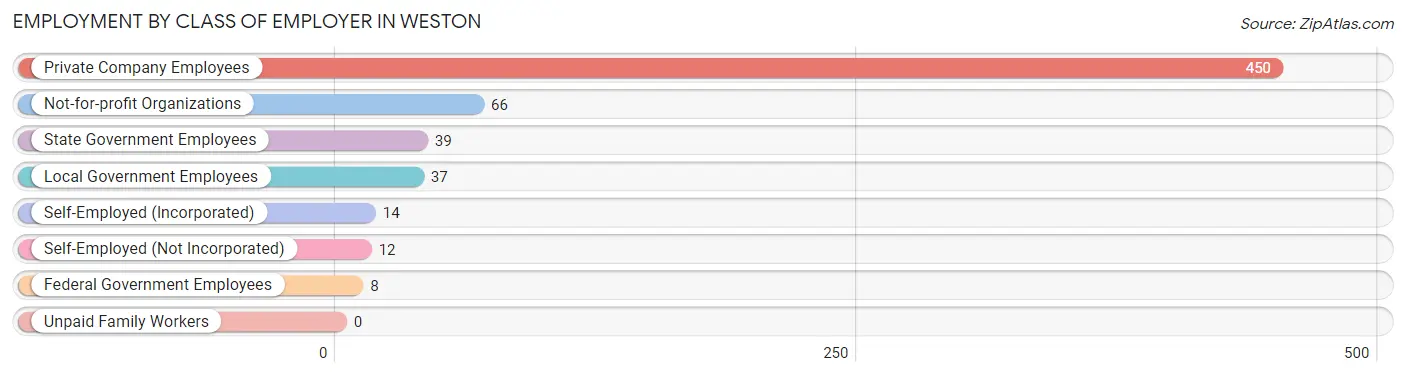
| Employer Class | # Employees | % Employees |
| Private Company Employees | 450 | 71.9% |
| Self-Employed (Incorporated) | 14 | 2.2% |
| Self-Employed (Not Incorporated) | 12 | 1.9% |
| Not-for-profit Organizations | 66 | 10.5% |
| Local Government Employees | 37 | 5.9% |
| State Government Employees | 39 | 6.2% |
| Federal Government Employees | 8 | 1.3% |
| Unpaid Family Workers | 0 | 0.0% |
| Total | 626 | 100.0% |
Employment Status by Age in Weston
According to the labor force statistics for Weston, out of the total population over 16 years of age (2,144), 30.6% or 656 individuals are in the labor force, with 4.7% or 31 of them unemployed. The age group with the highest labor force participation rate is 20 to 24 years, with 100.0% or 16 individuals in the labor force. Within the labor force, the 65 to 74 years age range has the highest percentage of unemployed individuals, with 17.2% or 31 of them being unemployed.
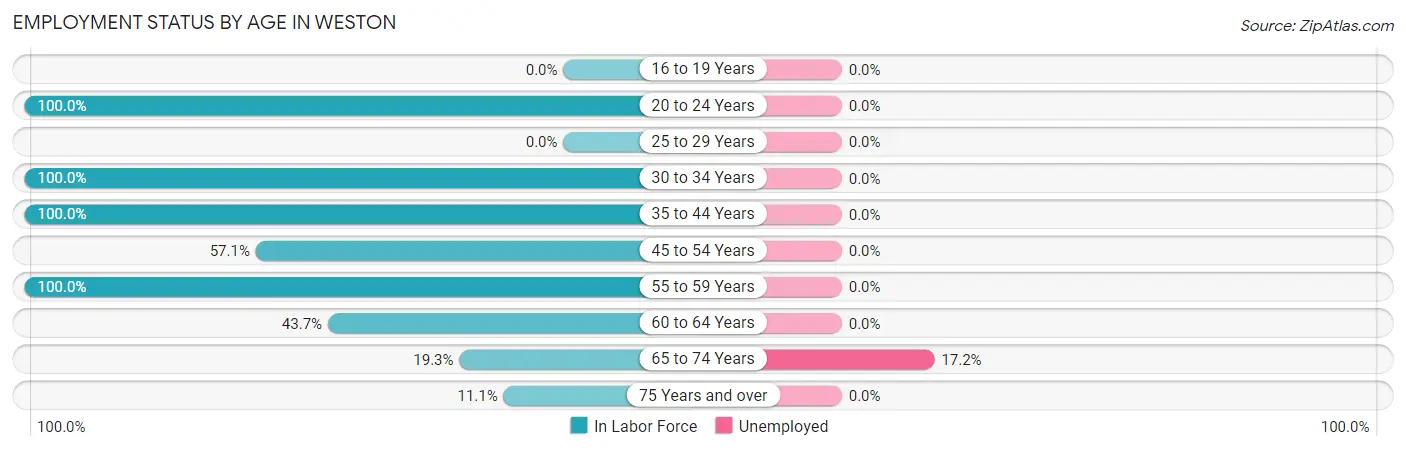
| Age Bracket | In Labor Force | Unemployed |
| 16 to 19 Years | 0 (0.0%) | 0 (0.0%) |
| 20 to 24 Years | 16 (100.0%) | 0 (0.0%) |
| 25 to 29 Years | 0 (0.0%) | 0 (0.0%) |
| 30 to 34 Years | 104 (100.0%) | 0 (0.0%) |
| 35 to 44 Years | 114 (100.0%) | 0 (0.0%) |
| 45 to 54 Years | 12 (57.1%) | 0 (0.0%) |
| 55 to 59 Years | 65 (100.0%) | 0 (0.0%) |
| 60 to 64 Years | 90 (43.7%) | 0 (0.0%) |
| 65 to 74 Years | 180 (19.3%) | 31 (17.2%) |
| 75 Years and over | 76 (11.1%) | 0 (0.0%) |
| Total | 656 (30.6%) | 31 (4.7%) |
Employment Status by Educational Attainment in Weston
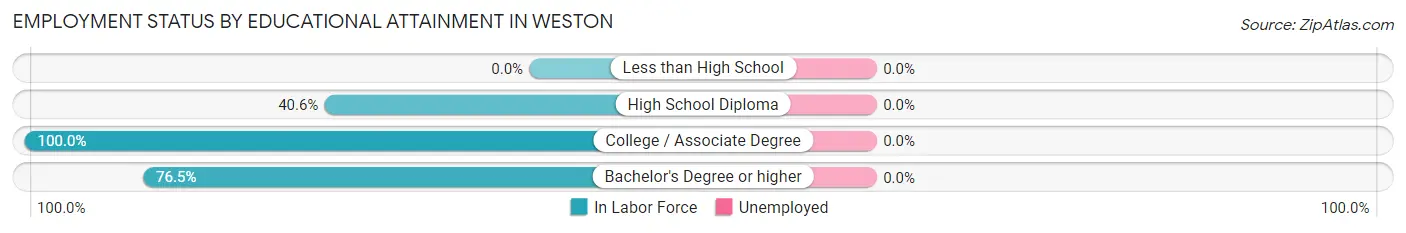
| Educational Attainment | In Labor Force | Unemployed |
| Less than High School | 0 (0.0%) | 0 (0.0%) |
| High School Diploma | 13 (40.6%) | 0 (0.0%) |
| College / Associate Degree | 26 (100.0%) | 0 (0.0%) |
| Bachelor's Degree or higher | 346 (76.5%) | 0 (0.0%) |
| Total | 385 (75.5%) | 0 (0.0%) |
Employment Occupations by Sex in Weston
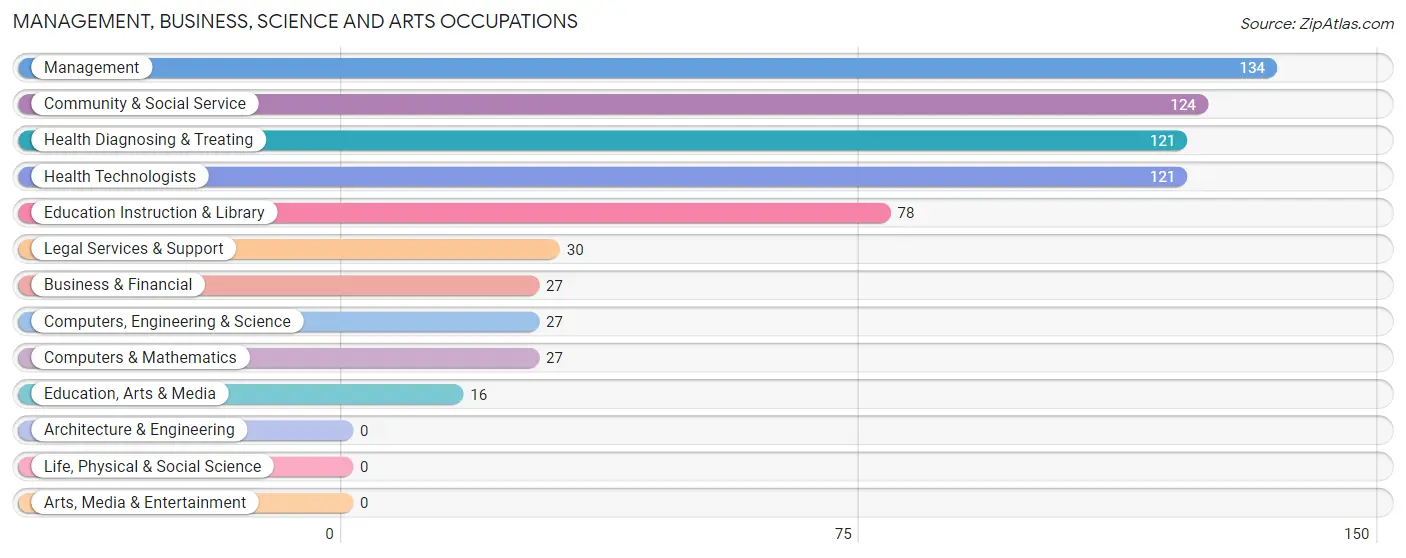
Management, Business, Science and Arts Occupations
The most common Management, Business, Science and Arts occupations in Weston are Management (134 | 21.4%), Community & Social Service (124 | 19.8%), Health Diagnosing & Treating (121 | 19.3%), Health Technologists (121 | 19.3%), and Education Instruction & Library (78 | 12.5%).
Management, Business, Science and Arts Occupations by Sex
Within the Management, Business, Science and Arts occupations in Weston, the most male-oriented occupations are Computers, Engineering & Science (100.0%), Computers & Mathematics (100.0%), and Education, Arts & Media (100.0%), while the most female-oriented occupations are Health Diagnosing & Treating (100.0%), Health Technologists (100.0%), and Management (77.6%).
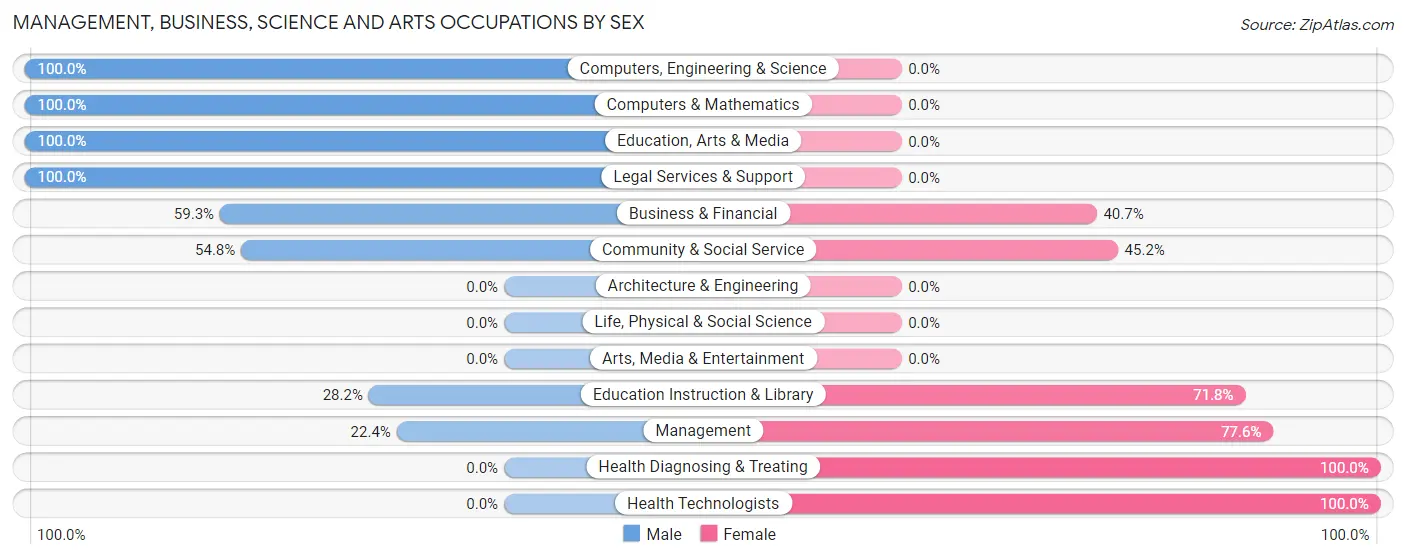
| Occupation | Male | Female |
| Management | 30 (22.4%) | 104 (77.6%) |
| Business & Financial | 16 (59.3%) | 11 (40.7%) |
| Computers, Engineering & Science | 27 (100.0%) | 0 (0.0%) |
| Computers & Mathematics | 27 (100.0%) | 0 (0.0%) |
| Architecture & Engineering | 0 (0.0%) | 0 (0.0%) |
| Life, Physical & Social Science | 0 (0.0%) | 0 (0.0%) |
| Community & Social Service | 68 (54.8%) | 56 (45.2%) |
| Education, Arts & Media | 16 (100.0%) | 0 (0.0%) |
| Legal Services & Support | 30 (100.0%) | 0 (0.0%) |
| Education Instruction & Library | 22 (28.2%) | 56 (71.8%) |
| Arts, Media & Entertainment | 0 (0.0%) | 0 (0.0%) |
| Health Diagnosing & Treating | 0 (0.0%) | 121 (100.0%) |
| Health Technologists | 0 (0.0%) | 121 (100.0%) |
| Total (Category) | 141 (32.6%) | 292 (67.4%) |
| Total (Overall) | 220 (35.1%) | 406 (64.9%) |
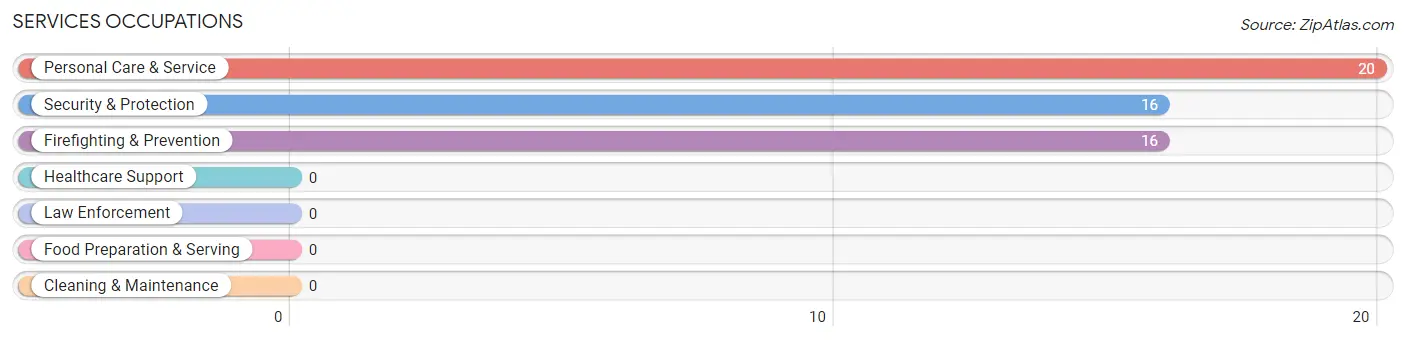
Services Occupations
The most common Services occupations in Weston are Personal Care & Service (20 | 3.2%), Security & Protection (16 | 2.6%), and Firefighting & Prevention (16 | 2.6%).
Services Occupations by Sex
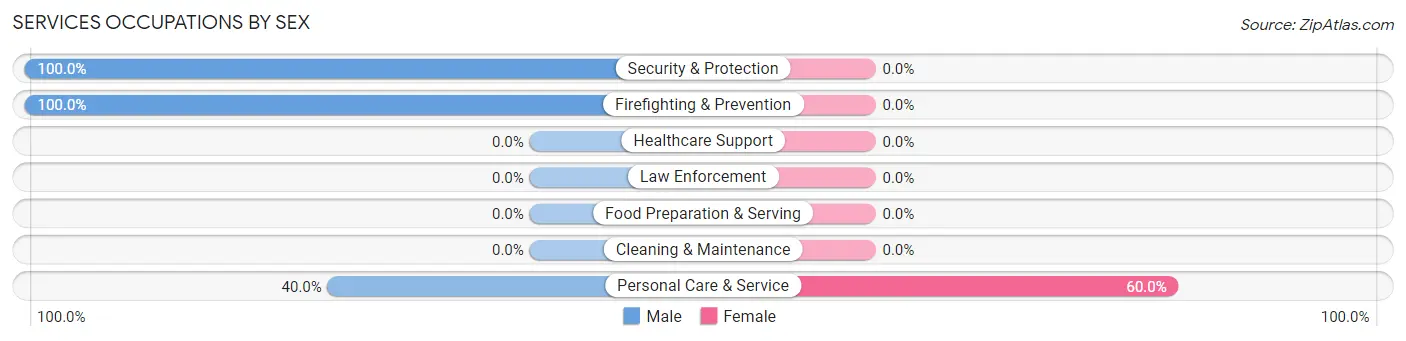
| Occupation | Male | Female |
| Healthcare Support | 0 (0.0%) | 0 (0.0%) |
| Security & Protection | 16 (100.0%) | 0 (0.0%) |
| Firefighting & Prevention | 16 (100.0%) | 0 (0.0%) |
| Law Enforcement | 0 (0.0%) | 0 (0.0%) |
| Food Preparation & Serving | 0 (0.0%) | 0 (0.0%) |
| Cleaning & Maintenance | 0 (0.0%) | 0 (0.0%) |
| Personal Care & Service | 8 (40.0%) | 12 (60.0%) |
| Total (Category) | 24 (66.7%) | 12 (33.3%) |
| Total (Overall) | 220 (35.1%) | 406 (64.9%) |
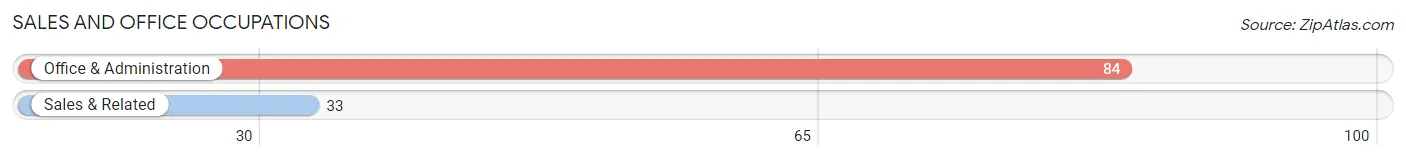
Sales and Office Occupations
The most common Sales and Office occupations in Weston are Office & Administration (84 | 13.4%), and Sales & Related (33 | 5.3%).
Sales and Office Occupations by Sex
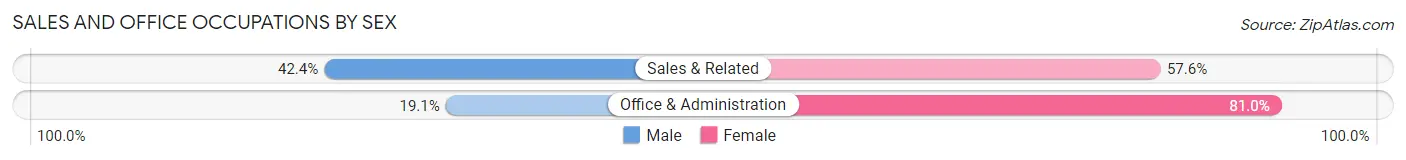
| Occupation | Male | Female |
| Sales & Related | 14 (42.4%) | 19 (57.6%) |
| Office & Administration | 16 (19.1%) | 68 (80.9%) |
| Total (Category) | 30 (25.6%) | 87 (74.4%) |
| Total (Overall) | 220 (35.1%) | 406 (64.9%) |
Natural Resources, Construction and Maintenance Occupations
Natural Resources, Construction and Maintenance Occupations by Sex
| Occupation | Male | Female |
| Farming, Fishing & Forestry | 0 (0.0%) | 0 (0.0%) |
| Construction & Extraction | 0 (0.0%) | 0 (0.0%) |
| Installation, Maintenance & Repair | 0 (0.0%) | 0 (0.0%) |
| Total (Category) | 0 (0.0%) | 0 (0.0%) |
| Total (Overall) | 220 (35.1%) | 406 (64.9%) |
Production, Transportation and Moving Occupations
The most common Production, Transportation and Moving occupations in Weston are Transportation (25 | 4.0%), and Production (15 | 2.4%).
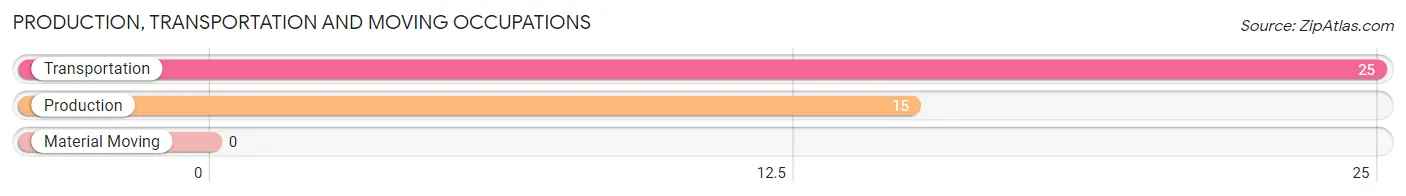
Production, Transportation and Moving Occupations by Sex
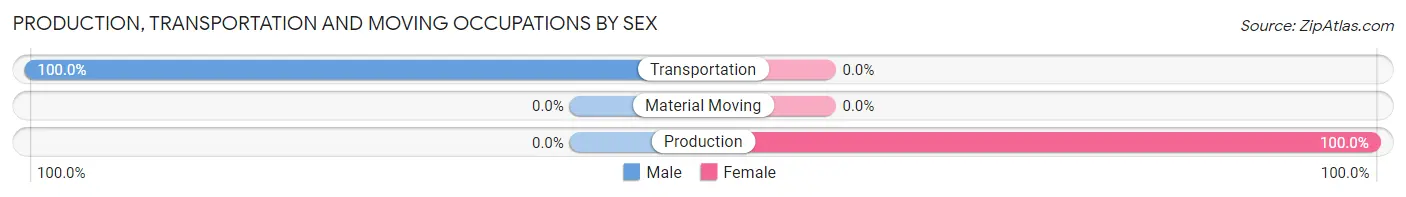
| Occupation | Male | Female |
| Production | 0 (0.0%) | 15 (100.0%) |
| Transportation | 25 (100.0%) | 0 (0.0%) |
| Material Moving | 0 (0.0%) | 0 (0.0%) |
| Total (Category) | 25 (62.5%) | 15 (37.5%) |
| Total (Overall) | 220 (35.1%) | 406 (64.9%) |
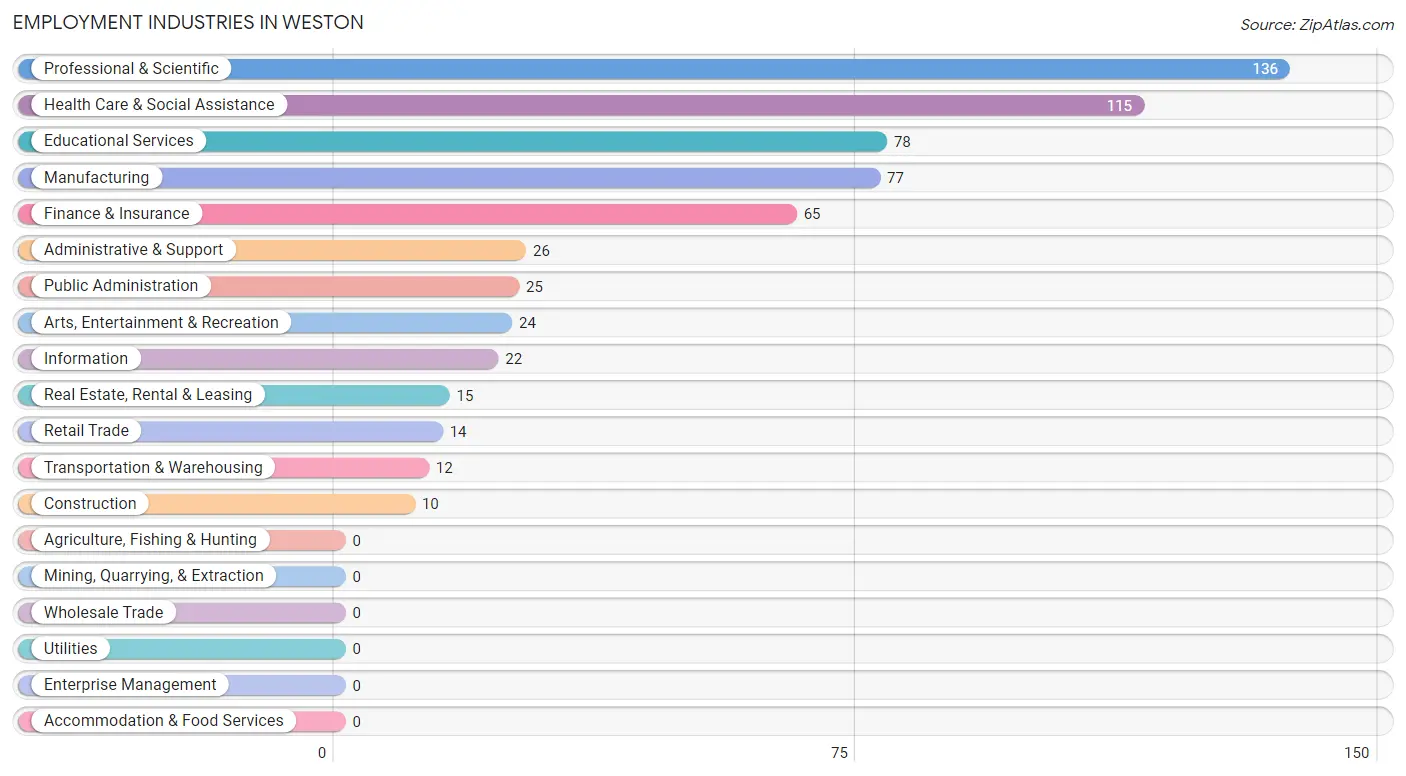
Employment Industries by Sex in Weston
Employment Industries in Weston
The major employment industries in Weston include Professional & Scientific (136 | 21.7%), Health Care & Social Assistance (115 | 18.4%), Educational Services (78 | 12.5%), Manufacturing (77 | 12.3%), and Finance & Insurance (65 | 10.4%).
Employment Industries by Sex in Weston
The Weston industries that see more men than women are Retail Trade (100.0%), Transportation & Warehousing (100.0%), and Arts, Entertainment & Recreation (100.0%), whereas the industries that tend to have a higher number of women are Construction (100.0%), Finance & Insurance (100.0%), and Real Estate, Rental & Leasing (100.0%).
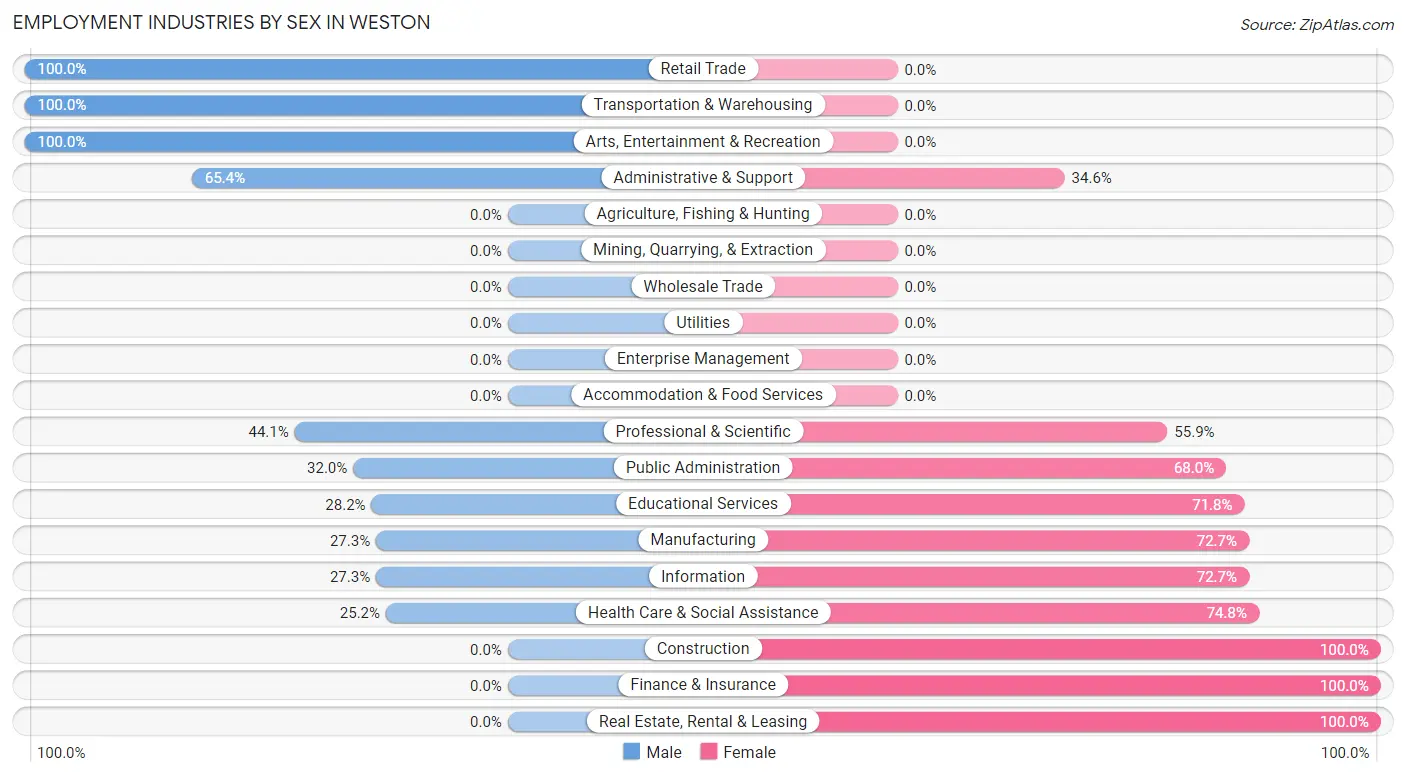
| Industry | Male | Female |
| Agriculture, Fishing & Hunting | 0 (0.0%) | 0 (0.0%) |
| Mining, Quarrying, & Extraction | 0 (0.0%) | 0 (0.0%) |
| Construction | 0 (0.0%) | 10 (100.0%) |
| Manufacturing | 21 (27.3%) | 56 (72.7%) |
| Wholesale Trade | 0 (0.0%) | 0 (0.0%) |
| Retail Trade | 14 (100.0%) | 0 (0.0%) |
| Transportation & Warehousing | 12 (100.0%) | 0 (0.0%) |
| Utilities | 0 (0.0%) | 0 (0.0%) |
| Information | 6 (27.3%) | 16 (72.7%) |
| Finance & Insurance | 0 (0.0%) | 65 (100.0%) |
| Real Estate, Rental & Leasing | 0 (0.0%) | 15 (100.0%) |
| Professional & Scientific | 60 (44.1%) | 76 (55.9%) |
| Enterprise Management | 0 (0.0%) | 0 (0.0%) |
| Administrative & Support | 17 (65.4%) | 9 (34.6%) |
| Educational Services | 22 (28.2%) | 56 (71.8%) |
| Health Care & Social Assistance | 29 (25.2%) | 86 (74.8%) |
| Arts, Entertainment & Recreation | 24 (100.0%) | 0 (0.0%) |
| Accommodation & Food Services | 0 (0.0%) | 0 (0.0%) |
| Public Administration | 8 (32.0%) | 17 (68.0%) |
| Total | 220 (35.1%) | 406 (64.9%) |
Education in Weston
School Enrollment in Weston
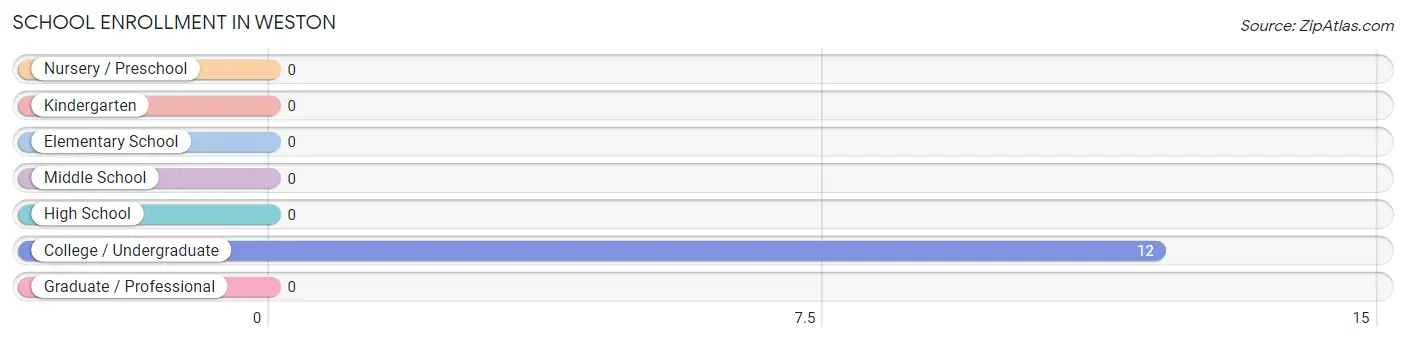
| School Level | # Students | % Students |
| Nursery / Preschool | 0 | 0.0% |
| Kindergarten | 0 | 0.0% |
| Elementary School | 0 | 0.0% |
| Middle School | 0 | 0.0% |
| High School | 0 | 0.0% |
| College / Undergraduate | 12 | 100.0% |
| Graduate / Professional | 0 | 0.0% |
| Total | 12 | 100.0% |
School Enrollment by Age by Funding Source in Weston
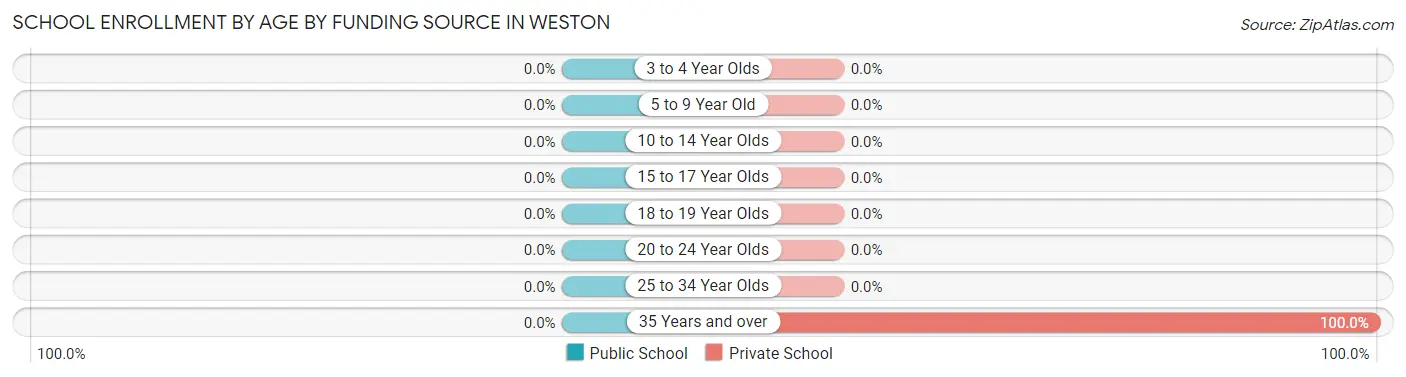
| Age Bracket | Public School | Private School |
| 3 to 4 Year Olds | 0 (0.0%) | 0 (0.0%) |
| 5 to 9 Year Old | 0 (0.0%) | 0 (0.0%) |
| 10 to 14 Year Olds | 0 (0.0%) | 0 (0.0%) |
| 15 to 17 Year Olds | 0 (0.0%) | 0 (0.0%) |
| 18 to 19 Year Olds | 0 (0.0%) | 0 (0.0%) |
| 20 to 24 Year Olds | 0 (0.0%) | 0 (0.0%) |
| 25 to 34 Year Olds | 0 (0.0%) | 0 (0.0%) |
| 35 Years and over | 0 (0.0%) | 12 (100.0%) |
| Total | 0 (0.0%) | 12 (100.0%) |
Educational Attainment by Field of Study in Weston
Education (288 | 20.1%), business (275 | 19.2%), liberal arts & history (154 | 10.7%), psychology (111 | 7.7%), and science & technology (111 | 7.7%) are the most common fields of study among 1,433 individuals in Weston who have obtained a bachelor's degree or higher.
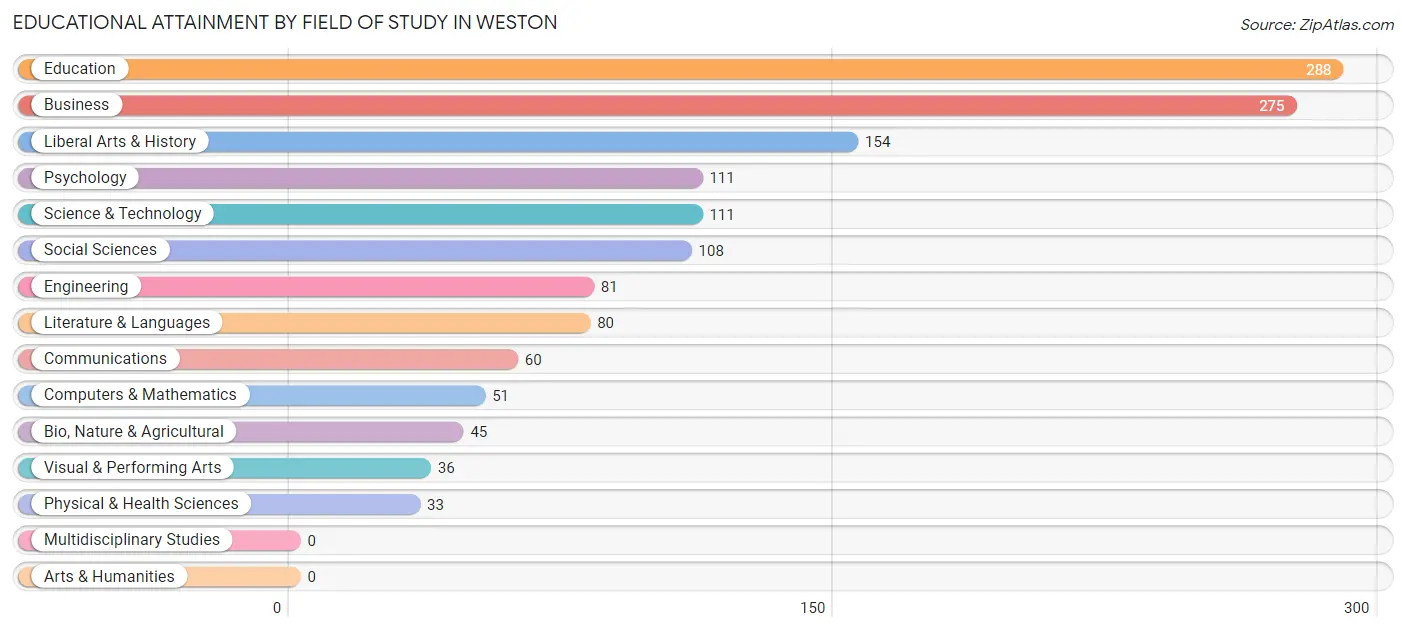
| Field of Study | # Graduates | % Graduates |
| Computers & Mathematics | 51 | 3.6% |
| Bio, Nature & Agricultural | 45 | 3.1% |
| Physical & Health Sciences | 33 | 2.3% |
| Psychology | 111 | 7.7% |
| Social Sciences | 108 | 7.5% |
| Engineering | 81 | 5.7% |
| Multidisciplinary Studies | 0 | 0.0% |
| Science & Technology | 111 | 7.7% |
| Business | 275 | 19.2% |
| Education | 288 | 20.1% |
| Literature & Languages | 80 | 5.6% |
| Liberal Arts & History | 154 | 10.7% |
| Visual & Performing Arts | 36 | 2.5% |
| Communications | 60 | 4.2% |
| Arts & Humanities | 0 | 0.0% |
| Total | 1,433 | 100.0% |
Transportation & Commute in Weston
Vehicle Availability by Sex in Weston
The most prevalent vehicle ownership categories in Weston are males with 2 vehicles (133, accounting for 60.5%) and females with 2 vehicles (108, making up 32.8%).
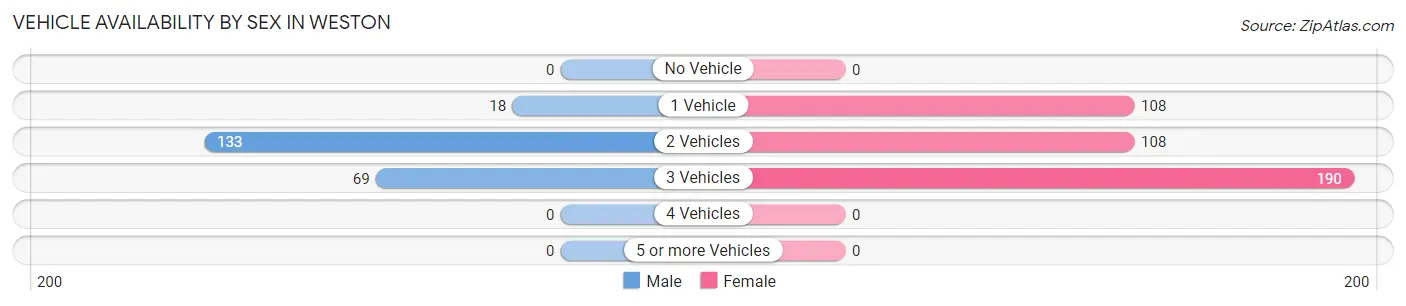
| Vehicles Available | Male | Female |
| No Vehicle | 0 (0.0%) | 0 (0.0%) |
| 1 Vehicle | 18 (8.2%) | 108 (26.6%) |
| 2 Vehicles | 133 (60.5%) | 108 (26.6%) |
| 3 Vehicles | 69 (31.4%) | 190 (46.8%) |
| 4 Vehicles | 0 (0.0%) | 0 (0.0%) |
| 5 or more Vehicles | 0 (0.0%) | 0 (0.0%) |
| Total | 220 (100.0%) | 406 (100.0%) |
Commute Time in Weston
The most frequently occuring commute durations in Weston are 45 to 59 minutes (134 commuters, 25.6%), 30 to 34 minutes (69 commuters, 13.2%), and 90 or more minutes (64 commuters, 12.2%).
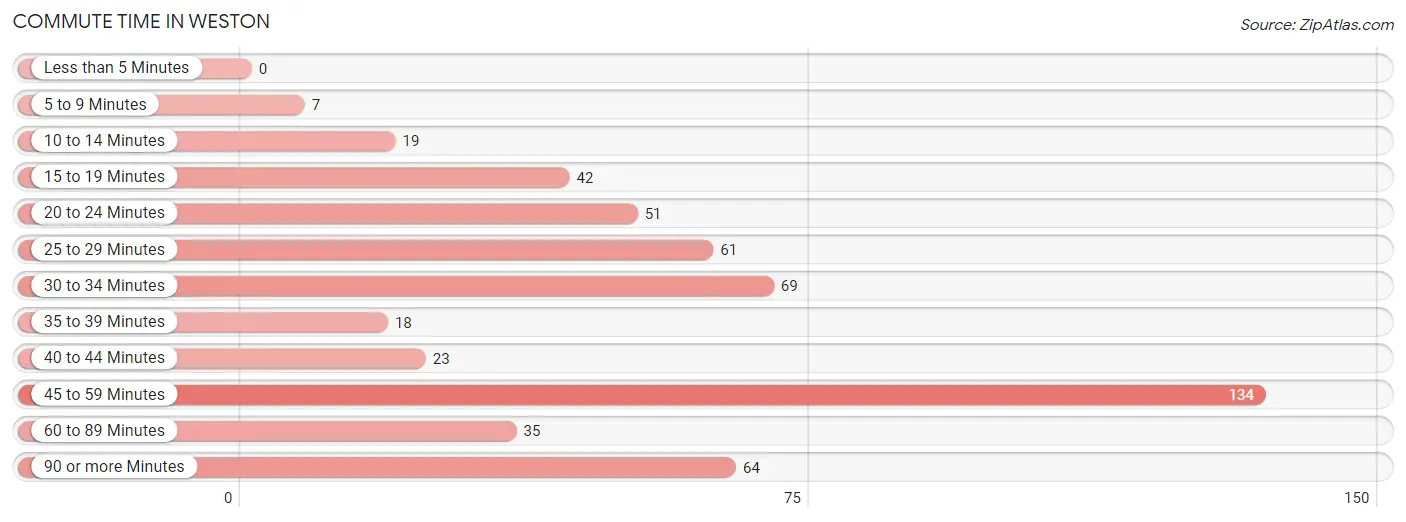
| Commute Time | # Commuters | % Commuters |
| Less than 5 Minutes | 0 | 0.0% |
| 5 to 9 Minutes | 7 | 1.3% |
| 10 to 14 Minutes | 19 | 3.6% |
| 15 to 19 Minutes | 42 | 8.0% |
| 20 to 24 Minutes | 51 | 9.8% |
| 25 to 29 Minutes | 61 | 11.7% |
| 30 to 34 Minutes | 69 | 13.2% |
| 35 to 39 Minutes | 18 | 3.4% |
| 40 to 44 Minutes | 23 | 4.4% |
| 45 to 59 Minutes | 134 | 25.6% |
| 60 to 89 Minutes | 35 | 6.7% |
| 90 or more Minutes | 64 | 12.2% |
Commute Time by Sex in Weston
The most common commute times in Weston are 30 to 34 minutes (40 commuters, 21.9%) for males and 45 to 59 minutes (121 commuters, 35.6%) for females.
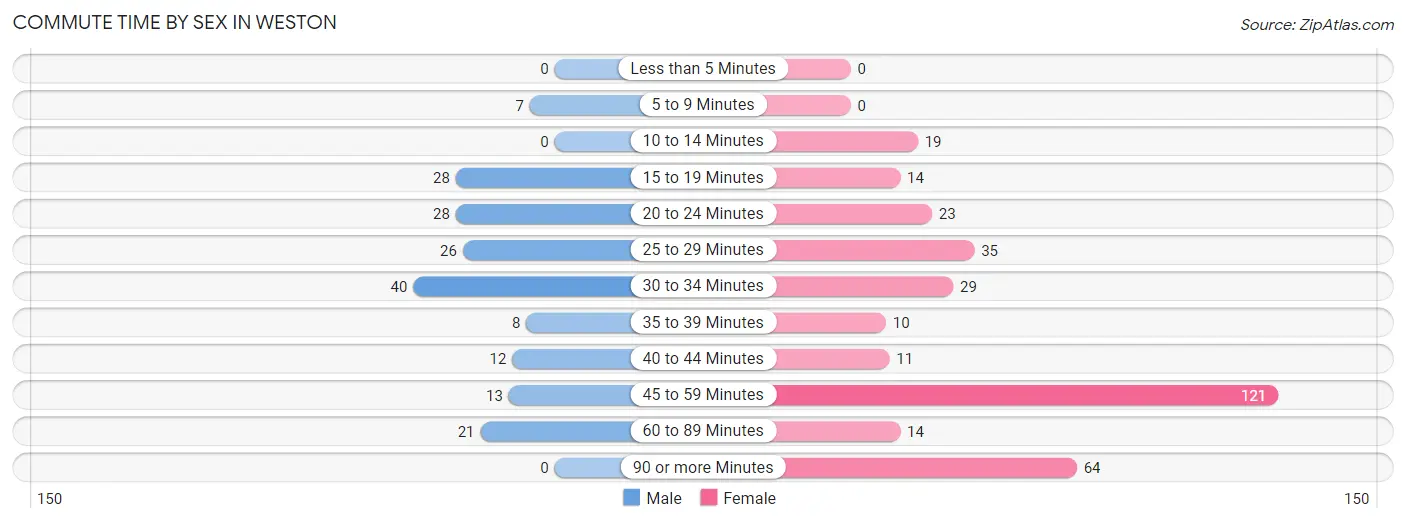
| Commute Time | Male | Female |
| Less than 5 Minutes | 0 (0.0%) | 0 (0.0%) |
| 5 to 9 Minutes | 7 (3.8%) | 0 (0.0%) |
| 10 to 14 Minutes | 0 (0.0%) | 19 (5.6%) |
| 15 to 19 Minutes | 28 (15.3%) | 14 (4.1%) |
| 20 to 24 Minutes | 28 (15.3%) | 23 (6.8%) |
| 25 to 29 Minutes | 26 (14.2%) | 35 (10.3%) |
| 30 to 34 Minutes | 40 (21.9%) | 29 (8.5%) |
| 35 to 39 Minutes | 8 (4.4%) | 10 (2.9%) |
| 40 to 44 Minutes | 12 (6.6%) | 11 (3.2%) |
| 45 to 59 Minutes | 13 (7.1%) | 121 (35.6%) |
| 60 to 89 Minutes | 21 (11.5%) | 14 (4.1%) |
| 90 or more Minutes | 0 (0.0%) | 64 (18.8%) |
Time of Departure to Work by Sex in Weston
The most frequent times of departure to work in Weston are 8:30 AM to 8:59 AM (49, 26.8%) for males and 6:30 AM to 6:59 AM (143, 42.1%) for females.
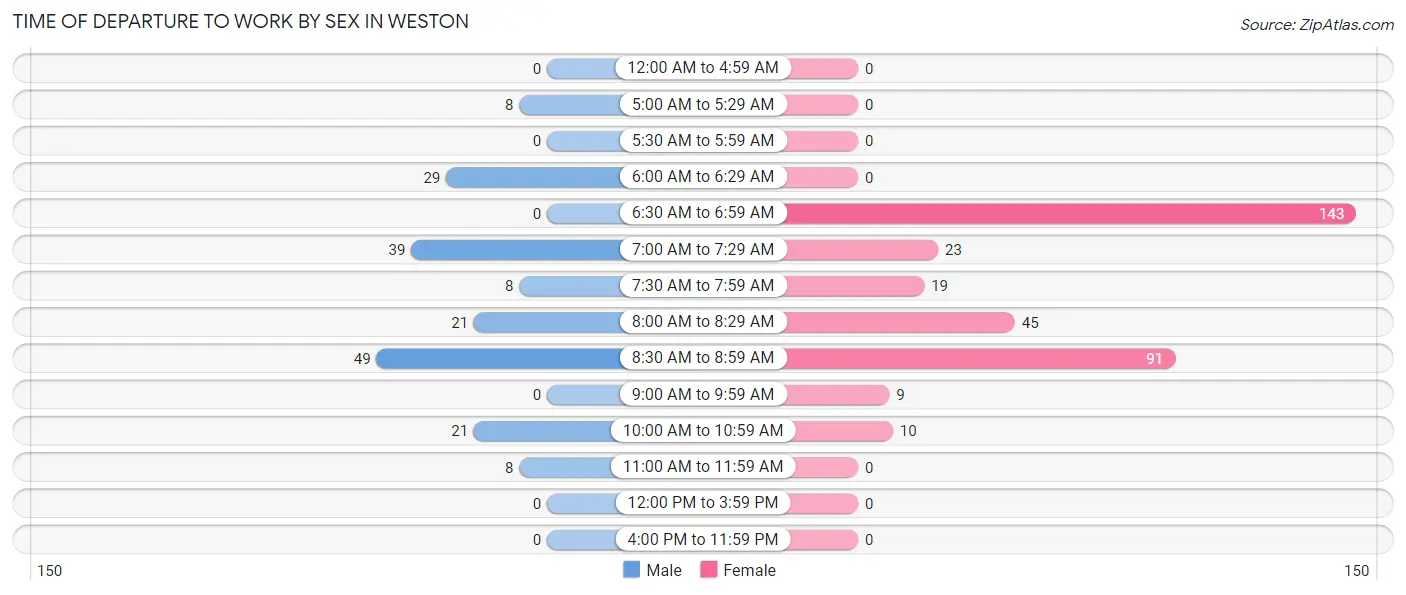
| Time of Departure | Male | Female |
| 12:00 AM to 4:59 AM | 0 (0.0%) | 0 (0.0%) |
| 5:00 AM to 5:29 AM | 8 (4.4%) | 0 (0.0%) |
| 5:30 AM to 5:59 AM | 0 (0.0%) | 0 (0.0%) |
| 6:00 AM to 6:29 AM | 29 (15.9%) | 0 (0.0%) |
| 6:30 AM to 6:59 AM | 0 (0.0%) | 143 (42.1%) |
| 7:00 AM to 7:29 AM | 39 (21.3%) | 23 (6.8%) |
| 7:30 AM to 7:59 AM | 8 (4.4%) | 19 (5.6%) |
| 8:00 AM to 8:29 AM | 21 (11.5%) | 45 (13.2%) |
| 8:30 AM to 8:59 AM | 49 (26.8%) | 91 (26.8%) |
| 9:00 AM to 9:59 AM | 0 (0.0%) | 9 (2.6%) |
| 10:00 AM to 10:59 AM | 21 (11.5%) | 10 (2.9%) |
| 11:00 AM to 11:59 AM | 8 (4.4%) | 0 (0.0%) |
| 12:00 PM to 3:59 PM | 0 (0.0%) | 0 (0.0%) |
| 4:00 PM to 11:59 PM | 0 (0.0%) | 0 (0.0%) |
| Total | 183 (100.0%) | 340 (100.0%) |
Housing Occupancy in Weston
Occupancy by Ownership in Weston
Of the total 1,203 dwellings in Weston, owner-occupied units account for 1,196 (99.4%), while renter-occupied units make up 7 (0.6%).
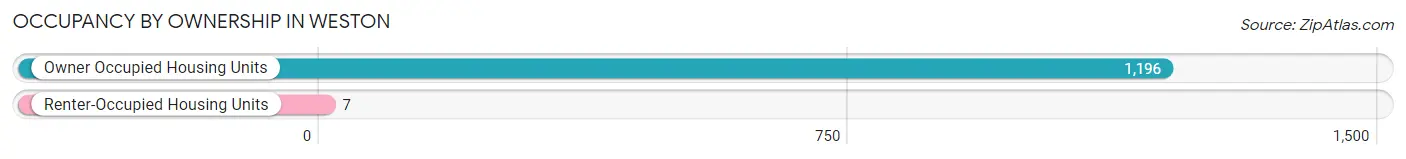
| Occupancy | # Housing Units | % Housing Units |
| Owner Occupied Housing Units | 1,196 | 99.4% |
| Renter-Occupied Housing Units | 7 | 0.6% |
| Total Occupied Housing Units | 1,203 | 100.0% |
Occupancy by Household Size in Weston
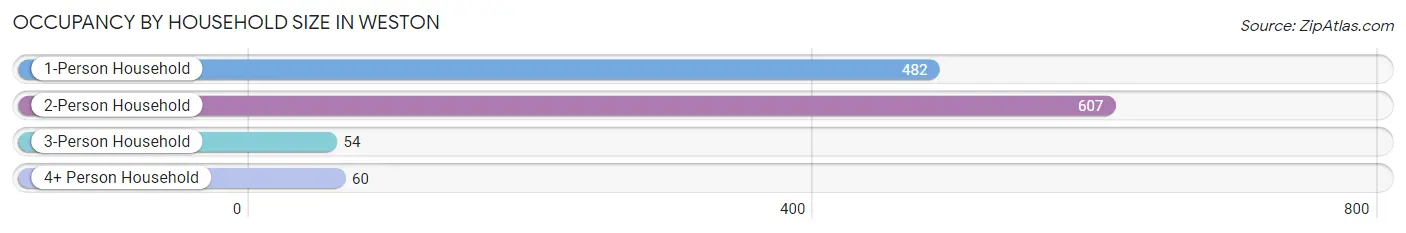
| Household Size | # Housing Units | % Housing Units |
| 1-Person Household | 482 | 40.1% |
| 2-Person Household | 607 | 50.5% |
| 3-Person Household | 54 | 4.5% |
| 4+ Person Household | 60 | 5.0% |
| Total Housing Units | 1,203 | 100.0% |
Occupancy by Ownership by Household Size in Weston
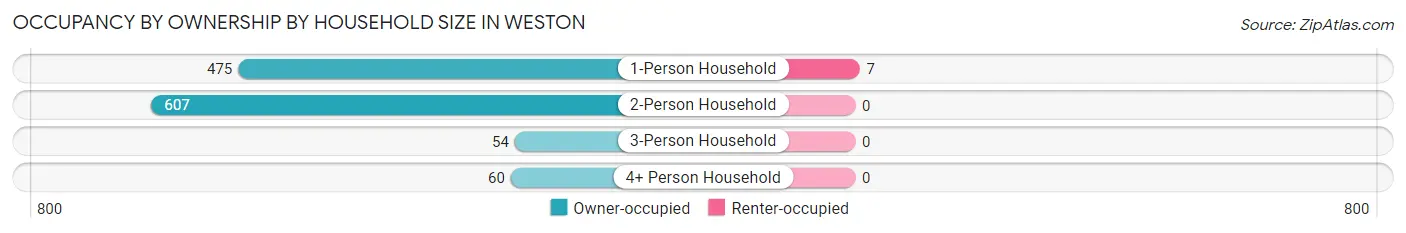
| Household Size | Owner-occupied | Renter-occupied |
| 1-Person Household | 475 (98.6%) | 7 (1.5%) |
| 2-Person Household | 607 (100.0%) | 0 (0.0%) |
| 3-Person Household | 54 (100.0%) | 0 (0.0%) |
| 4+ Person Household | 60 (100.0%) | 0 (0.0%) |
| Total Housing Units | 1,196 (99.4%) | 7 (0.6%) |
Occupancy by Educational Attainment in Weston
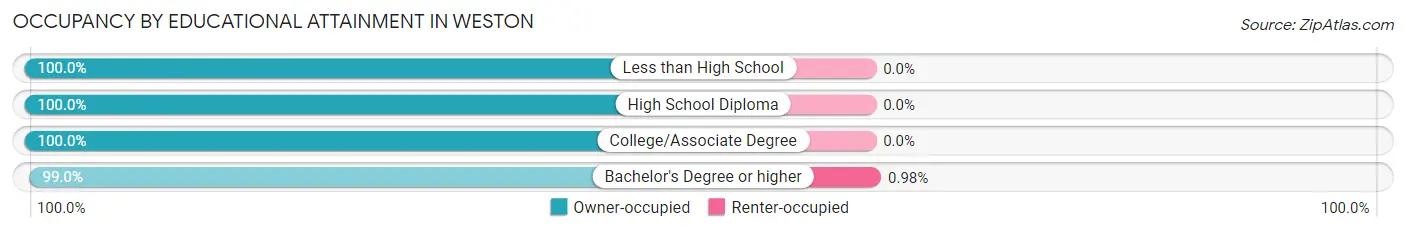
| Household Size | Owner-occupied | Renter-occupied |
| Less than High School | 31 (100.0%) | 0 (0.0%) |
| High School Diploma | 215 (100.0%) | 0 (0.0%) |
| College/Associate Degree | 241 (100.0%) | 0 (0.0%) |
| Bachelor's Degree or higher | 709 (99.0%) | 7 (1.0%) |
Occupancy by Age of Householder in Weston
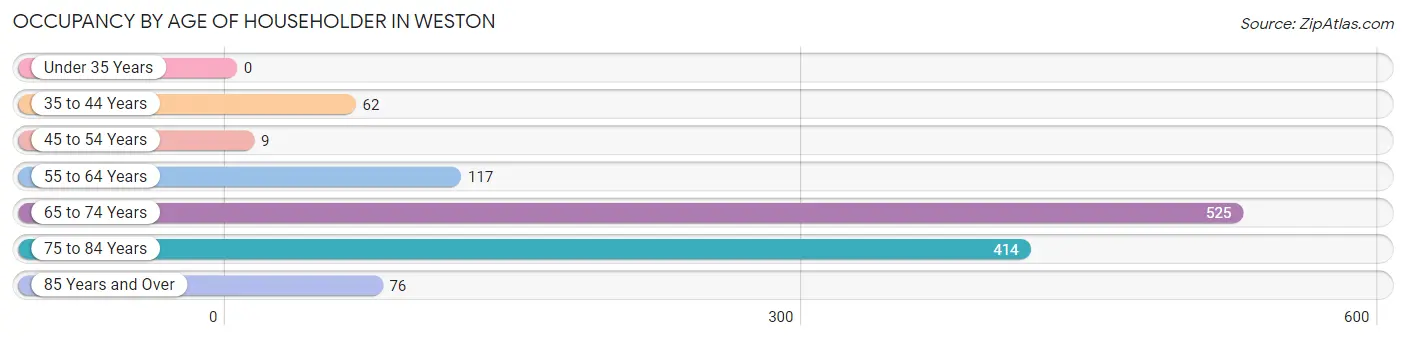
| Age Bracket | # Households | % Households |
| Under 35 Years | 0 | 0.0% |
| 35 to 44 Years | 62 | 5.1% |
| 45 to 54 Years | 9 | 0.7% |
| 55 to 64 Years | 117 | 9.7% |
| 65 to 74 Years | 525 | 43.6% |
| 75 to 84 Years | 414 | 34.4% |
| 85 Years and Over | 76 | 6.3% |
| Total | 1,203 | 100.0% |
Housing Finances in Weston
Median Income by Occupancy in Weston
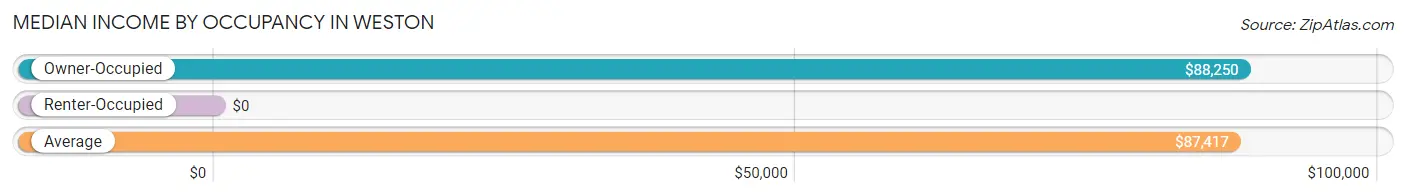
| Occupancy Type | # Households | Median Income |
| Owner-Occupied | 1,196 (99.4%) | $88,250 |
| Renter-Occupied | 7 (0.6%) | $0 |
| Average | 1,203 (100.0%) | $87,417 |
Occupancy by Householder Income Bracket in Weston
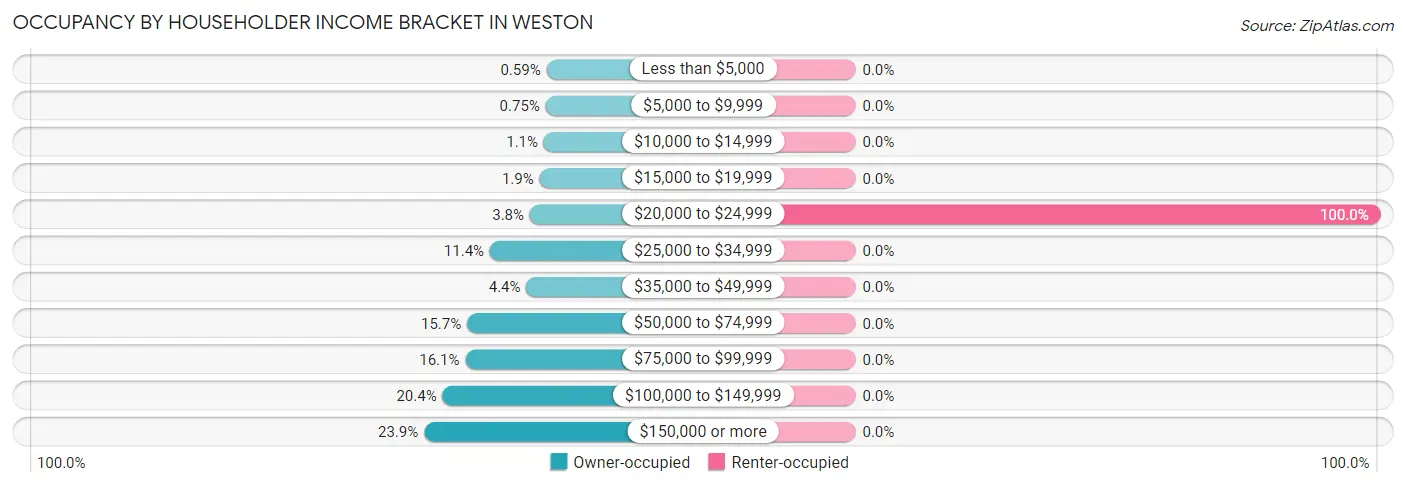
| Income Bracket | Owner-occupied | Renter-occupied |
| Less than $5,000 | 7 (0.6%) | 0 (0.0%) |
| $5,000 to $9,999 | 9 (0.7%) | 0 (0.0%) |
| $10,000 to $14,999 | 13 (1.1%) | 0 (0.0%) |
| $15,000 to $19,999 | 23 (1.9%) | 0 (0.0%) |
| $20,000 to $24,999 | 45 (3.8%) | 7 (100.0%) |
| $25,000 to $34,999 | 136 (11.4%) | 0 (0.0%) |
| $35,000 to $49,999 | 53 (4.4%) | 0 (0.0%) |
| $50,000 to $74,999 | 188 (15.7%) | 0 (0.0%) |
| $75,000 to $99,999 | 192 (16.1%) | 0 (0.0%) |
| $100,000 to $149,999 | 244 (20.4%) | 0 (0.0%) |
| $150,000 or more | 286 (23.9%) | 0 (0.0%) |
| Total | 1,196 (100.0%) | 7 (100.0%) |
Monthly Housing Cost Tiers in Weston
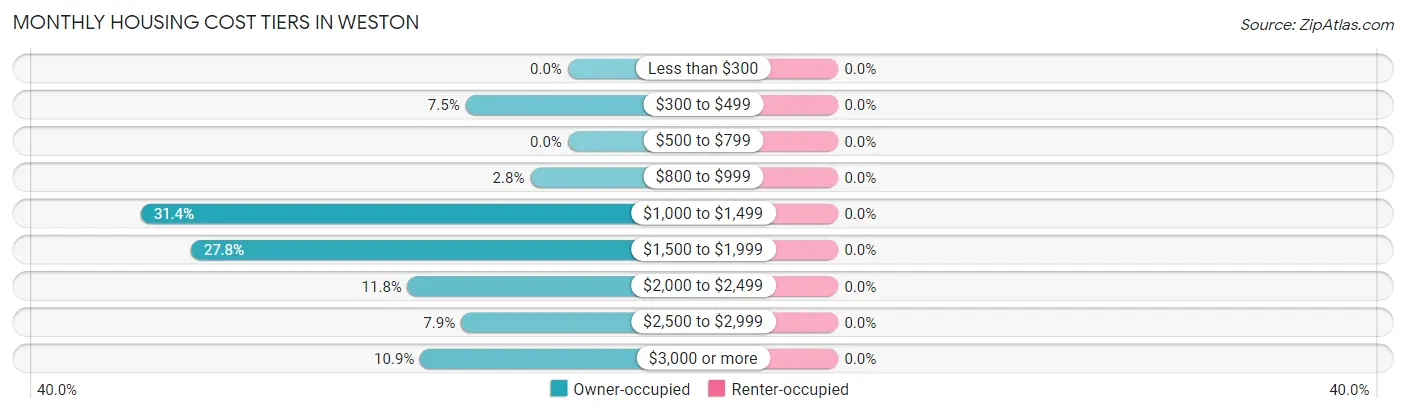
| Monthly Cost | Owner-occupied | Renter-occupied |
| Less than $300 | 0 (0.0%) | 0 (0.0%) |
| $300 to $499 | 90 (7.5%) | 0 (0.0%) |
| $500 to $799 | 0 (0.0%) | 0 (0.0%) |
| $800 to $999 | 33 (2.8%) | 0 (0.0%) |
| $1,000 to $1,499 | 376 (31.4%) | 0 (0.0%) |
| $1,500 to $1,999 | 332 (27.8%) | 0 (0.0%) |
| $2,000 to $2,499 | 141 (11.8%) | 0 (0.0%) |
| $2,500 to $2,999 | 94 (7.9%) | 0 (0.0%) |
| $3,000 or more | 130 (10.9%) | 0 (0.0%) |
| Total | 1,196 (100.0%) | 7 (100.0%) |
Physical Housing Characteristics in Weston
Housing Structures in Weston
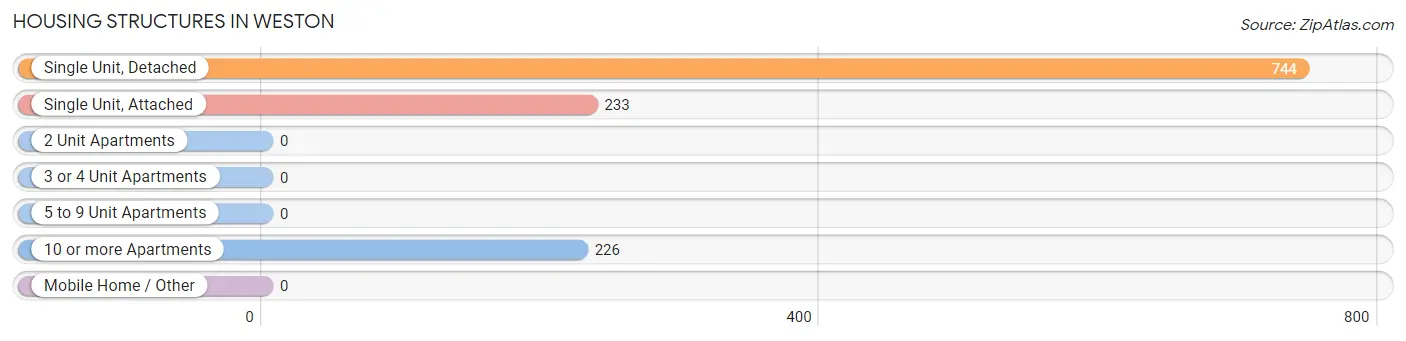
| Structure Type | # Housing Units | % Housing Units |
| Single Unit, Detached | 744 | 61.9% |
| Single Unit, Attached | 233 | 19.4% |
| 2 Unit Apartments | 0 | 0.0% |
| 3 or 4 Unit Apartments | 0 | 0.0% |
| 5 to 9 Unit Apartments | 0 | 0.0% |
| 10 or more Apartments | 226 | 18.8% |
| Mobile Home / Other | 0 | 0.0% |
| Total | 1,203 | 100.0% |
Housing Structures by Occupancy in Weston
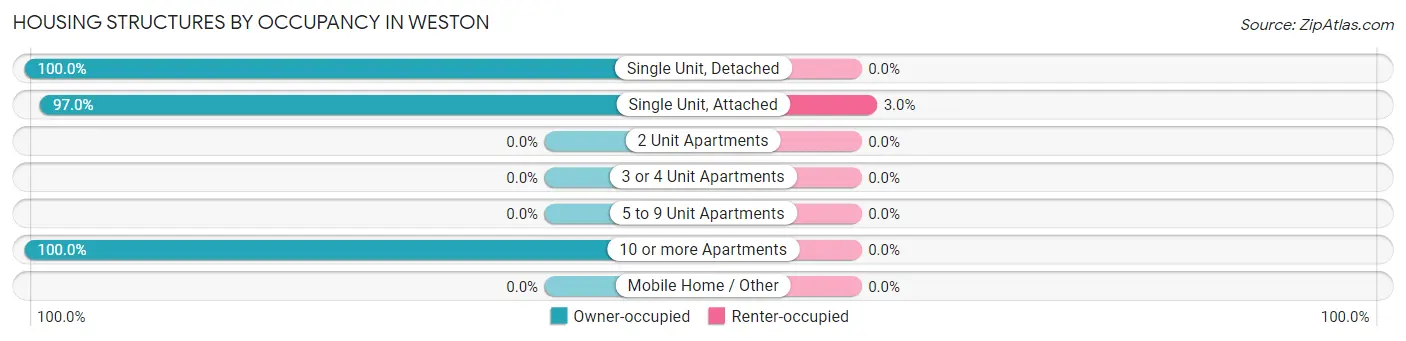
| Structure Type | Owner-occupied | Renter-occupied |
| Single Unit, Detached | 744 (100.0%) | 0 (0.0%) |
| Single Unit, Attached | 226 (97.0%) | 7 (3.0%) |
| 2 Unit Apartments | 0 (0.0%) | 0 (0.0%) |
| 3 or 4 Unit Apartments | 0 (0.0%) | 0 (0.0%) |
| 5 to 9 Unit Apartments | 0 (0.0%) | 0 (0.0%) |
| 10 or more Apartments | 226 (100.0%) | 0 (0.0%) |
| Mobile Home / Other | 0 (0.0%) | 0 (0.0%) |
| Total | 1,196 (99.4%) | 7 (0.6%) |
Housing Structures by Number of Rooms in Weston
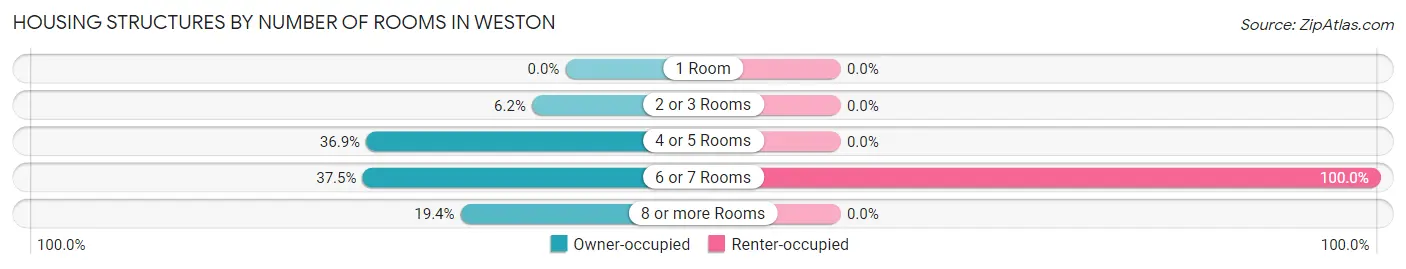
| Number of Rooms | Owner-occupied | Renter-occupied |
| 1 Room | 0 (0.0%) | 0 (0.0%) |
| 2 or 3 Rooms | 74 (6.2%) | 0 (0.0%) |
| 4 or 5 Rooms | 441 (36.9%) | 0 (0.0%) |
| 6 or 7 Rooms | 449 (37.5%) | 7 (100.0%) |
| 8 or more Rooms | 232 (19.4%) | 0 (0.0%) |
| Total | 1,196 (100.0%) | 7 (100.0%) |
Housing Structure by Heating Type in Weston
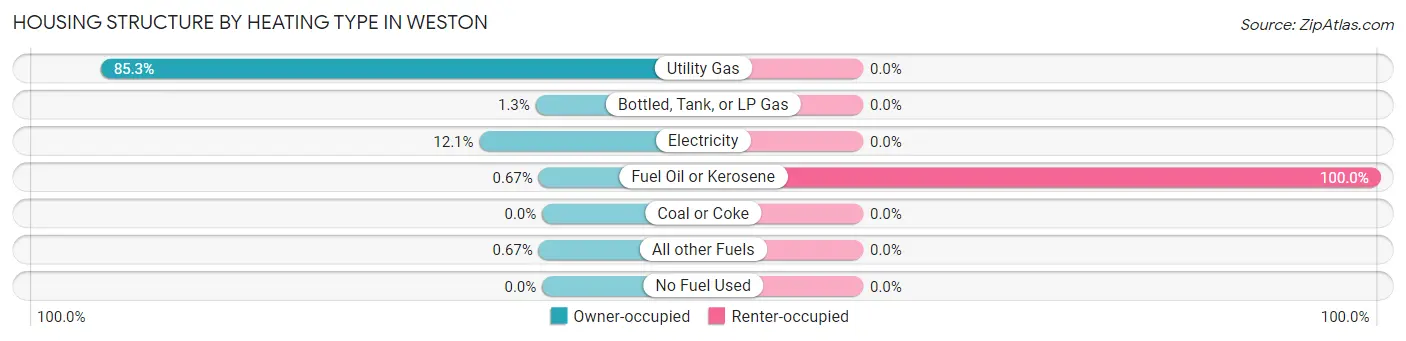
| Heating Type | Owner-occupied | Renter-occupied |
| Utility Gas | 1,020 (85.3%) | 0 (0.0%) |
| Bottled, Tank, or LP Gas | 15 (1.3%) | 0 (0.0%) |
| Electricity | 145 (12.1%) | 0 (0.0%) |
| Fuel Oil or Kerosene | 8 (0.7%) | 7 (100.0%) |
| Coal or Coke | 0 (0.0%) | 0 (0.0%) |
| All other Fuels | 8 (0.7%) | 0 (0.0%) |
| No Fuel Used | 0 (0.0%) | 0 (0.0%) |
| Total | 1,196 (100.0%) | 7 (100.0%) |
Household Vehicle Usage in Weston
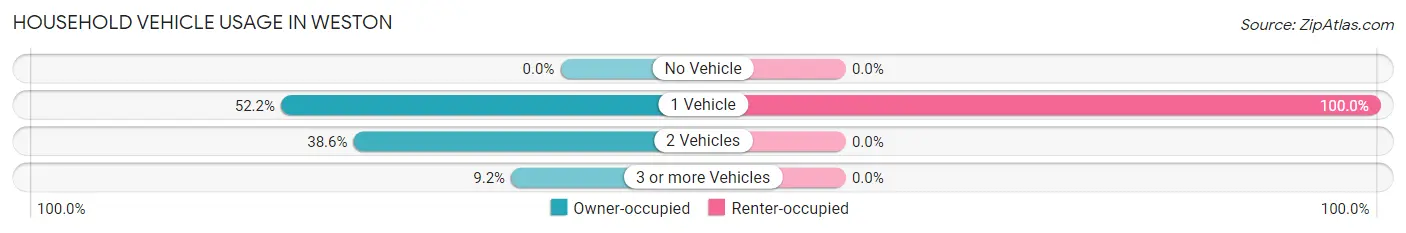
| Vehicles per Household | Owner-occupied | Renter-occupied |
| No Vehicle | 0 (0.0%) | 0 (0.0%) |
| 1 Vehicle | 624 (52.2%) | 7 (100.0%) |
| 2 Vehicles | 462 (38.6%) | 0 (0.0%) |
| 3 or more Vehicles | 110 (9.2%) | 0 (0.0%) |
| Total | 1,196 (100.0%) | 7 (100.0%) |
Real Estate & Mortgages in Weston
Real Estate and Mortgage Overview in Weston
| Characteristic | Without Mortgage | With Mortgage |
| Housing Units | 745 | 451 |
| Median Property Value | $551,200 | $533,200 |
| Median Household Income | $89,875 | $134 |
| Monthly Housing Costs | $1,383 | $130 |
| Real Estate Taxes | $10,001 | $0 |
Property Value by Mortgage Status in Weston
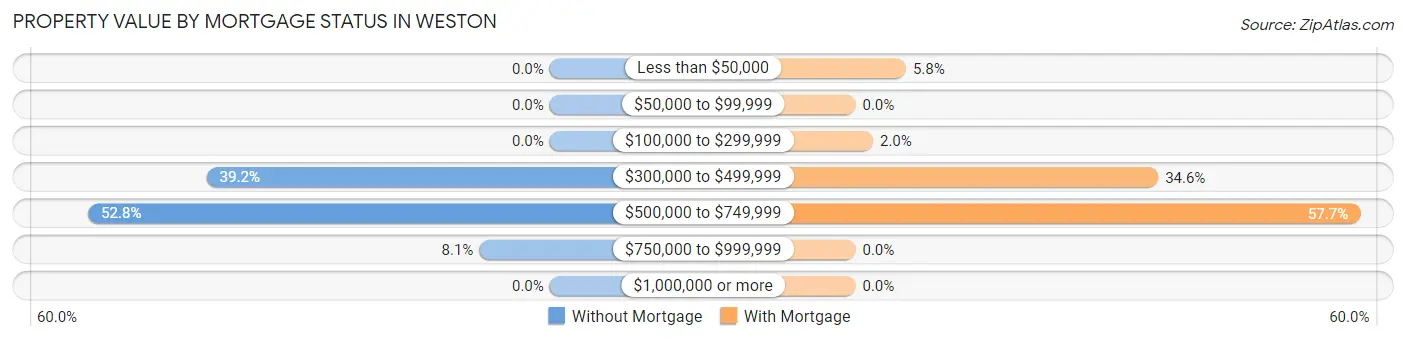
| Property Value | Without Mortgage | With Mortgage |
| Less than $50,000 | 0 (0.0%) | 26 (5.8%) |
| $50,000 to $99,999 | 0 (0.0%) | 0 (0.0%) |
| $100,000 to $299,999 | 0 (0.0%) | 9 (2.0%) |
| $300,000 to $499,999 | 292 (39.2%) | 156 (34.6%) |
| $500,000 to $749,999 | 393 (52.7%) | 260 (57.7%) |
| $750,000 to $999,999 | 60 (8.1%) | 0 (0.0%) |
| $1,000,000 or more | 0 (0.0%) | 0 (0.0%) |
| Total | 745 (100.0%) | 451 (100.0%) |
Household Income by Mortgage Status in Weston
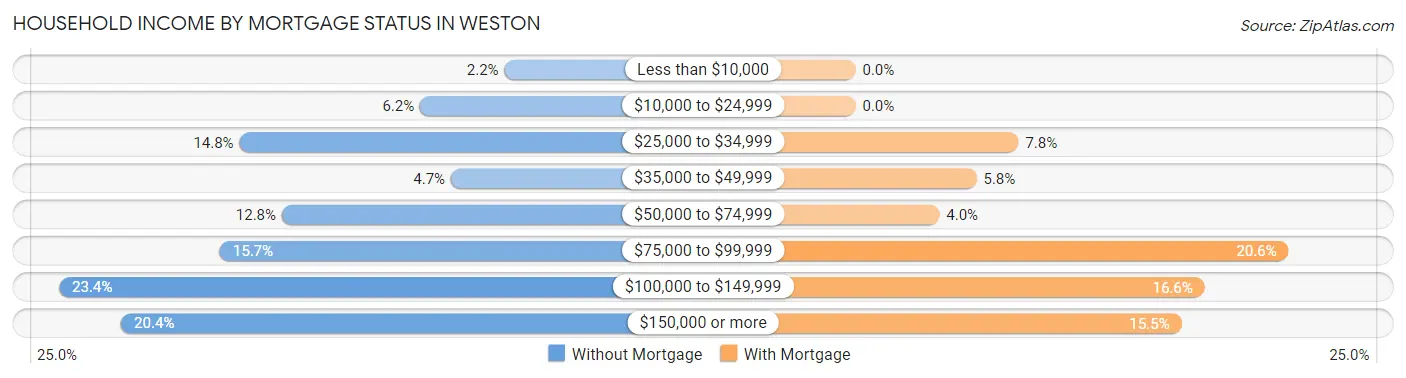
| Household Income | Without Mortgage | With Mortgage |
| Less than $10,000 | 16 (2.1%) | 0 (0.0%) |
| $10,000 to $24,999 | 46 (6.2%) | 0 (0.0%) |
| $25,000 to $34,999 | 110 (14.8%) | 35 (7.8%) |
| $35,000 to $49,999 | 35 (4.7%) | 26 (5.8%) |
| $50,000 to $74,999 | 95 (12.8%) | 18 (4.0%) |
| $75,000 to $99,999 | 117 (15.7%) | 93 (20.6%) |
| $100,000 to $149,999 | 174 (23.4%) | 75 (16.6%) |
| $150,000 or more | 152 (20.4%) | 70 (15.5%) |
| Total | 745 (100.0%) | 451 (100.0%) |
Property Value to Household Income Ratio in Weston
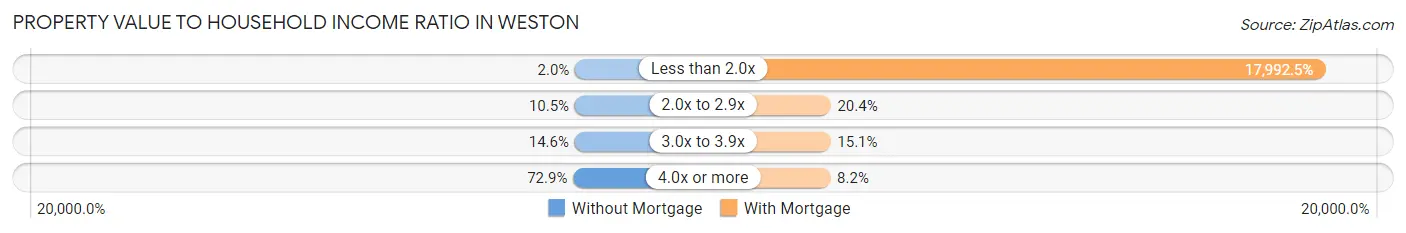
| Value-to-Income Ratio | Without Mortgage | With Mortgage |
| Less than 2.0x | 15 (2.0%) | 81,146 (17,992.5%) |
| 2.0x to 2.9x | 78 (10.5%) | 92 (20.4%) |
| 3.0x to 3.9x | 109 (14.6%) | 68 (15.1%) |
| 4.0x or more | 543 (72.9%) | 37 (8.2%) |
| Total | 745 (100.0%) | 451 (100.0%) |
Real Estate Taxes by Mortgage Status in Weston
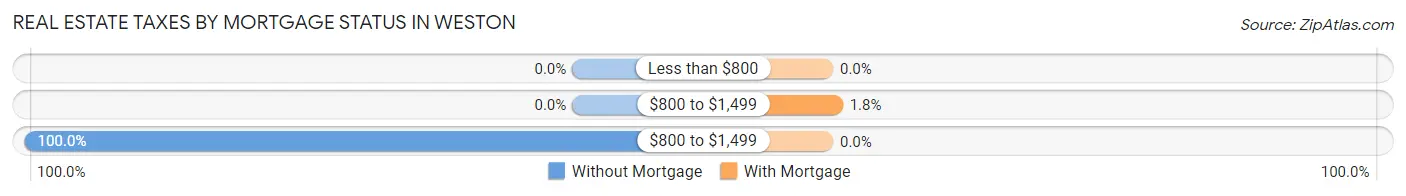
| Property Taxes | Without Mortgage | With Mortgage |
| Less than $800 | 0 (0.0%) | 0 (0.0%) |
| $800 to $1,499 | 0 (0.0%) | 8 (1.8%) |
| $800 to $1,499 | 745 (100.0%) | 0 (0.0%) |
| Total | 745 (100.0%) | 451 (100.0%) |
Health & Disability in Weston
Health Insurance Coverage by Age in Weston
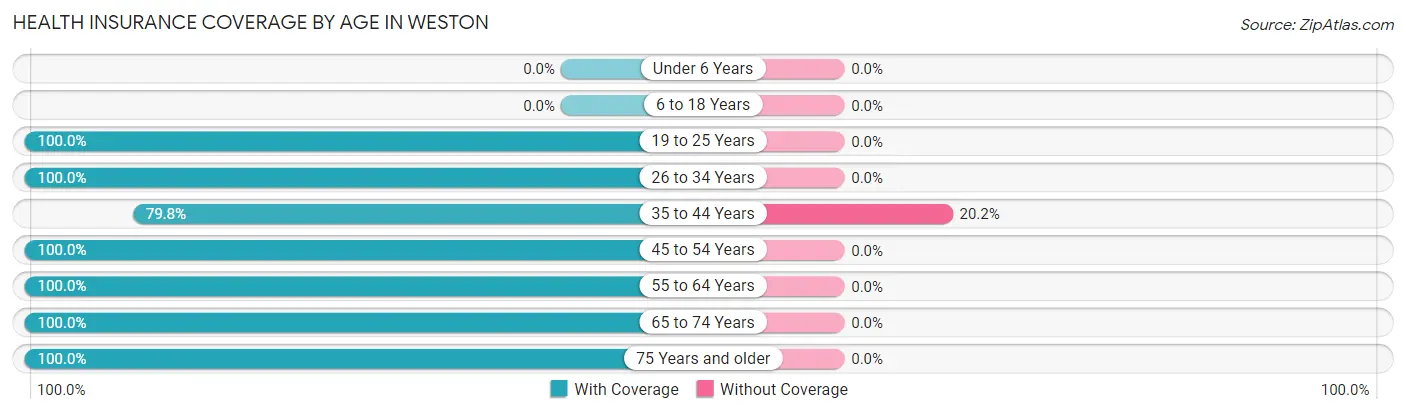
| Age Bracket | With Coverage | Without Coverage |
| Under 6 Years | 0 (0.0%) | 0 (0.0%) |
| 6 to 18 Years | 0 (0.0%) | 0 (0.0%) |
| 19 to 25 Years | 16 (100.0%) | 0 (0.0%) |
| 26 to 34 Years | 104 (100.0%) | 0 (0.0%) |
| 35 to 44 Years | 91 (79.8%) | 23 (20.2%) |
| 45 to 54 Years | 21 (100.0%) | 0 (0.0%) |
| 55 to 64 Years | 271 (100.0%) | 0 (0.0%) |
| 65 to 74 Years | 931 (100.0%) | 0 (0.0%) |
| 75 Years and older | 687 (100.0%) | 0 (0.0%) |
| Total | 2,121 (98.9%) | 23 (1.1%) |
Health Insurance Coverage by Citizenship Status in Weston
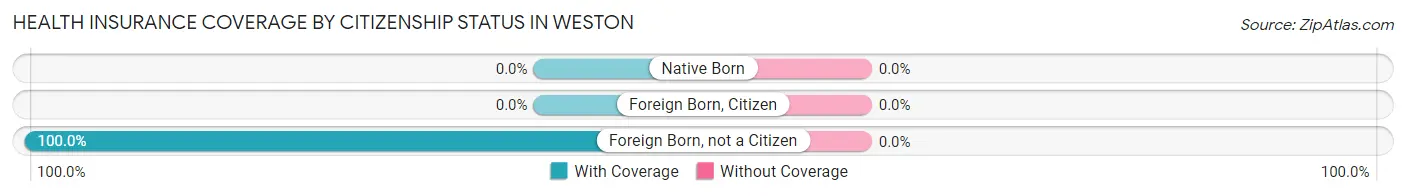
| Citizenship Status | With Coverage | Without Coverage |
| Native Born | 0 (0.0%) | 0 (0.0%) |
| Foreign Born, Citizen | 0 (0.0%) | 0 (0.0%) |
| Foreign Born, not a Citizen | 16 (100.0%) | 0 (0.0%) |
Health Insurance Coverage by Household Income in Weston
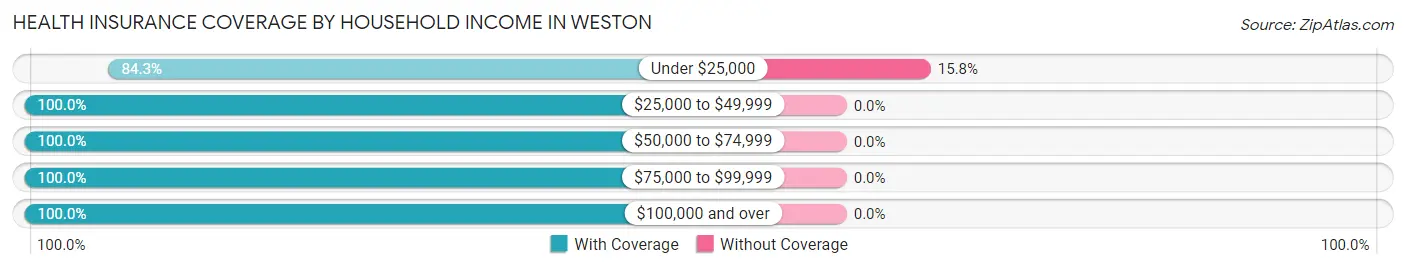
| Household Income | With Coverage | Without Coverage |
| Under $25,000 | 123 (84.3%) | 23 (15.8%) |
| $25,000 to $49,999 | 208 (100.0%) | 0 (0.0%) |
| $50,000 to $74,999 | 242 (100.0%) | 0 (0.0%) |
| $75,000 to $99,999 | 367 (100.0%) | 0 (0.0%) |
| $100,000 and over | 1,181 (100.0%) | 0 (0.0%) |
Public vs Private Health Insurance Coverage by Age in Weston
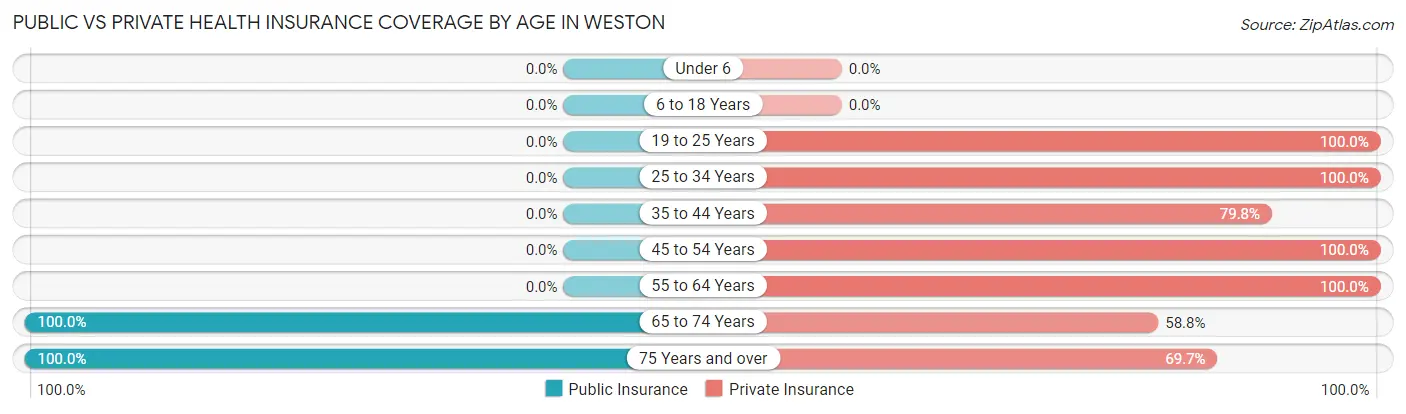
| Age Bracket | Public Insurance | Private Insurance |
| Under 6 | 0 (0.0%) | 0 (0.0%) |
| 6 to 18 Years | 0 (0.0%) | 0 (0.0%) |
| 19 to 25 Years | 0 (0.0%) | 16 (100.0%) |
| 25 to 34 Years | 0 (0.0%) | 104 (100.0%) |
| 35 to 44 Years | 0 (0.0%) | 91 (79.8%) |
| 45 to 54 Years | 0 (0.0%) | 21 (100.0%) |
| 55 to 64 Years | 0 (0.0%) | 271 (100.0%) |
| 65 to 74 Years | 931 (100.0%) | 547 (58.8%) |
| 75 Years and over | 687 (100.0%) | 479 (69.7%) |
| Total | 1,618 (75.5%) | 1,529 (71.3%) |
Disability Status by Sex by Age in Weston
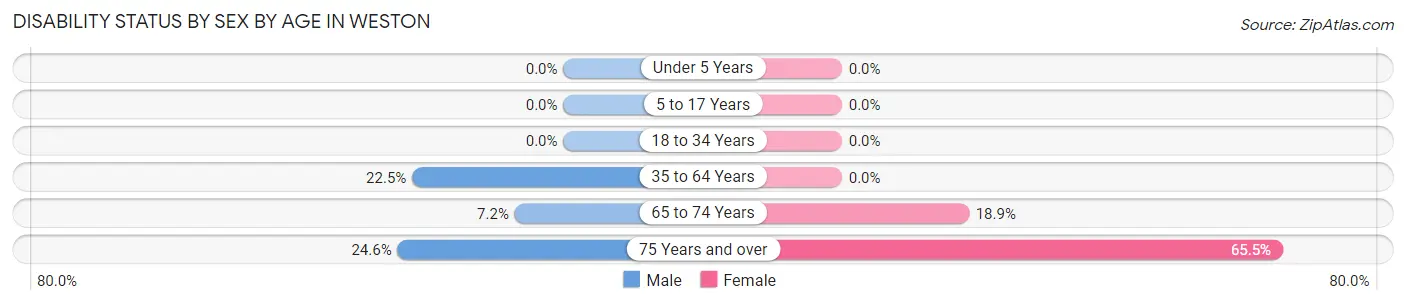
| Age Bracket | Male | Female |
| Under 5 Years | 0 (0.0%) | 0 (0.0%) |
| 5 to 17 Years | 0 (0.0%) | 0 (0.0%) |
| 18 to 34 Years | 0 (0.0%) | 0 (0.0%) |
| 35 to 64 Years | 22 (22.5%) | 0 (0.0%) |
| 65 to 74 Years | 27 (7.2%) | 105 (18.9%) |
| 75 Years and over | 50 (24.6%) | 317 (65.5%) |
Disability Class by Sex by Age in Weston
Disability Class: Hearing Difficulty
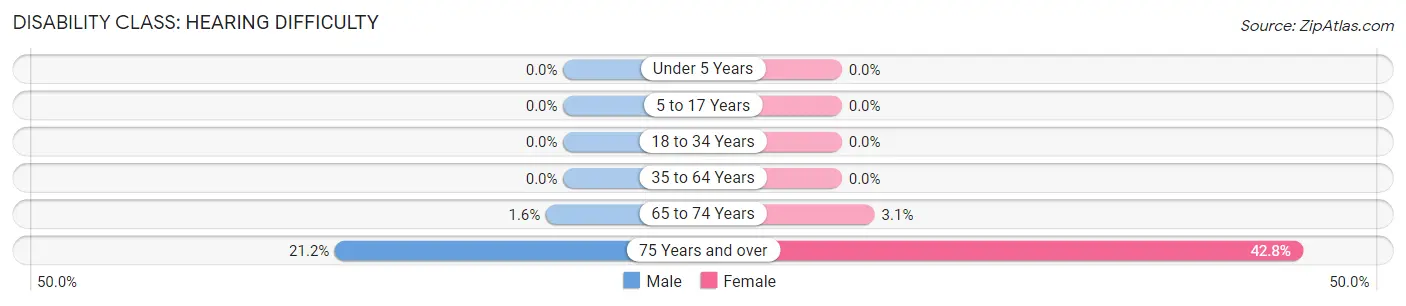
| Age Bracket | Male | Female |
| Under 5 Years | 0 (0.0%) | 0 (0.0%) |
| 5 to 17 Years | 0 (0.0%) | 0 (0.0%) |
| 18 to 34 Years | 0 (0.0%) | 0 (0.0%) |
| 35 to 64 Years | 0 (0.0%) | 0 (0.0%) |
| 65 to 74 Years | 6 (1.6%) | 17 (3.0%) |
| 75 Years and over | 43 (21.2%) | 207 (42.8%) |
Disability Class: Vision Difficulty
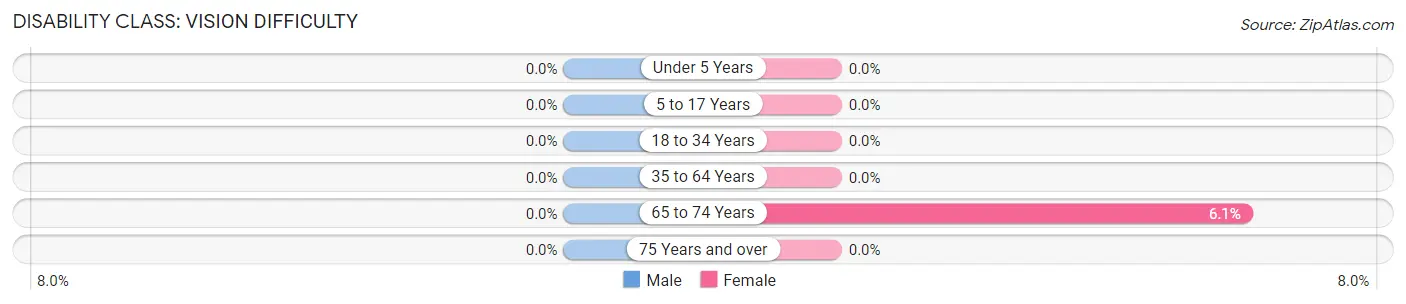
| Age Bracket | Male | Female |
| Under 5 Years | 0 (0.0%) | 0 (0.0%) |
| 5 to 17 Years | 0 (0.0%) | 0 (0.0%) |
| 18 to 34 Years | 0 (0.0%) | 0 (0.0%) |
| 35 to 64 Years | 0 (0.0%) | 0 (0.0%) |
| 65 to 74 Years | 0 (0.0%) | 34 (6.1%) |
| 75 Years and over | 0 (0.0%) | 0 (0.0%) |
Disability Class: Cognitive Difficulty
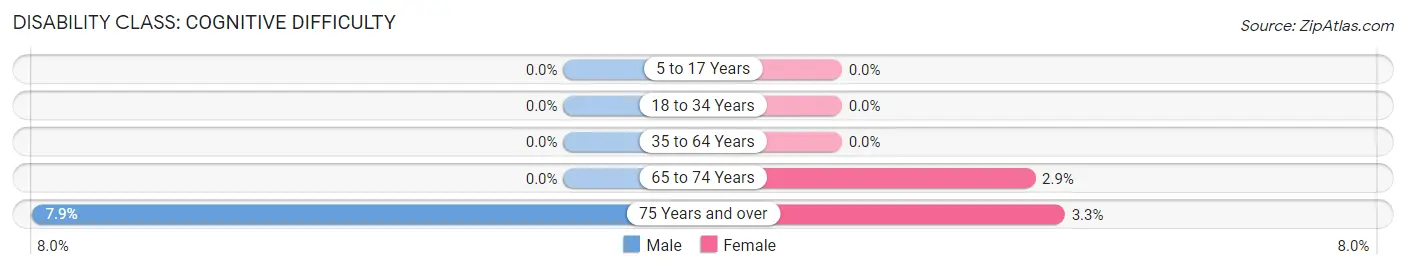
| Age Bracket | Male | Female |
| 5 to 17 Years | 0 (0.0%) | 0 (0.0%) |
| 18 to 34 Years | 0 (0.0%) | 0 (0.0%) |
| 35 to 64 Years | 0 (0.0%) | 0 (0.0%) |
| 65 to 74 Years | 0 (0.0%) | 16 (2.9%) |
| 75 Years and over | 16 (7.9%) | 16 (3.3%) |
Disability Class: Ambulatory Difficulty
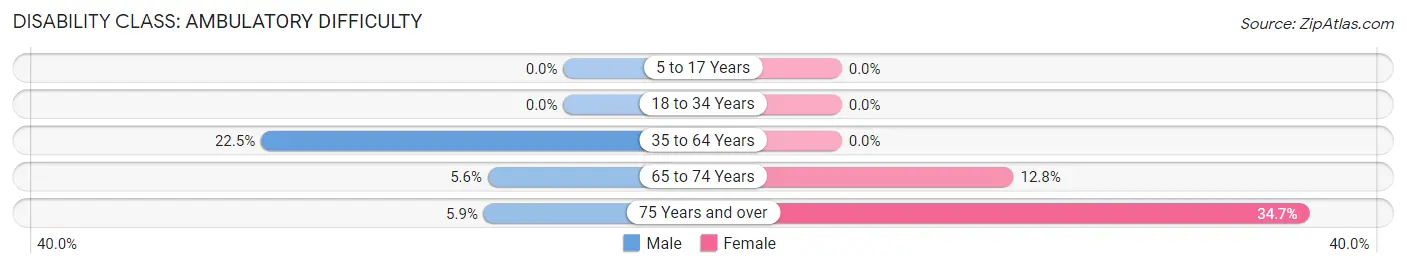
| Age Bracket | Male | Female |
| 5 to 17 Years | 0 (0.0%) | 0 (0.0%) |
| 18 to 34 Years | 0 (0.0%) | 0 (0.0%) |
| 35 to 64 Years | 22 (22.5%) | 0 (0.0%) |
| 65 to 74 Years | 21 (5.6%) | 71 (12.8%) |
| 75 Years and over | 12 (5.9%) | 168 (34.7%) |
Disability Class: Self-Care Difficulty
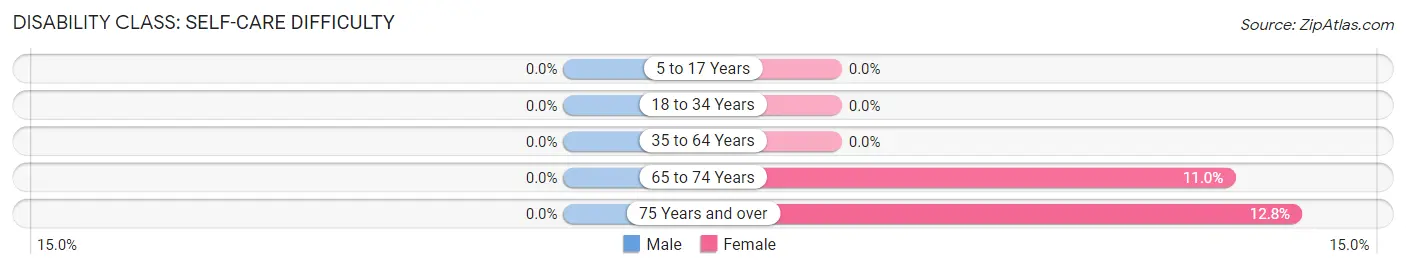
| Age Bracket | Male | Female |
| 5 to 17 Years | 0 (0.0%) | 0 (0.0%) |
| 18 to 34 Years | 0 (0.0%) | 0 (0.0%) |
| 35 to 64 Years | 0 (0.0%) | 0 (0.0%) |
| 65 to 74 Years | 0 (0.0%) | 61 (11.0%) |
| 75 Years and over | 0 (0.0%) | 62 (12.8%) |
Technology Access in Weston
Computing Device Access in Weston
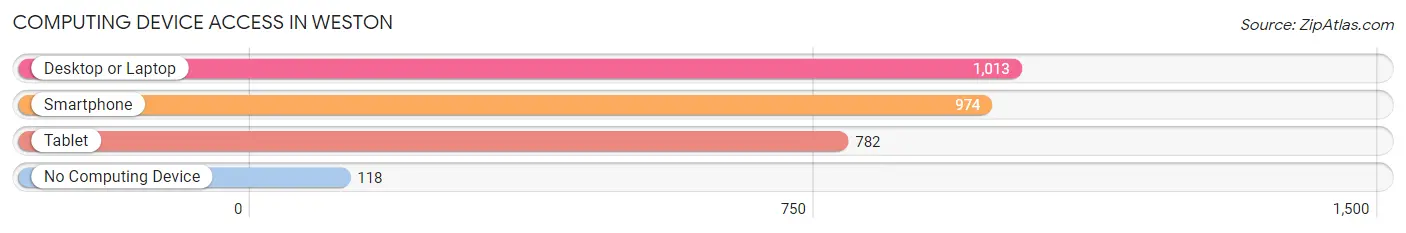
| Device Type | # Households | % Households |
| Desktop or Laptop | 1,013 | 84.2% |
| Smartphone | 974 | 81.0% |
| Tablet | 782 | 65.0% |
| No Computing Device | 118 | 9.8% |
| Total | 1,203 | 100.0% |
Internet Access in Weston
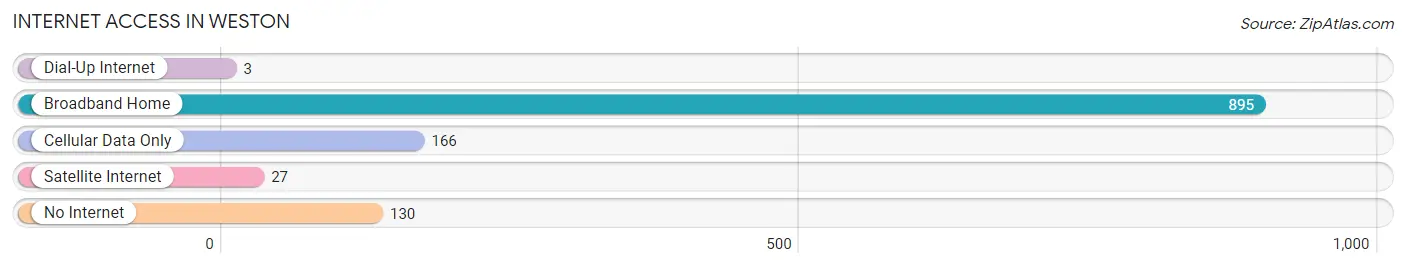
| Internet Type | # Households | % Households |
| Dial-Up Internet | 3 | 0.3% |
| Broadband Home | 895 | 74.4% |
| Cellular Data Only | 166 | 13.8% |
| Satellite Internet | 27 | 2.2% |
| No Internet | 130 | 10.8% |
| Total | 1,203 | 100.0% |
Weston Summary
Weston is a small borough located in the state of New Jersey. It is situated in the northern part of the state, in Morris County, and is part of the New York metropolitan area. The borough has a population of approximately 1,400 people, and is known for its rural charm and small-town atmosphere.
Geography
Weston is located in the northern part of Morris County, New Jersey. It is bordered by the towns of Mendham, Chester, and Washington. The borough is situated on the western side of the Musconetcong River, and is surrounded by rolling hills and woodlands. The borough covers an area of 1.2 square miles, and is located approximately 40 miles from New York City.
Climate
Weston has a humid continental climate, with hot, humid summers and cold, snowy winters. The average temperature in the summer months is around 75 degrees Fahrenheit, while in the winter months it is around 30 degrees Fahrenheit. The average annual precipitation is around 40 inches.
Demographics
As of the 2010 census, the population of Weston was 1,400 people. The racial makeup of the borough was 94.3% White, 1.3% African American, 0.2% Native American, 1.3% Asian, and 2.9% from other races. The median household income was $90,000, and the median family income was $105,000.
Economy
Weston is a small, rural borough, and the economy is largely based on agriculture and tourism. The borough is home to several farms, which produce a variety of fruits and vegetables. The borough also has several small businesses, including restaurants, shops, and other services. Tourism is also an important part of the local economy, as the borough is home to several historic sites and attractions.
History
Weston was first settled in the late 1700s by a group of Dutch settlers. The borough was officially incorporated in 1872, and was named after the Weston family, who were among the first settlers. The borough was largely agricultural in its early years, and the economy was based on farming and lumbering. In the late 19th century, the borough began to develop as a tourist destination, and several hotels and resorts were built in the area. The borough has remained largely rural and agricultural, and has retained its small-town charm.
Conclusion
Weston is a small borough located in the northern part of Morris County, New Jersey. It has a population of approximately 1,400 people, and is known for its rural charm and small-town atmosphere. The economy is largely based on agriculture and tourism, and the borough is home to several farms and historic sites. Weston has retained its small-town charm, and is a popular destination for visitors looking for a peaceful, rural getaway.
Common Questions
What is Per Capita Income in Weston?
Per Capita income in Weston is $63,867.
What is the Median Family Income in Weston?
Median Family Income in Weston is $121,653.
What is the Median Household income in Weston?
Median Household Income in Weston is $87,417.
What is Inequality or Gini Index in Weston?
Inequality or Gini Index in Weston is 0.41.
What is the Total Population of Weston?
Total Population of Weston is 2,144.
What is the Total Male Population of Weston?
Total Male Population of Weston is 675.
What is the Total Female Population of Weston?
Total Female Population of Weston is 1,469.
What is the Ratio of Males per 100 Females in Weston?
There are 45.95 Males per 100 Females in Weston.
What is the Ratio of Females per 100 Males in Weston?
There are 217.63 Females per 100 Males in Weston.
What is the Median Population Age in Weston?
Median Population Age in Weston is 71.5 Years.
What is the Average Family Size in Weston
Average Family Size in Weston is 2.3 People.
What is the Average Household Size in Weston
Average Household Size in Weston is 1.8 People.
How Large is the Labor Force in Weston?
There are 656 People in the Labor Forcein in Weston.
What is the Percentage of People in the Labor Force in Weston?
30.6% of People are in the Labor Force in Weston.
What is the Unemployment Rate in Weston?
Unemployment Rate in Weston is 4.7%.