Paramus borough, NJ Map & Demographics
Paramus borough Overview
$55,747
PER CAPITA INCOME
$153,422
AVG FAMILY INCOME
$136,824
AVG HOUSEHOLD INCOME
24.0%
WAGE / INCOME GAP [ % ]
76.0¢/ $1
WAGE / INCOME GAP [ $ ]
0.43
INEQUALITY / GINI INDEX
26,582
TOTAL POPULATION
13,262
MALE POPULATION
13,320
FEMALE POPULATION
99.56
MALES / 100 FEMALES
100.44
FEMALES / 100 MALES
49.0
MEDIAN AGE
3.4
AVG FAMILY SIZE
3.0
AVG HOUSEHOLD SIZE
13,208
LABOR FORCE [ PEOPLE ]
59.0%
PERCENT IN LABOR FORCE
7.6%
UNEMPLOYMENT RATE
Income in Paramus borough
Income Overview in Paramus borough
Per Capita Income in Paramus borough is $55,747, while median incomes of families and households are $153,422 and $136,824 respectively.
| Characteristic | Number | Measure |
| Per Capita Income | 26,582 | $55,747 |
| Median Family Income | 6,711 | $153,422 |
| Mean Family Income | 6,711 | $188,681 |
| Median Household Income | 8,410 | $136,824 |
| Mean Household Income | 8,410 | $168,824 |
| Income Deficit | 6,711 | $0 |
| Wage / Income Gap (%) | 26,582 | 23.96% |
| Wage / Income Gap ($) | 26,582 | 76.04¢ per $1 |
| Gini / Inequality Index | 26,582 | 0.43 |
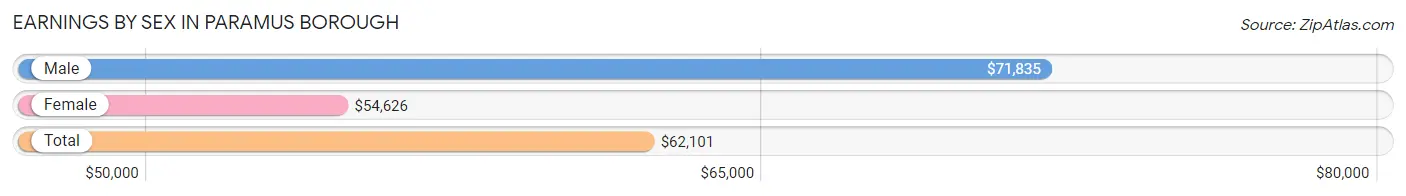
Earnings by Sex in Paramus borough
Average Earnings in Paramus borough are $62,101, $71,835 for men and $54,626 for women, a difference of 24.0%.
| Sex | Number | Average Earnings |
| Male | 7,428 (54.5%) | $71,835 |
| Female | 6,197 (45.5%) | $54,626 |
| Total | 13,625 (100.0%) | $62,101 |
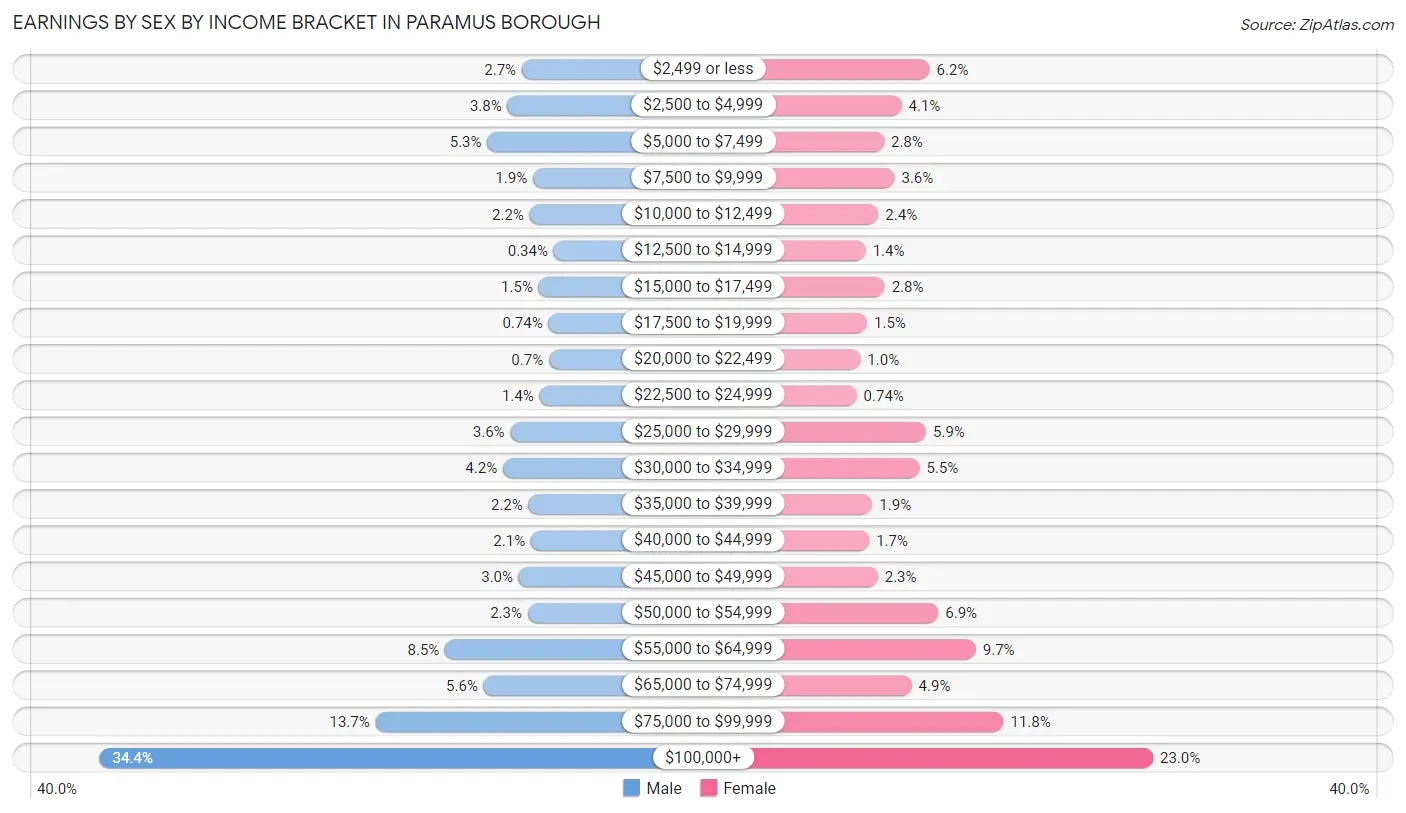
Earnings by Sex by Income Bracket in Paramus borough
The most common earnings brackets in Paramus borough are $100,000+ for men (2,554 | 34.4%) and $100,000+ for women (1,422 | 23.0%).
| Income | Male | Female |
| $2,499 or less | 203 (2.7%) | 385 (6.2%) |
| $2,500 to $4,999 | 283 (3.8%) | 255 (4.1%) |
| $5,000 to $7,499 | 395 (5.3%) | 173 (2.8%) |
| $7,500 to $9,999 | 141 (1.9%) | 222 (3.6%) |
| $10,000 to $12,499 | 160 (2.1%) | 147 (2.4%) |
| $12,500 to $14,999 | 25 (0.3%) | 88 (1.4%) |
| $15,000 to $17,499 | 109 (1.5%) | 176 (2.8%) |
| $17,500 to $19,999 | 55 (0.7%) | 94 (1.5%) |
| $20,000 to $22,499 | 52 (0.7%) | 63 (1.0%) |
| $22,500 to $24,999 | 105 (1.4%) | 46 (0.7%) |
| $25,000 to $29,999 | 267 (3.6%) | 368 (5.9%) |
| $30,000 to $34,999 | 308 (4.2%) | 338 (5.4%) |
| $35,000 to $39,999 | 166 (2.2%) | 119 (1.9%) |
| $40,000 to $44,999 | 152 (2.1%) | 104 (1.7%) |
| $45,000 to $49,999 | 220 (3.0%) | 144 (2.3%) |
| $50,000 to $54,999 | 170 (2.3%) | 425 (6.9%) |
| $55,000 to $64,999 | 630 (8.5%) | 599 (9.7%) |
| $65,000 to $74,999 | 415 (5.6%) | 301 (4.9%) |
| $75,000 to $99,999 | 1,018 (13.7%) | 728 (11.7%) |
| $100,000+ | 2,554 (34.4%) | 1,422 (23.0%) |
| Total | 7,428 (100.0%) | 6,197 (100.0%) |
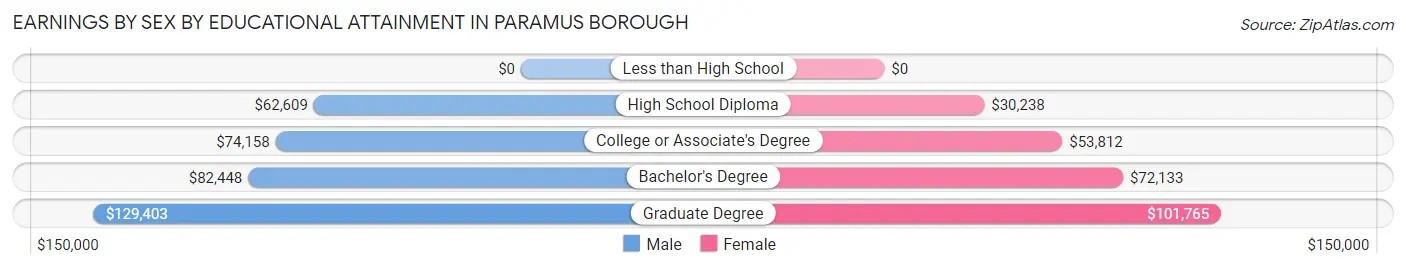
Earnings by Sex by Educational Attainment in Paramus borough
Average earnings in Paramus borough are $80,299 for men and $60,018 for women, a difference of 25.3%. Men with an educational attainment of graduate degree enjoy the highest average annual earnings of $129,403, while those with high school diploma education earn the least with $62,609. Women with an educational attainment of graduate degree earn the most with the average annual earnings of $101,765, while those with high school diploma education have the smallest earnings of $30,238.
| Educational Attainment | Male Income | Female Income |
| Less than High School | - | - |
| High School Diploma | $62,609 | $30,238 |
| College or Associate's Degree | $74,158 | $53,812 |
| Bachelor's Degree | $82,448 | $72,133 |
| Graduate Degree | $129,403 | $101,765 |
| Total | $80,299 | $60,018 |
Family Income in Paramus borough
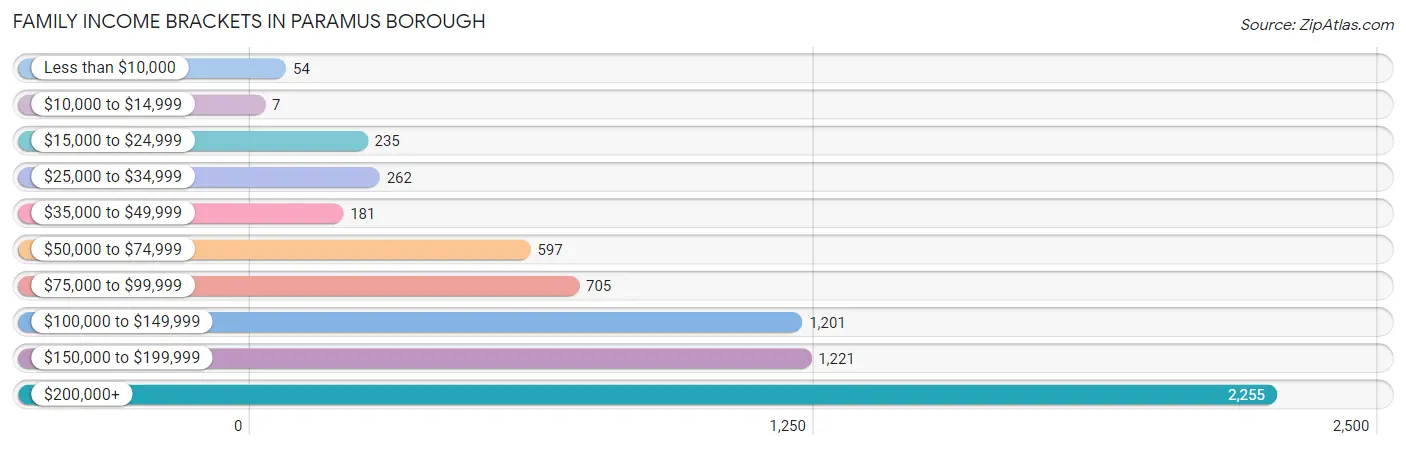
Family Income Brackets in Paramus borough
According to the Paramus borough family income data, there are 2,255 families falling into the $200,000+ income range, which is the most common income bracket and makes up 33.6% of all families. Conversely, the $10,000 to $14,999 income bracket is the least frequent group with only 7 families (0.1%) belonging to this category.
| Income Bracket | # Families | % Families |
| Less than $10,000 | 54 | 0.8% |
| $10,000 to $14,999 | 7 | 0.1% |
| $15,000 to $24,999 | 235 | 3.5% |
| $25,000 to $34,999 | 262 | 3.9% |
| $35,000 to $49,999 | 181 | 2.7% |
| $50,000 to $74,999 | 597 | 8.9% |
| $75,000 to $99,999 | 705 | 10.5% |
| $100,000 to $149,999 | 1,201 | 17.9% |
| $150,000 to $199,999 | 1,221 | 18.2% |
| $200,000+ | 2,255 | 33.6% |
Family Income by Famaliy Size in Paramus borough
5-person families (586 | 8.7%) account for the highest median family income in Paramus borough with $212,297 per family, while 3-person families (1,697 | 25.3%) have the highest median income of $53,997 per family member.

| Income Bracket | # Families | Median Income |
| 2-Person Families | 2,276 (33.9%) | $96,667 |
| 3-Person Families | 1,697 (25.3%) | $161,992 |
| 4-Person Families | 1,785 (26.6%) | $189,321 |
| 5-Person Families | 586 (8.7%) | $212,297 |
| 6-Person Families | 210 (3.1%) | $204,722 |
| 7+ Person Families | 157 (2.3%) | $102,008 |
| Total | 6,711 (100.0%) | $153,422 |
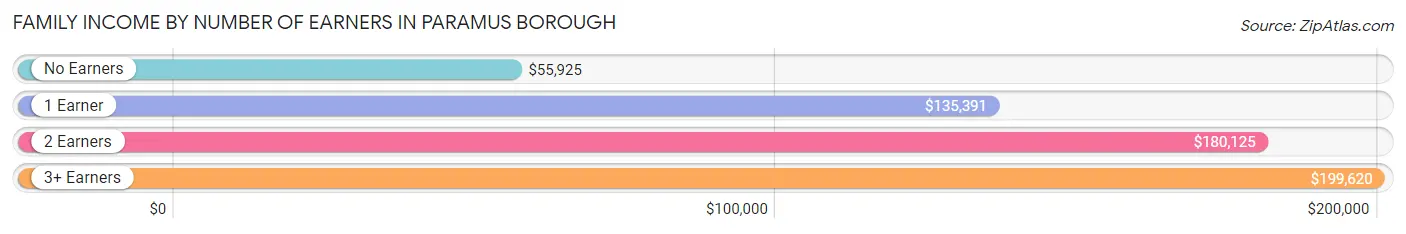
Family Income by Number of Earners in Paramus borough
The median family income in Paramus borough is $153,422, with families comprising 3+ earners (1,606) having the highest median family income of $199,620, while families with no earners (1,145) have the lowest median family income of $55,925, accounting for 23.9% and 17.1% of families, respectively.
| Number of Earners | # Families | Median Income |
| No Earners | 1,145 (17.1%) | $55,925 |
| 1 Earner | 1,473 (22.0%) | $135,391 |
| 2 Earners | 2,487 (37.1%) | $180,125 |
| 3+ Earners | 1,606 (23.9%) | $199,620 |
| Total | 6,711 (100.0%) | $153,422 |
Household Income in Paramus borough
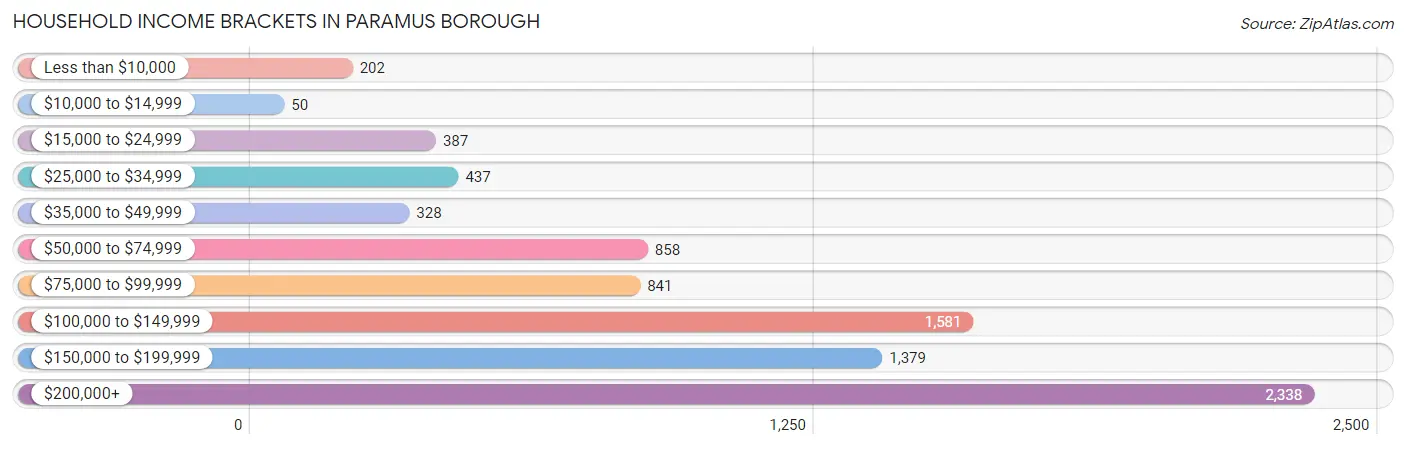
Household Income Brackets in Paramus borough
With 2,338 households falling in the category, the $200,000+ income range is the most frequent in Paramus borough, accounting for 27.8% of all households. In contrast, only 50 households (0.6%) fall into the $10,000 to $14,999 income bracket, making it the least populous group.
| Income Bracket | # Households | % Households |
| Less than $10,000 | 202 | 2.4% |
| $10,000 to $14,999 | 50 | 0.6% |
| $15,000 to $24,999 | 387 | 4.6% |
| $25,000 to $34,999 | 437 | 5.2% |
| $35,000 to $49,999 | 328 | 3.9% |
| $50,000 to $74,999 | 858 | 10.2% |
| $75,000 to $99,999 | 841 | 10.0% |
| $100,000 to $149,999 | 1,581 | 18.8% |
| $150,000 to $199,999 | 1,379 | 16.4% |
| $200,000+ | 2,338 | 27.8% |
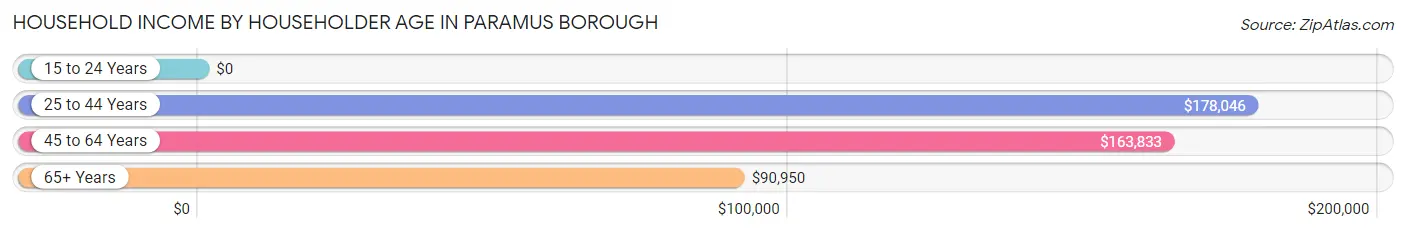
Household Income by Householder Age in Paramus borough
The median household income in Paramus borough is $136,824, with the highest median household income of $178,046 found in the 25 to 44 years age bracket for the primary householder. A total of 1,447 households (17.2%) fall into this category. Meanwhile, the 15 to 24 years age bracket for the primary householder has the lowest median household income of $0, with 10 households (0.1%) in this group.
| Income Bracket | # Households | Median Income |
| 15 to 24 Years | 10 (0.1%) | $0 |
| 25 to 44 Years | 1,447 (17.2%) | $178,046 |
| 45 to 64 Years | 3,620 (43.0%) | $163,833 |
| 65+ Years | 3,333 (39.6%) | $90,950 |
| Total | 8,410 (100.0%) | $136,824 |
Poverty in Paramus borough
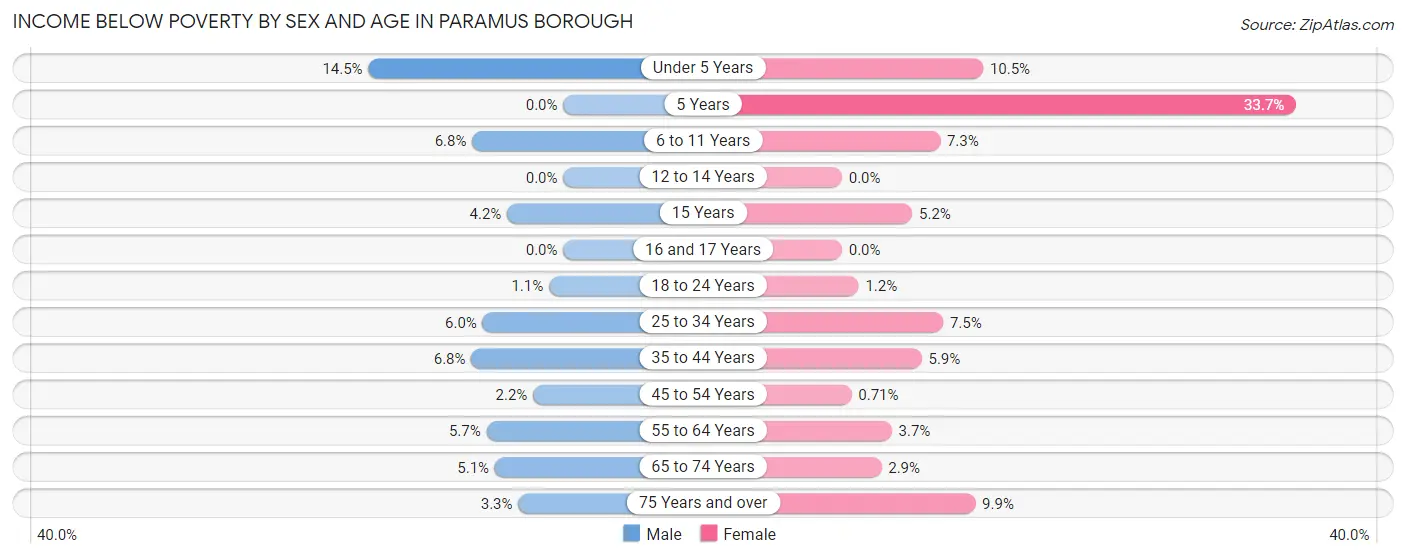
Income Below Poverty by Sex and Age in Paramus borough
With 4.7% poverty level for males and 5.1% for females among the residents of Paramus borough, under 5 year old males and 5 year old females are the most vulnerable to poverty, with 68 males (14.5%) and 56 females (33.7%) in their respective age groups living below the poverty level.
| Age Bracket | Male | Female |
| Under 5 Years | 68 (14.5%) | 50 (10.5%) |
| 5 Years | 0 (0.0%) | 56 (33.7%) |
| 6 to 11 Years | 64 (6.8%) | 56 (7.3%) |
| 12 to 14 Years | 0 (0.0%) | 0 (0.0%) |
| 15 Years | 7 (4.2%) | 6 (5.2%) |
| 16 and 17 Years | 0 (0.0%) | 0 (0.0%) |
| 18 to 24 Years | 12 (1.1%) | 13 (1.2%) |
| 25 to 34 Years | 74 (6.0%) | 70 (7.5%) |
| 35 to 44 Years | 93 (6.8%) | 91 (5.9%) |
| 45 to 54 Years | 33 (2.2%) | 11 (0.7%) |
| 55 to 64 Years | 118 (5.7%) | 76 (3.7%) |
| 65 to 74 Years | 87 (5.1%) | 45 (2.9%) |
| 75 Years and over | 32 (3.3%) | 165 (9.9%) |
| Total | 588 (4.7%) | 639 (5.1%) |
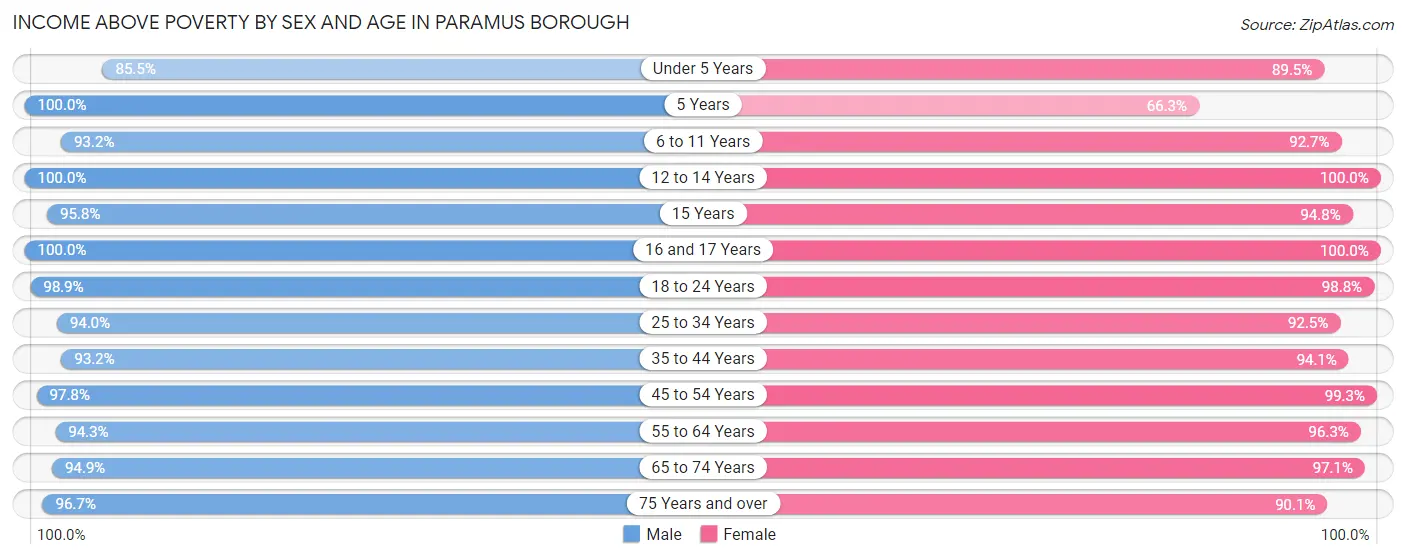
Income Above Poverty by Sex and Age in Paramus borough
According to the poverty statistics in Paramus borough, males aged 5 years and females aged 12 to 14 years are the age groups that are most secure financially, with 100.0% of males and 100.0% of females in these age groups living above the poverty line.
| Age Bracket | Male | Female |
| Under 5 Years | 402 (85.5%) | 427 (89.5%) |
| 5 Years | 102 (100.0%) | 110 (66.3%) |
| 6 to 11 Years | 883 (93.2%) | 712 (92.7%) |
| 12 to 14 Years | 549 (100.0%) | 428 (100.0%) |
| 15 Years | 161 (95.8%) | 109 (94.8%) |
| 16 and 17 Years | 353 (100.0%) | 339 (100.0%) |
| 18 to 24 Years | 1,119 (98.9%) | 1,036 (98.8%) |
| 25 to 34 Years | 1,162 (94.0%) | 862 (92.5%) |
| 35 to 44 Years | 1,268 (93.2%) | 1,446 (94.1%) |
| 45 to 54 Years | 1,437 (97.8%) | 1,545 (99.3%) |
| 55 to 64 Years | 1,951 (94.3%) | 1,978 (96.3%) |
| 65 to 74 Years | 1,627 (94.9%) | 1,493 (97.1%) |
| 75 Years and over | 925 (96.7%) | 1,501 (90.1%) |
| Total | 11,939 (95.3%) | 11,986 (94.9%) |
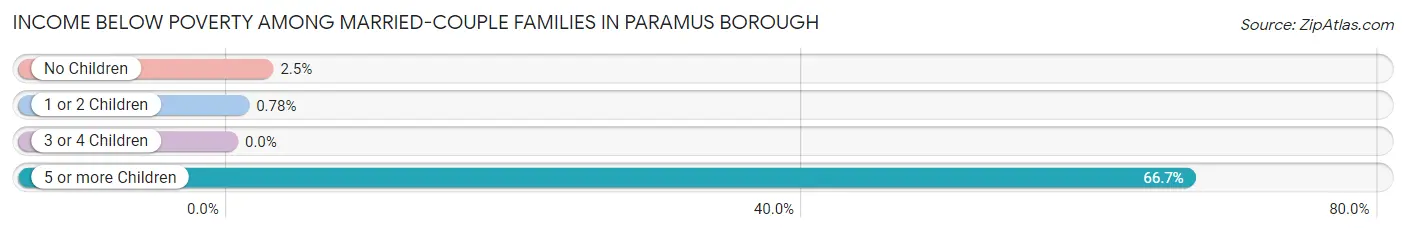
Income Below Poverty Among Married-Couple Families in Paramus borough
The poverty statistics for married-couple families in Paramus borough show that 2.7% or 147 of the total 5,500 families live below the poverty line. Families with 5 or more children have the highest poverty rate of 66.7%, comprising of 52 families. On the other hand, families with 3 or 4 children have the lowest poverty rate of 0.0%, which includes 0 families.
| Children | Above Poverty | Below Poverty |
| No Children | 3,158 (97.5%) | 80 (2.5%) |
| 1 or 2 Children | 1,907 (99.2%) | 15 (0.8%) |
| 3 or 4 Children | 262 (100.0%) | 0 (0.0%) |
| 5 or more Children | 26 (33.3%) | 52 (66.7%) |
| Total | 5,353 (97.3%) | 147 (2.7%) |
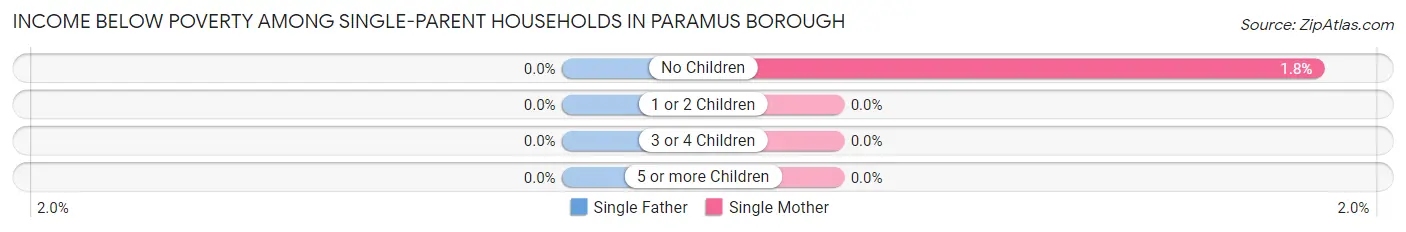
Income Below Poverty Among Single-Parent Households in Paramus borough
| Children | Single Father | Single Mother |
| No Children | 0 (0.0%) | 11 (1.8%) |
| 1 or 2 Children | 0 (0.0%) | 0 (0.0%) |
| 3 or 4 Children | 0 (0.0%) | 0 (0.0%) |
| 5 or more Children | 0 (0.0%) | 0 (0.0%) |
| Total | 0 (0.0%) | 11 (1.1%) |
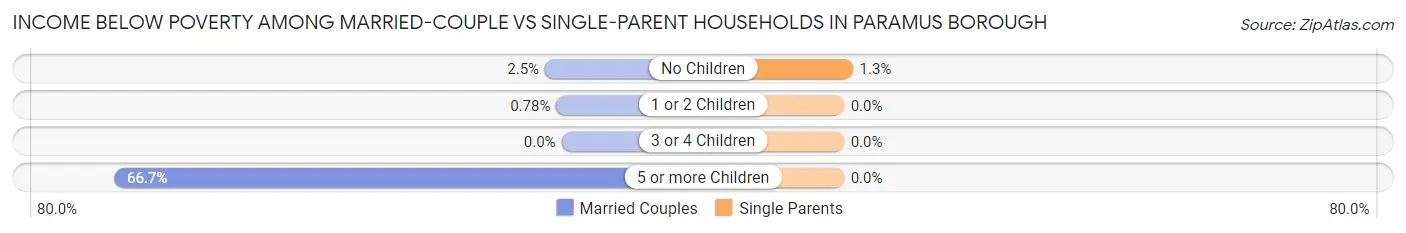
Income Below Poverty Among Married-Couple vs Single-Parent Households in Paramus borough
The poverty data for Paramus borough shows that 147 of the married-couple family households (2.7%) and 11 of the single-parent households (0.9%) are living below the poverty level. Within the married-couple family households, those with 5 or more children have the highest poverty rate, with 52 households (66.7%) falling below the poverty line. Among the single-parent households, those with no children have the highest poverty rate, with 11 household (1.3%) living below poverty.
| Children | Married-Couple Families | Single-Parent Households |
| No Children | 80 (2.5%) | 11 (1.3%) |
| 1 or 2 Children | 15 (0.8%) | 0 (0.0%) |
| 3 or 4 Children | 0 (0.0%) | 0 (0.0%) |
| 5 or more Children | 52 (66.7%) | 0 (0.0%) |
| Total | 147 (2.7%) | 11 (0.9%) |
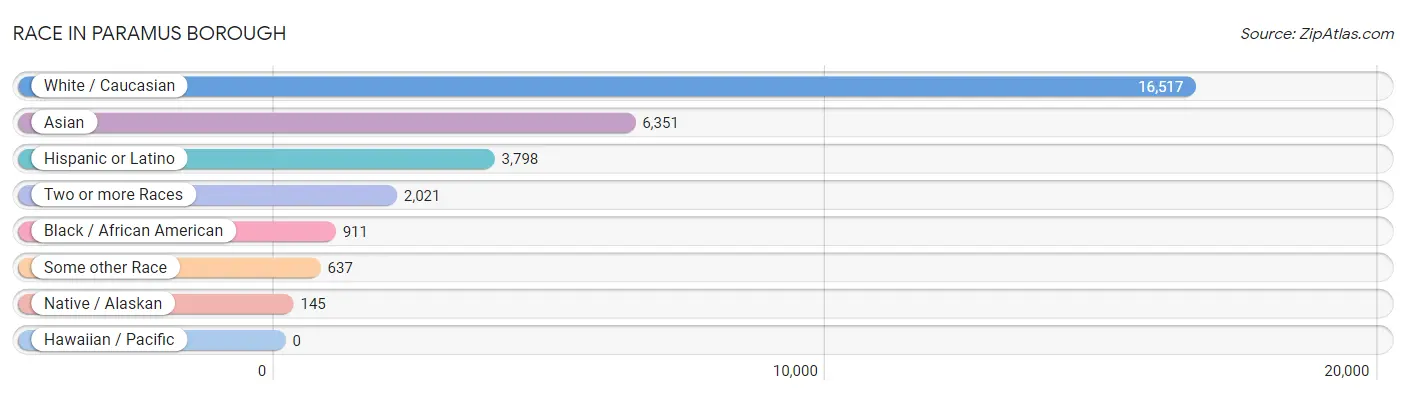
Race in Paramus borough
The most populous races in Paramus borough are White / Caucasian (16,517 | 62.1%), Asian (6,351 | 23.9%), and Hispanic or Latino (3,798 | 14.3%).
| Race | # Population | % Population |
| Asian | 6,351 | 23.9% |
| Black / African American | 911 | 3.4% |
| Hawaiian / Pacific | 0 | 0.0% |
| Hispanic or Latino | 3,798 | 14.3% |
| Native / Alaskan | 145 | 0.5% |
| White / Caucasian | 16,517 | 62.1% |
| Two or more Races | 2,021 | 7.6% |
| Some other Race | 637 | 2.4% |
| Total | 26,582 | 100.0% |
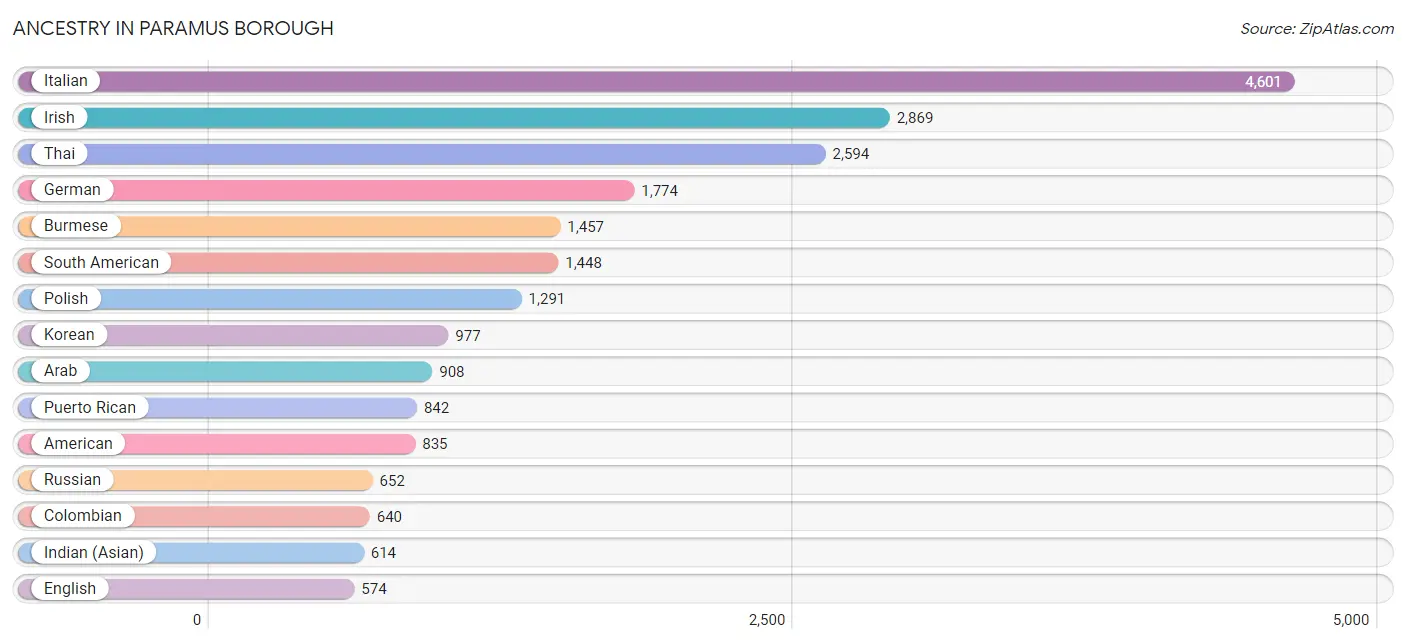
Ancestry in Paramus borough
The most populous ancestries reported in Paramus borough are Italian (4,601 | 17.3%), Irish (2,869 | 10.8%), Thai (2,594 | 9.8%), German (1,774 | 6.7%), and Burmese (1,457 | 5.5%), together accounting for 50.0% of all Paramus borough residents.
| Ancestry | # Population | % Population |
| Afghan | 76 | 0.3% |
| African | 15 | 0.1% |
| Albanian | 104 | 0.4% |
| American | 835 | 3.1% |
| Arab | 908 | 3.4% |
| Argentinean | 177 | 0.7% |
| Armenian | 123 | 0.5% |
| Assyrian / Chaldean / Syriac | 11 | 0.0% |
| Australian | 7 | 0.0% |
| Austrian | 387 | 1.5% |
| Bhutanese | 160 | 0.6% |
| Brazilian | 11 | 0.0% |
| British | 12 | 0.1% |
| Bulgarian | 10 | 0.0% |
| Burmese | 1,457 | 5.5% |
| Canadian | 9 | 0.0% |
| Central American | 242 | 0.9% |
| Chilean | 22 | 0.1% |
| Colombian | 640 | 2.4% |
| Costa Rican | 105 | 0.4% |
| Croatian | 181 | 0.7% |
| Cuban | 232 | 0.9% |
| Czech | 93 | 0.4% |
| Czechoslovakian | 85 | 0.3% |
| Delaware | 5 | 0.0% |
| Dominican | 407 | 1.5% |
| Dutch | 219 | 0.8% |
| Dutch West Indian | 47 | 0.2% |
| Eastern European | 181 | 0.7% |
| Ecuadorian | 264 | 1.0% |
| Egyptian | 61 | 0.2% |
| English | 574 | 2.2% |
| European | 71 | 0.3% |
| French | 94 | 0.4% |
| French Canadian | 83 | 0.3% |
| German | 1,774 | 6.7% |
| Greek | 205 | 0.8% |
| Guyanese | 126 | 0.5% |
| Haitian | 13 | 0.1% |
| Honduran | 137 | 0.5% |
| Hungarian | 262 | 1.0% |
| Indian (Asian) | 614 | 2.3% |
| Iranian | 273 | 1.0% |
| Iraqi | 46 | 0.2% |
| Irish | 2,869 | 10.8% |
| Israeli | 42 | 0.2% |
| Italian | 4,601 | 17.3% |
| Jamaican | 40 | 0.2% |
| Kenyan | 1 | 0.0% |
| Korean | 977 | 3.7% |
| Lebanese | 38 | 0.1% |
| Lithuanian | 51 | 0.2% |
| Macedonian | 9 | 0.0% |
| Maltese | 1 | 0.0% |
| Mexican | 128 | 0.5% |
| Moroccan | 11 | 0.0% |
| Nigerian | 25 | 0.1% |
| Northern European | 52 | 0.2% |
| Norwegian | 19 | 0.1% |
| Peruvian | 297 | 1.1% |
| Polish | 1,291 | 4.9% |
| Portuguese | 96 | 0.4% |
| Puerto Rican | 842 | 3.2% |
| Romanian | 72 | 0.3% |
| Russian | 652 | 2.5% |
| Scandinavian | 23 | 0.1% |
| Scotch-Irish | 49 | 0.2% |
| Scottish | 223 | 0.8% |
| Slavic | 37 | 0.1% |
| Slovak | 14 | 0.1% |
| South American | 1,448 | 5.4% |
| Spaniard | 108 | 0.4% |
| Spanish | 23 | 0.1% |
| Sri Lankan | 69 | 0.3% |
| Subsaharan African | 29 | 0.1% |
| Swedish | 343 | 1.3% |
| Swiss | 48 | 0.2% |
| Syrian | 177 | 0.7% |
| Thai | 2,594 | 9.8% |
| Trinidadian and Tobagonian | 13 | 0.1% |
| Turkish | 110 | 0.4% |
| Ukrainian | 112 | 0.4% |
| Venezuelan | 48 | 0.2% |
| Vietnamese | 63 | 0.2% |
| Welsh | 19 | 0.1% |
| West Indian | 7 | 0.0% |
| Yugoslavian | 17 | 0.1% | View All 87 Rows |
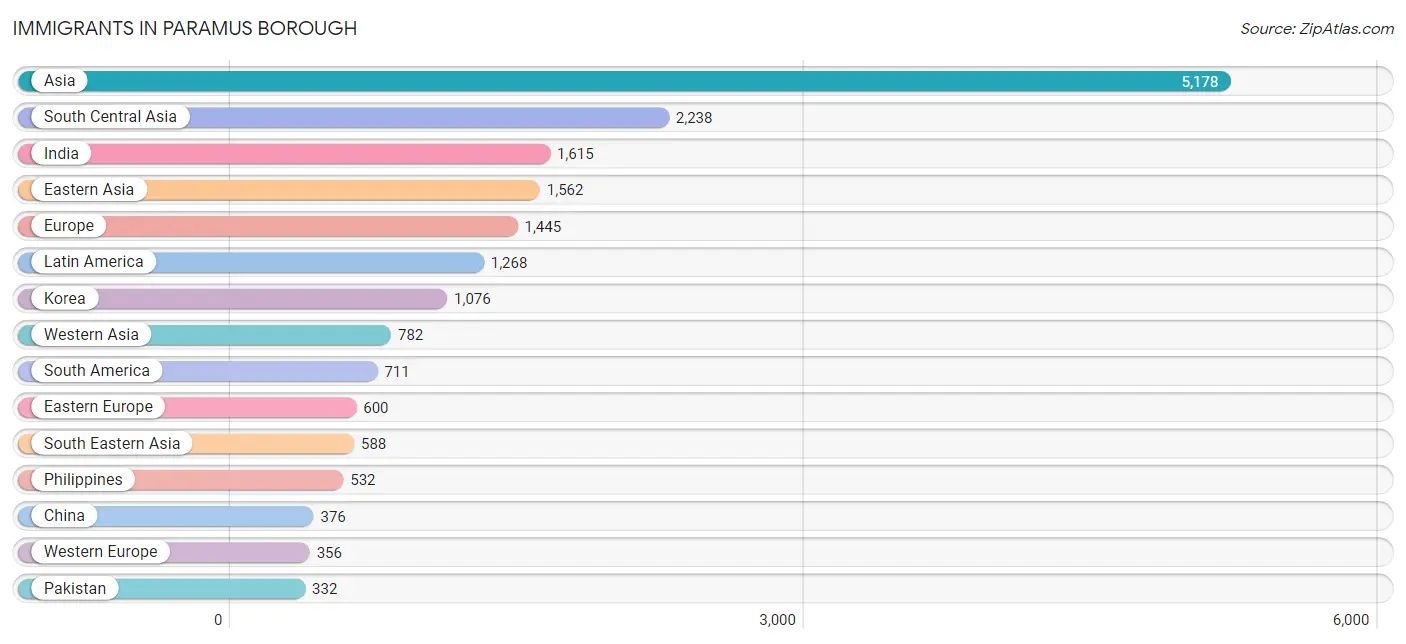
Immigrants in Paramus borough
The most numerous immigrant groups reported in Paramus borough came from Asia (5,178 | 19.5%), South Central Asia (2,238 | 8.4%), India (1,615 | 6.1%), Eastern Asia (1,562 | 5.9%), and Europe (1,445 | 5.4%), together accounting for 45.3% of all Paramus borough residents.
| Immigration Origin | # Population | % Population |
| Afghanistan | 67 | 0.3% |
| Africa | 156 | 0.6% |
| Albania | 86 | 0.3% |
| Argentina | 9 | 0.0% |
| Armenia | 20 | 0.1% |
| Asia | 5,178 | 19.5% |
| Australia | 14 | 0.1% |
| Austria | 192 | 0.7% |
| Bangladesh | 24 | 0.1% |
| Belarus | 42 | 0.2% |
| Brazil | 22 | 0.1% |
| Bulgaria | 10 | 0.0% |
| Canada | 38 | 0.1% |
| Caribbean | 279 | 1.1% |
| Central America | 278 | 1.1% |
| Chile | 22 | 0.1% |
| China | 376 | 1.4% |
| Colombia | 293 | 1.1% |
| Congo | 15 | 0.1% |
| Costa Rica | 85 | 0.3% |
| Croatia | 4 | 0.0% |
| Cuba | 99 | 0.4% |
| Dominican Republic | 114 | 0.4% |
| Eastern Africa | 31 | 0.1% |
| Eastern Asia | 1,562 | 5.9% |
| Eastern Europe | 600 | 2.3% |
| Ecuador | 144 | 0.5% |
| Egypt | 29 | 0.1% |
| England | 46 | 0.2% |
| Europe | 1,445 | 5.4% |
| France | 28 | 0.1% |
| Germany | 136 | 0.5% |
| Greece | 74 | 0.3% |
| Guyana | 21 | 0.1% |
| Haiti | 13 | 0.1% |
| Honduras | 137 | 0.5% |
| Hong Kong | 60 | 0.2% |
| Hungary | 5 | 0.0% |
| India | 1,615 | 6.1% |
| Iran | 123 | 0.5% |
| Iraq | 25 | 0.1% |
| Ireland | 28 | 0.1% |
| Israel | 169 | 0.6% |
| Italy | 131 | 0.5% |
| Jamaica | 40 | 0.2% |
| Japan | 110 | 0.4% |
| Kenya | 5 | 0.0% |
| Korea | 1,076 | 4.1% |
| Kuwait | 56 | 0.2% |
| Latin America | 1,268 | 4.8% |
| Lebanon | 33 | 0.1% |
| Malaysia | 10 | 0.0% |
| Mexico | 56 | 0.2% |
| Middle Africa | 15 | 0.1% |
| Moldova | 90 | 0.3% |
| Morocco | 11 | 0.0% |
| Nepal | 59 | 0.2% |
| Nigeria | 13 | 0.1% |
| North Macedonia | 4 | 0.0% |
| Northern Africa | 57 | 0.2% |
| Northern Europe | 173 | 0.6% |
| Norway | 7 | 0.0% |
| Oceania | 14 | 0.1% |
| Pakistan | 332 | 1.3% |
| Peru | 171 | 0.6% |
| Philippines | 532 | 2.0% |
| Poland | 71 | 0.3% |
| Portugal | 52 | 0.2% |
| Romania | 43 | 0.2% |
| Russia | 151 | 0.6% |
| Saudi Arabia | 212 | 0.8% |
| Scotland | 55 | 0.2% |
| Singapore | 10 | 0.0% |
| South Africa | 19 | 0.1% |
| South America | 711 | 2.7% |
| South Central Asia | 2,238 | 8.4% |
| South Eastern Asia | 588 | 2.2% |
| Southern Europe | 316 | 1.2% |
| Spain | 58 | 0.2% |
| Syria | 107 | 0.4% |
| Taiwan | 63 | 0.2% |
| Turkey | 126 | 0.5% |
| Uganda | 9 | 0.0% |
| Ukraine | 75 | 0.3% |
| Uzbekistan | 18 | 0.1% |
| Venezuela | 29 | 0.1% |
| Vietnam | 36 | 0.1% |
| Western Africa | 13 | 0.1% |
| Western Asia | 782 | 2.9% |
| Western Europe | 356 | 1.3% | View All 90 Rows |
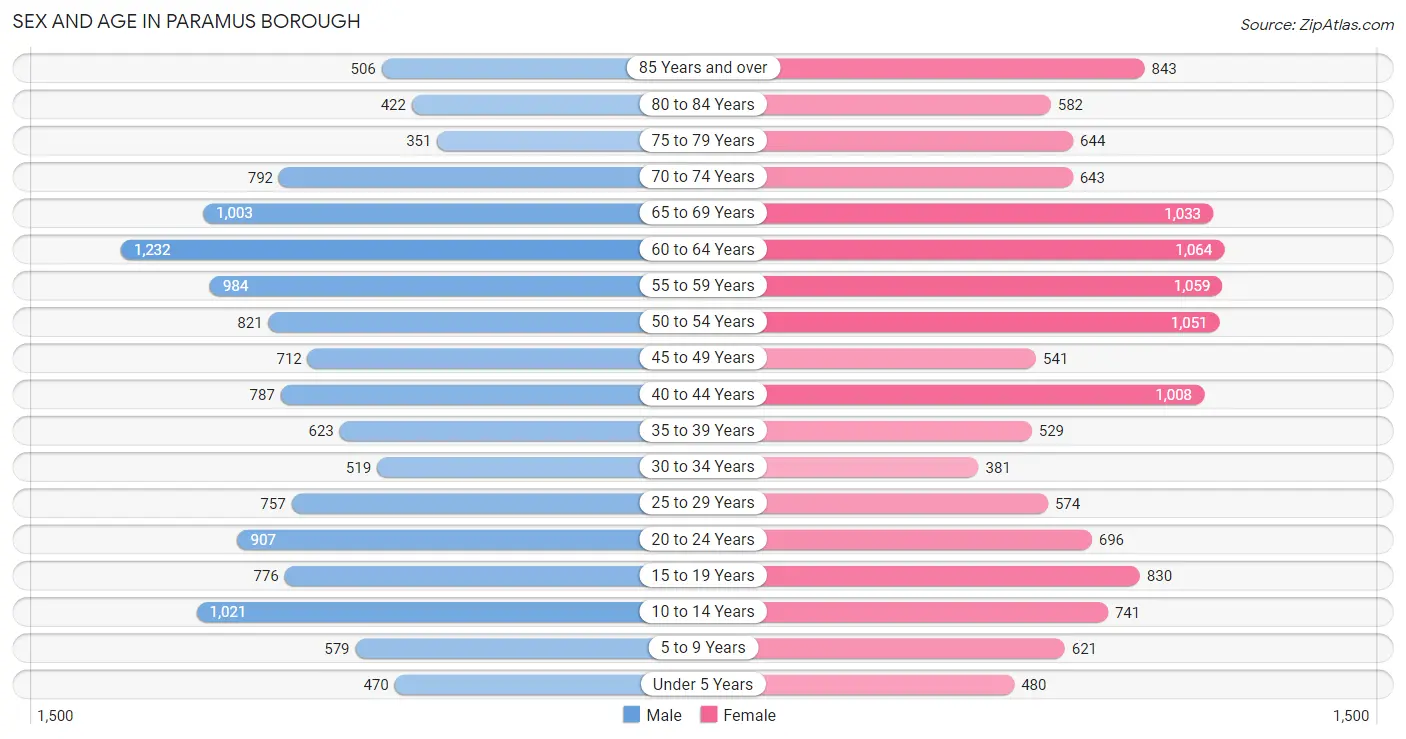
Sex and Age in Paramus borough
Sex and Age in Paramus borough
The most populous age groups in Paramus borough are 60 to 64 Years (1,232 | 9.3%) for men and 60 to 64 Years (1,064 | 8.0%) for women.
| Age Bracket | Male | Female |
| Under 5 Years | 470 (3.5%) | 480 (3.6%) |
| 5 to 9 Years | 579 (4.4%) | 621 (4.7%) |
| 10 to 14 Years | 1,021 (7.7%) | 741 (5.6%) |
| 15 to 19 Years | 776 (5.9%) | 830 (6.2%) |
| 20 to 24 Years | 907 (6.8%) | 696 (5.2%) |
| 25 to 29 Years | 757 (5.7%) | 574 (4.3%) |
| 30 to 34 Years | 519 (3.9%) | 381 (2.9%) |
| 35 to 39 Years | 623 (4.7%) | 529 (4.0%) |
| 40 to 44 Years | 787 (5.9%) | 1,008 (7.6%) |
| 45 to 49 Years | 712 (5.4%) | 541 (4.1%) |
| 50 to 54 Years | 821 (6.2%) | 1,051 (7.9%) |
| 55 to 59 Years | 984 (7.4%) | 1,059 (8.0%) |
| 60 to 64 Years | 1,232 (9.3%) | 1,064 (8.0%) |
| 65 to 69 Years | 1,003 (7.6%) | 1,033 (7.8%) |
| 70 to 74 Years | 792 (6.0%) | 643 (4.8%) |
| 75 to 79 Years | 351 (2.6%) | 644 (4.8%) |
| 80 to 84 Years | 422 (3.2%) | 582 (4.4%) |
| 85 Years and over | 506 (3.8%) | 843 (6.3%) |
| Total | 13,262 (100.0%) | 13,320 (100.0%) |
Families and Households in Paramus borough
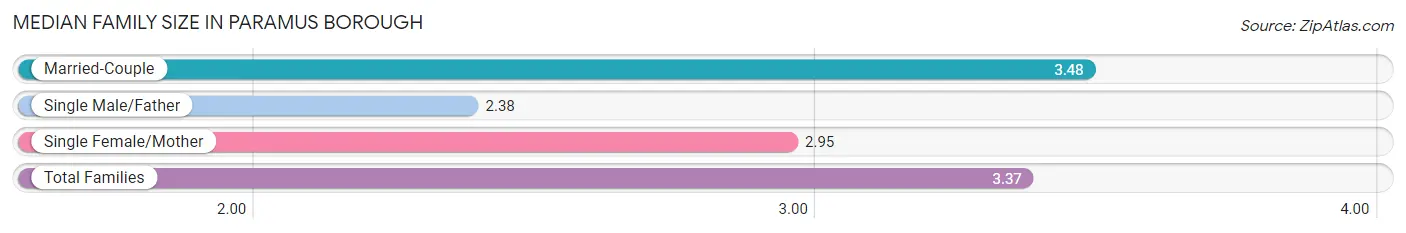
Median Family Size in Paramus borough
The median family size in Paramus borough is 3.37 persons per family, with married-couple families (5,500 | 82.0%) accounting for the largest median family size of 3.48 persons per family. On the other hand, single male/father families (231 | 3.4%) represent the smallest median family size with 2.38 persons per family.
| Family Type | # Families | Family Size |
| Married-Couple | 5,500 (82.0%) | 3.48 |
| Single Male/Father | 231 (3.4%) | 2.38 |
| Single Female/Mother | 980 (14.6%) | 2.95 |
| Total Families | 6,711 (100.0%) | 3.37 |
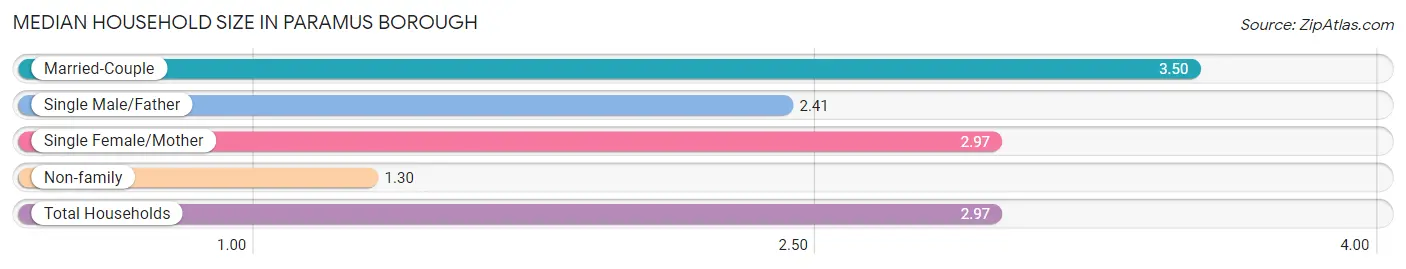
Median Household Size in Paramus borough
The median household size in Paramus borough is 2.97 persons per household, with married-couple households (5,500 | 65.4%) accounting for the largest median household size of 3.5 persons per household. non-family households (1,699 | 20.2%) represent the smallest median household size with 1.30 persons per household.
| Household Type | # Households | Household Size |
| Married-Couple | 5,500 (65.4%) | 3.50 |
| Single Male/Father | 231 (2.8%) | 2.41 |
| Single Female/Mother | 980 (11.7%) | 2.97 |
| Non-family | 1,699 (20.2%) | 1.30 |
| Total Households | 8,410 (100.0%) | 2.97 |
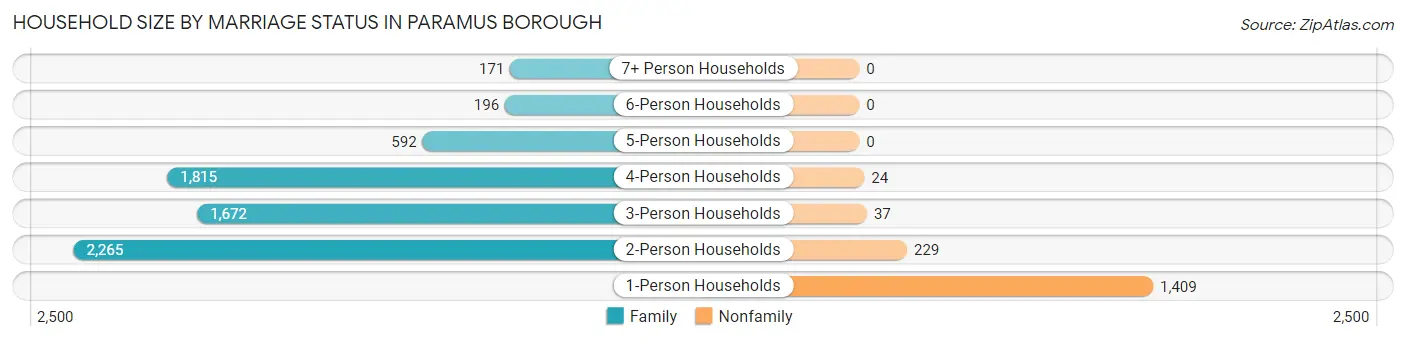
Household Size by Marriage Status in Paramus borough
Out of a total of 8,410 households in Paramus borough, 6,711 (79.8%) are family households, while 1,699 (20.2%) are nonfamily households. The most numerous type of family households are 2-person households, comprising 2,265, and the most common type of nonfamily households are 1-person households, comprising 1,409.
| Household Size | Family Households | Nonfamily Households |
| 1-Person Households | - | 1,409 (16.8%) |
| 2-Person Households | 2,265 (26.9%) | 229 (2.7%) |
| 3-Person Households | 1,672 (19.9%) | 37 (0.4%) |
| 4-Person Households | 1,815 (21.6%) | 24 (0.3%) |
| 5-Person Households | 592 (7.0%) | 0 (0.0%) |
| 6-Person Households | 196 (2.3%) | 0 (0.0%) |
| 7+ Person Households | 171 (2.0%) | 0 (0.0%) |
| Total | 6,711 (79.8%) | 1,699 (20.2%) |
Female Fertility in Paramus borough
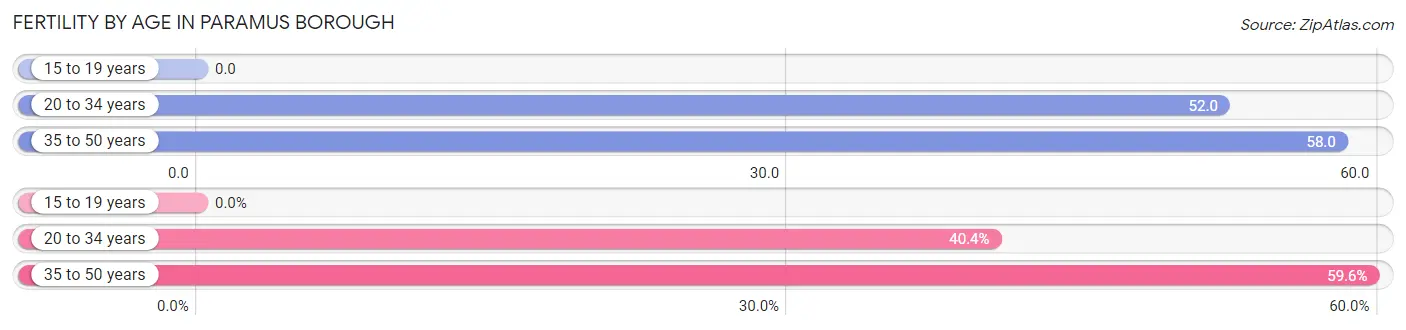
Fertility by Age in Paramus borough
Average fertility rate in Paramus borough is 46.0 births per 1,000 women. Women in the age bracket of 35 to 50 years have the highest fertility rate with 58.0 births per 1,000 women. Women in the age bracket of 35 to 50 years acount for 59.6% of all women with births.
| Age Bracket | Women with Births | Births / 1,000 Women |
| 15 to 19 years | 0 (0.0%) | 0.0 |
| 20 to 34 years | 86 (40.4%) | 52.0 |
| 35 to 50 years | 127 (59.6%) | 58.0 |
| Total | 213 (100.0%) | 46.0 |
Fertility by Age by Marriage Status in Paramus borough
96.7% of women with births (213) in Paramus borough are married. The highest percentage of unmarried women with births falls into 20 to 34 years age bracket with 8.1% of them unmarried at the time of birth, while the lowest percentage of unmarried women with births belong to 35 to 50 years age bracket with 0.0% of them unmarried.
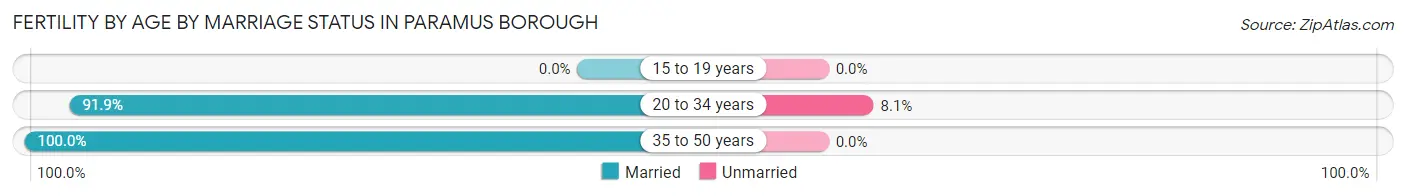
| Age Bracket | Married | Unmarried |
| 15 to 19 years | 0 (0.0%) | 0 (0.0%) |
| 20 to 34 years | 79 (91.9%) | 7 (8.1%) |
| 35 to 50 years | 127 (100.0%) | 0 (0.0%) |
| Total | 206 (96.7%) | 7 (3.3%) |
Fertility by Education in Paramus borough
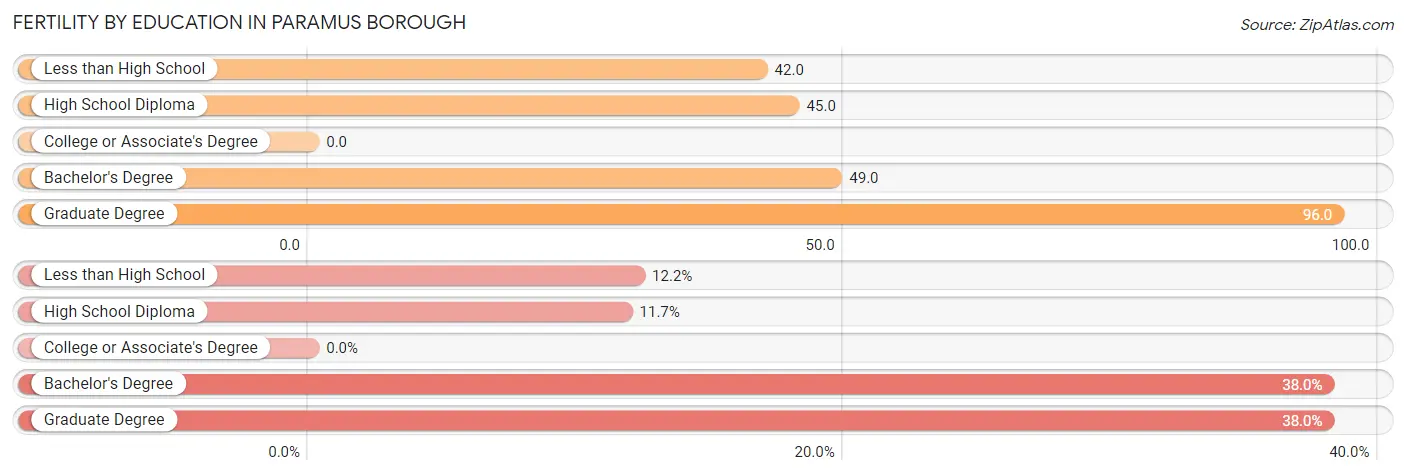
| Educational Attainment | Women with Births | Births / 1,000 Women |
| Less than High School | 26 (12.2%) | 42.0 |
| High School Diploma | 25 (11.7%) | 45.0 |
| College or Associate's Degree | 0 (0.0%) | 0.0 |
| Bachelor's Degree | 81 (38.0%) | 49.0 |
| Graduate Degree | 81 (38.0%) | 96.0 |
| Total | 213 (100.0%) | 46.0 |
Fertility by Education by Marriage Status in Paramus borough
3.3% of women with births in Paramus borough are unmarried. Women with the educational attainment of less than high school are most likely to be married with 100.0% of them married at childbirth, while women with the educational attainment of high school diploma are least likely to be married with 28.0% of them unmarried at childbirth.
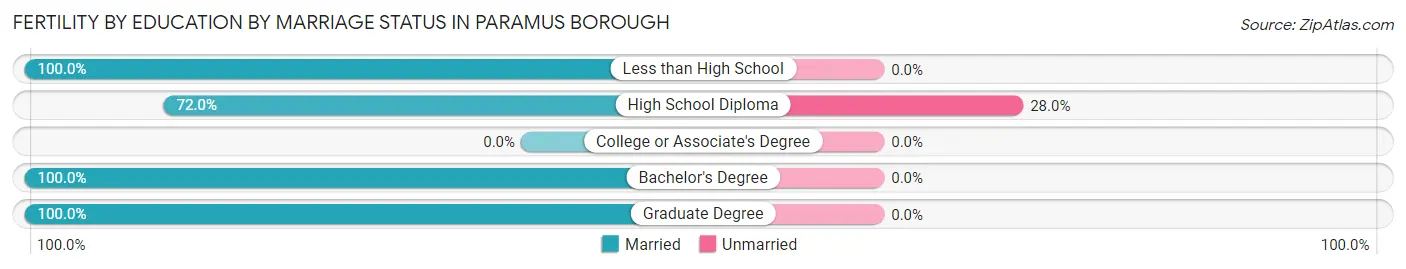
| Educational Attainment | Married | Unmarried |
| Less than High School | 26 (100.0%) | 0 (0.0%) |
| High School Diploma | 18 (72.0%) | 7 (28.0%) |
| College or Associate's Degree | 0 (0.0%) | 0 (0.0%) |
| Bachelor's Degree | 81 (100.0%) | 0 (0.0%) |
| Graduate Degree | 81 (100.0%) | 0 (0.0%) |
| Total | 206 (96.7%) | 7 (3.3%) |
Employment Characteristics in Paramus borough
Employment by Class of Employer in Paramus borough
Among the 11,841 employed individuals in Paramus borough, private company employees (7,545 | 63.7%), self-employed (incorporated) (1,216 | 10.3%), and local government employees (1,180 | 10.0%) make up the most common classes of employment.
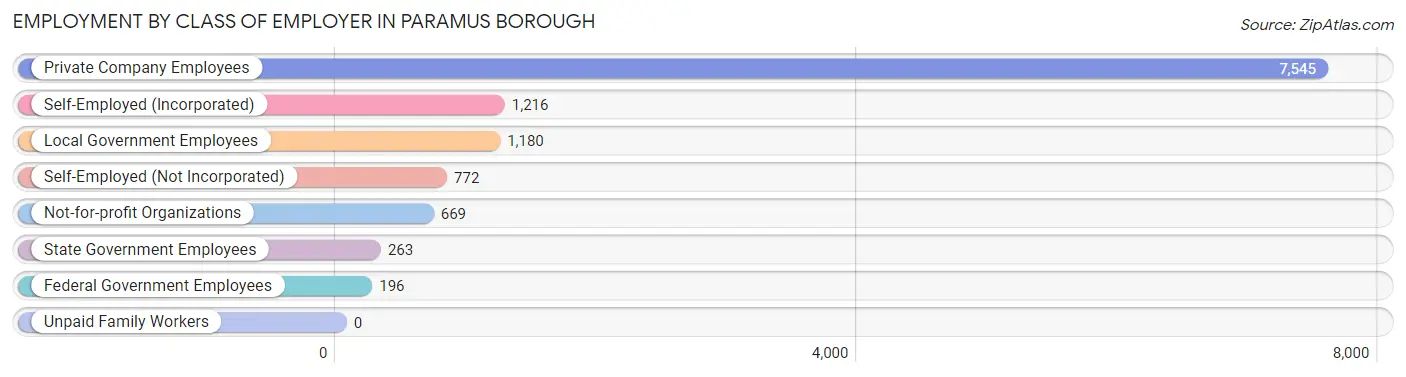
| Employer Class | # Employees | % Employees |
| Private Company Employees | 7,545 | 63.7% |
| Self-Employed (Incorporated) | 1,216 | 10.3% |
| Self-Employed (Not Incorporated) | 772 | 6.5% |
| Not-for-profit Organizations | 669 | 5.7% |
| Local Government Employees | 1,180 | 10.0% |
| State Government Employees | 263 | 2.2% |
| Federal Government Employees | 196 | 1.7% |
| Unpaid Family Workers | 0 | 0.0% |
| Total | 11,841 | 100.0% |
Employment Status by Age in Paramus borough
According to the labor force statistics for Paramus borough, out of the total population over 16 years of age (22,387), 59.0% or 13,208 individuals are in the labor force, with 7.6% or 1,004 of them unemployed. The age group with the highest labor force participation rate is 25 to 29 years, with 86.6% or 1,153 individuals in the labor force. Within the labor force, the 16 to 19 years age range has the highest percentage of unemployed individuals, with 24.4% or 70 of them being unemployed.
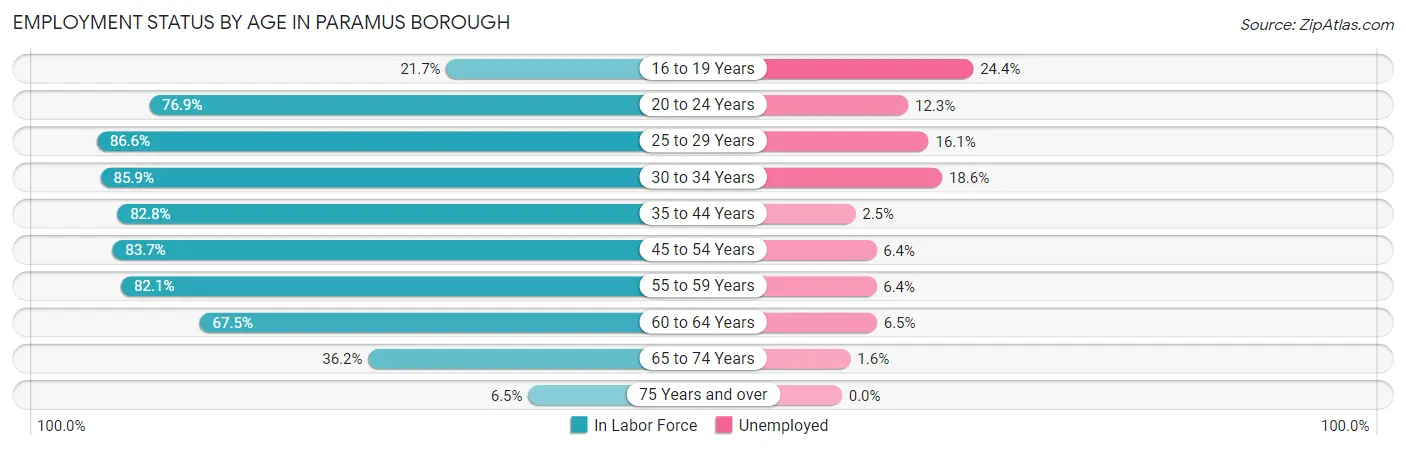
| Age Bracket | In Labor Force | Unemployed |
| 16 to 19 Years | 287 (21.7%) | 70 (24.4%) |
| 20 to 24 Years | 1,233 (76.9%) | 152 (12.3%) |
| 25 to 29 Years | 1,153 (86.6%) | 186 (16.1%) |
| 30 to 34 Years | 773 (85.9%) | 144 (18.6%) |
| 35 to 44 Years | 2,440 (82.8%) | 61 (2.5%) |
| 45 to 54 Years | 2,616 (83.7%) | 167 (6.4%) |
| 55 to 59 Years | 1,677 (82.1%) | 107 (6.4%) |
| 60 to 64 Years | 1,550 (67.5%) | 101 (6.5%) |
| 65 to 74 Years | 1,257 (36.2%) | 20 (1.6%) |
| 75 Years and over | 218 (6.5%) | 0 (0.0%) |
| Total | 13,208 (59.0%) | 1,004 (7.6%) |
Employment Status by Educational Attainment in Paramus borough
According to labor force statistics for Paramus borough, 80.8% of individuals (10,215) out of the total population between 25 and 64 years of age (12,642) are in the labor force, with 7.5% or 766 of them being unemployed. The group with the highest labor force participation rate are those with the educational attainment of bachelor's degree or higher, with 85.7% or 6,114 individuals in the labor force. Within the labor force, individuals with college / associate degree education have the highest percentage of unemployment, with 16.3% or 398 of them being unemployed.
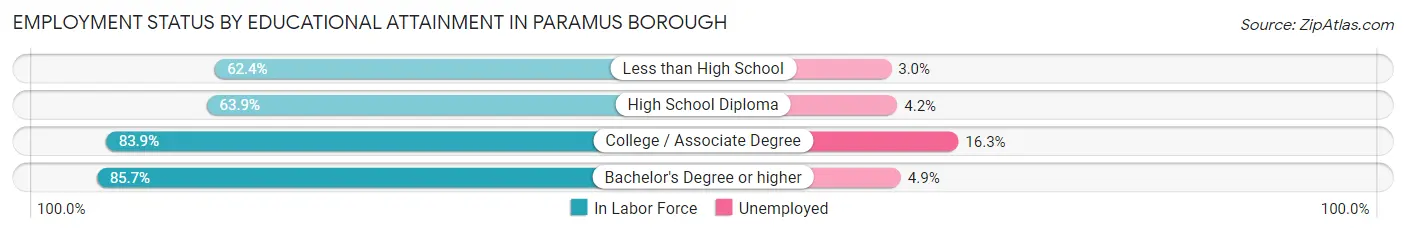
| Educational Attainment | In Labor Force | Unemployed |
| Less than High School | 237 (62.4%) | 11 (3.0%) |
| High School Diploma | 1,418 (63.9%) | 93 (4.2%) |
| College / Associate Degree | 2,441 (83.9%) | 474 (16.3%) |
| Bachelor's Degree or higher | 6,114 (85.7%) | 350 (4.9%) |
| Total | 10,215 (80.8%) | 948 (7.5%) |
Employment Occupations by Sex in Paramus borough
Management, Business, Science and Arts Occupations
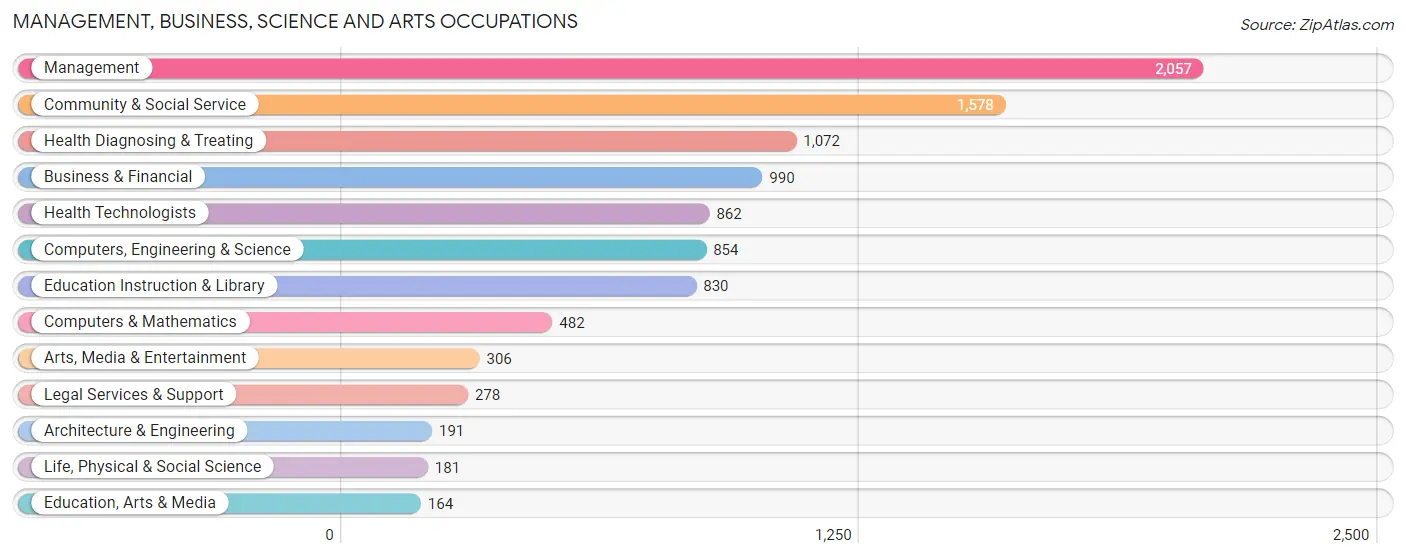
The most common Management, Business, Science and Arts occupations in Paramus borough are Management (2,057 | 16.9%), Community & Social Service (1,578 | 12.9%), Health Diagnosing & Treating (1,072 | 8.8%), Business & Financial (990 | 8.1%), and Health Technologists (862 | 7.1%).
Management, Business, Science and Arts Occupations by Sex
Within the Management, Business, Science and Arts occupations in Paramus borough, the most male-oriented occupations are Architecture & Engineering (96.9%), Arts, Media & Entertainment (75.2%), and Computers, Engineering & Science (64.0%), while the most female-oriented occupations are Education, Arts & Media (81.1%), Life, Physical & Social Science (68.0%), and Education Instruction & Library (64.7%).
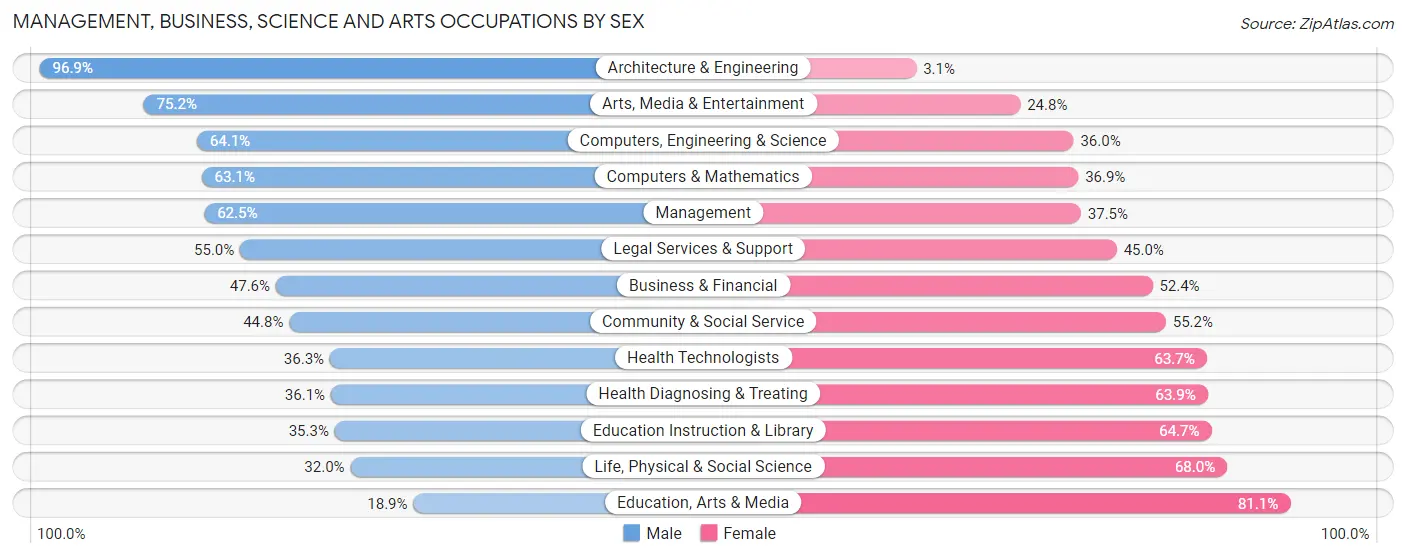
| Occupation | Male | Female |
| Management | 1,286 (62.5%) | 771 (37.5%) |
| Business & Financial | 471 (47.6%) | 519 (52.4%) |
| Computers, Engineering & Science | 547 (64.0%) | 307 (35.9%) |
| Computers & Mathematics | 304 (63.1%) | 178 (36.9%) |
| Architecture & Engineering | 185 (96.9%) | 6 (3.1%) |
| Life, Physical & Social Science | 58 (32.0%) | 123 (68.0%) |
| Community & Social Service | 707 (44.8%) | 871 (55.2%) |
| Education, Arts & Media | 31 (18.9%) | 133 (81.1%) |
| Legal Services & Support | 153 (55.0%) | 125 (45.0%) |
| Education Instruction & Library | 293 (35.3%) | 537 (64.7%) |
| Arts, Media & Entertainment | 230 (75.2%) | 76 (24.8%) |
| Health Diagnosing & Treating | 387 (36.1%) | 685 (63.9%) |
| Health Technologists | 313 (36.3%) | 549 (63.7%) |
| Total (Category) | 3,398 (51.9%) | 3,153 (48.1%) |
| Total (Overall) | 6,571 (53.9%) | 5,623 (46.1%) |
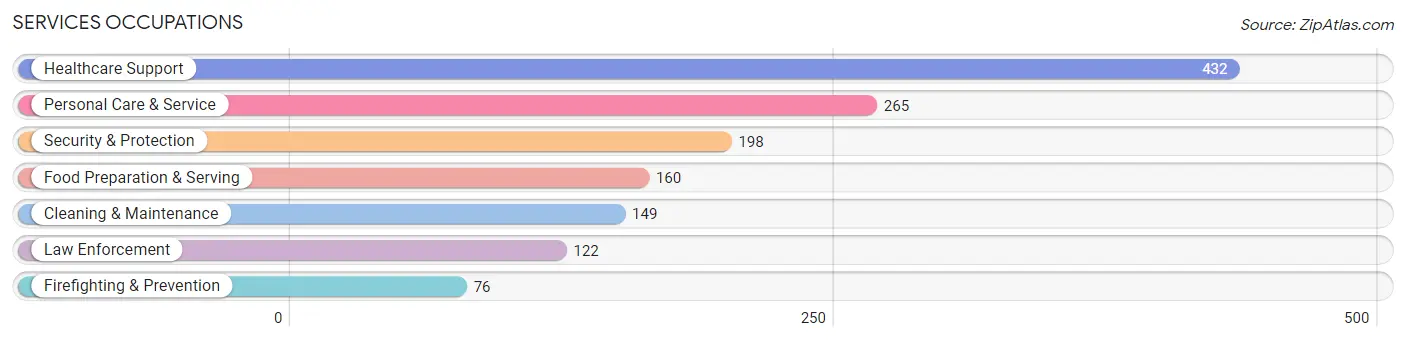
Services Occupations
The most common Services occupations in Paramus borough are Healthcare Support (432 | 3.5%), Personal Care & Service (265 | 2.2%), Security & Protection (198 | 1.6%), Food Preparation & Serving (160 | 1.3%), and Cleaning & Maintenance (149 | 1.2%).
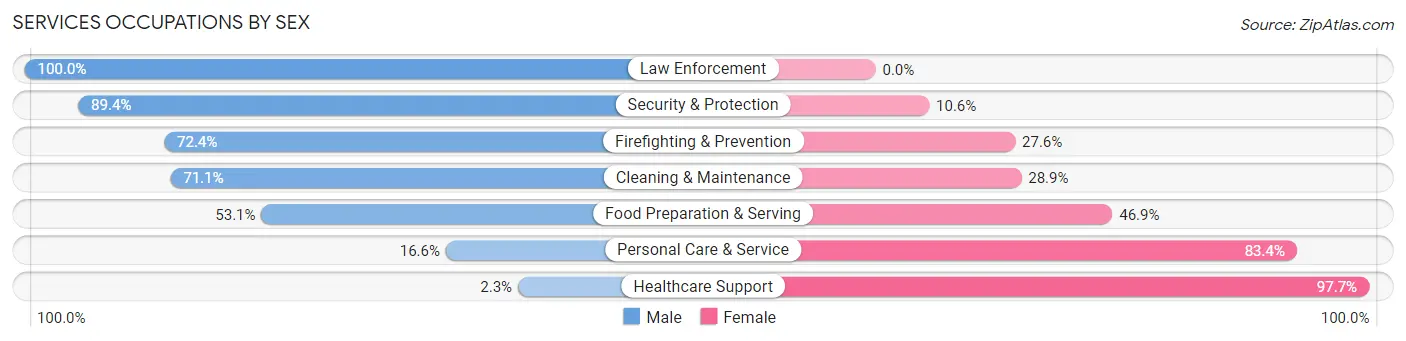
Services Occupations by Sex
Within the Services occupations in Paramus borough, the most male-oriented occupations are Law Enforcement (100.0%), Security & Protection (89.4%), and Firefighting & Prevention (72.4%), while the most female-oriented occupations are Healthcare Support (97.7%), Personal Care & Service (83.4%), and Food Preparation & Serving (46.9%).
| Occupation | Male | Female |
| Healthcare Support | 10 (2.3%) | 422 (97.7%) |
| Security & Protection | 177 (89.4%) | 21 (10.6%) |
| Firefighting & Prevention | 55 (72.4%) | 21 (27.6%) |
| Law Enforcement | 122 (100.0%) | 0 (0.0%) |
| Food Preparation & Serving | 85 (53.1%) | 75 (46.9%) |
| Cleaning & Maintenance | 106 (71.1%) | 43 (28.9%) |
| Personal Care & Service | 44 (16.6%) | 221 (83.4%) |
| Total (Category) | 422 (35.0%) | 782 (64.9%) |
| Total (Overall) | 6,571 (53.9%) | 5,623 (46.1%) |
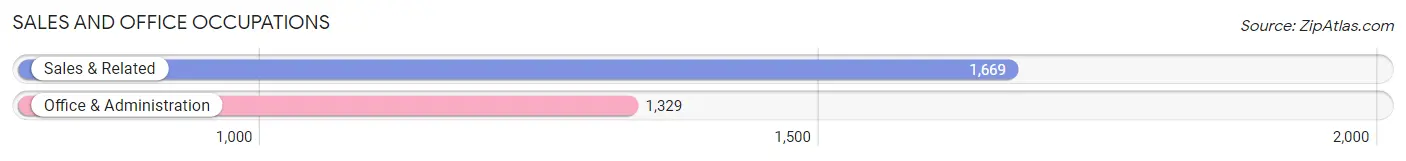
Sales and Office Occupations
The most common Sales and Office occupations in Paramus borough are Sales & Related (1,669 | 13.7%), and Office & Administration (1,329 | 10.9%).
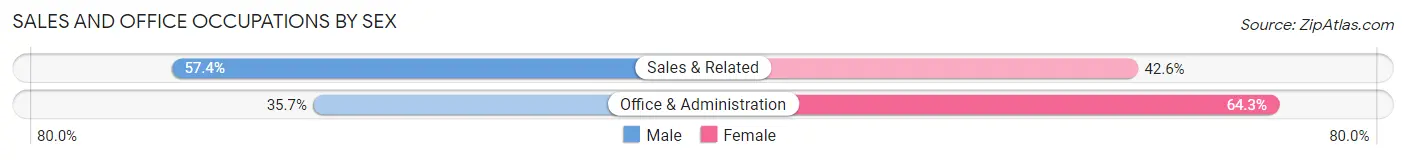
Sales and Office Occupations by Sex
| Occupation | Male | Female |
| Sales & Related | 958 (57.4%) | 711 (42.6%) |
| Office & Administration | 474 (35.7%) | 855 (64.3%) |
| Total (Category) | 1,432 (47.8%) | 1,566 (52.2%) |
| Total (Overall) | 6,571 (53.9%) | 5,623 (46.1%) |
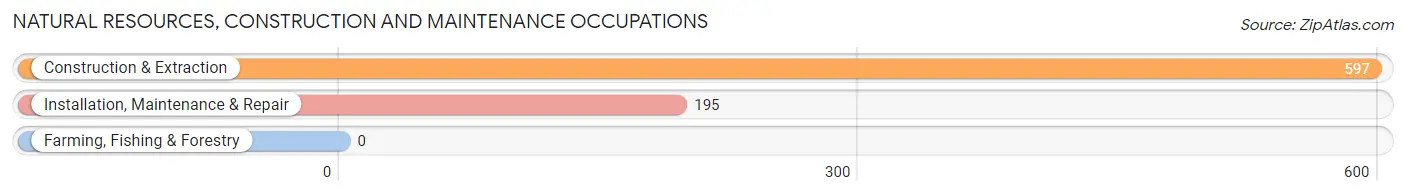
Natural Resources, Construction and Maintenance Occupations
The most common Natural Resources, Construction and Maintenance occupations in Paramus borough are Construction & Extraction (597 | 4.9%), and Installation, Maintenance & Repair (195 | 1.6%).
Natural Resources, Construction and Maintenance Occupations by Sex
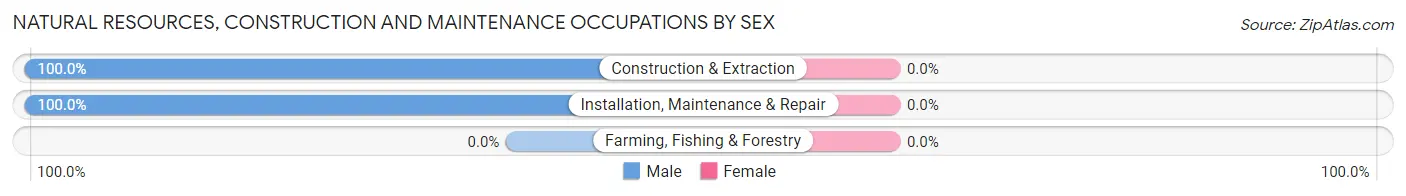
| Occupation | Male | Female |
| Farming, Fishing & Forestry | 0 (0.0%) | 0 (0.0%) |
| Construction & Extraction | 597 (100.0%) | 0 (0.0%) |
| Installation, Maintenance & Repair | 195 (100.0%) | 0 (0.0%) |
| Total (Category) | 792 (100.0%) | 0 (0.0%) |
| Total (Overall) | 6,571 (53.9%) | 5,623 (46.1%) |
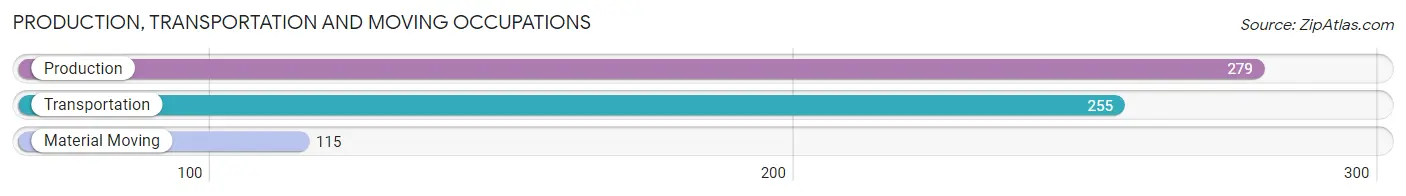
Production, Transportation and Moving Occupations
The most common Production, Transportation and Moving occupations in Paramus borough are Production (279 | 2.3%), Transportation (255 | 2.1%), and Material Moving (115 | 0.9%).
Production, Transportation and Moving Occupations by Sex
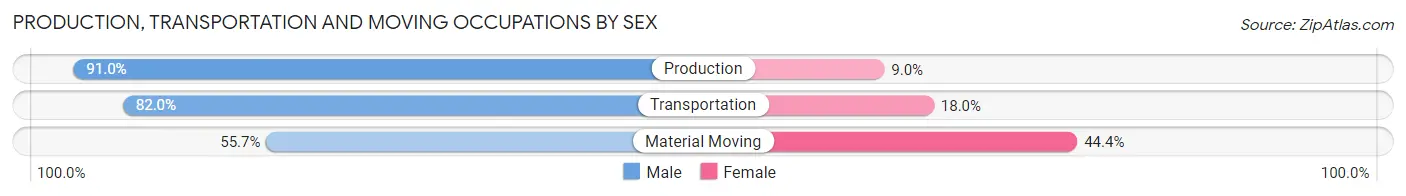
| Occupation | Male | Female |
| Production | 254 (91.0%) | 25 (9.0%) |
| Transportation | 209 (82.0%) | 46 (18.0%) |
| Material Moving | 64 (55.6%) | 51 (44.4%) |
| Total (Category) | 527 (81.2%) | 122 (18.8%) |
| Total (Overall) | 6,571 (53.9%) | 5,623 (46.1%) |
Employment Industries by Sex in Paramus borough
Employment Industries in Paramus borough
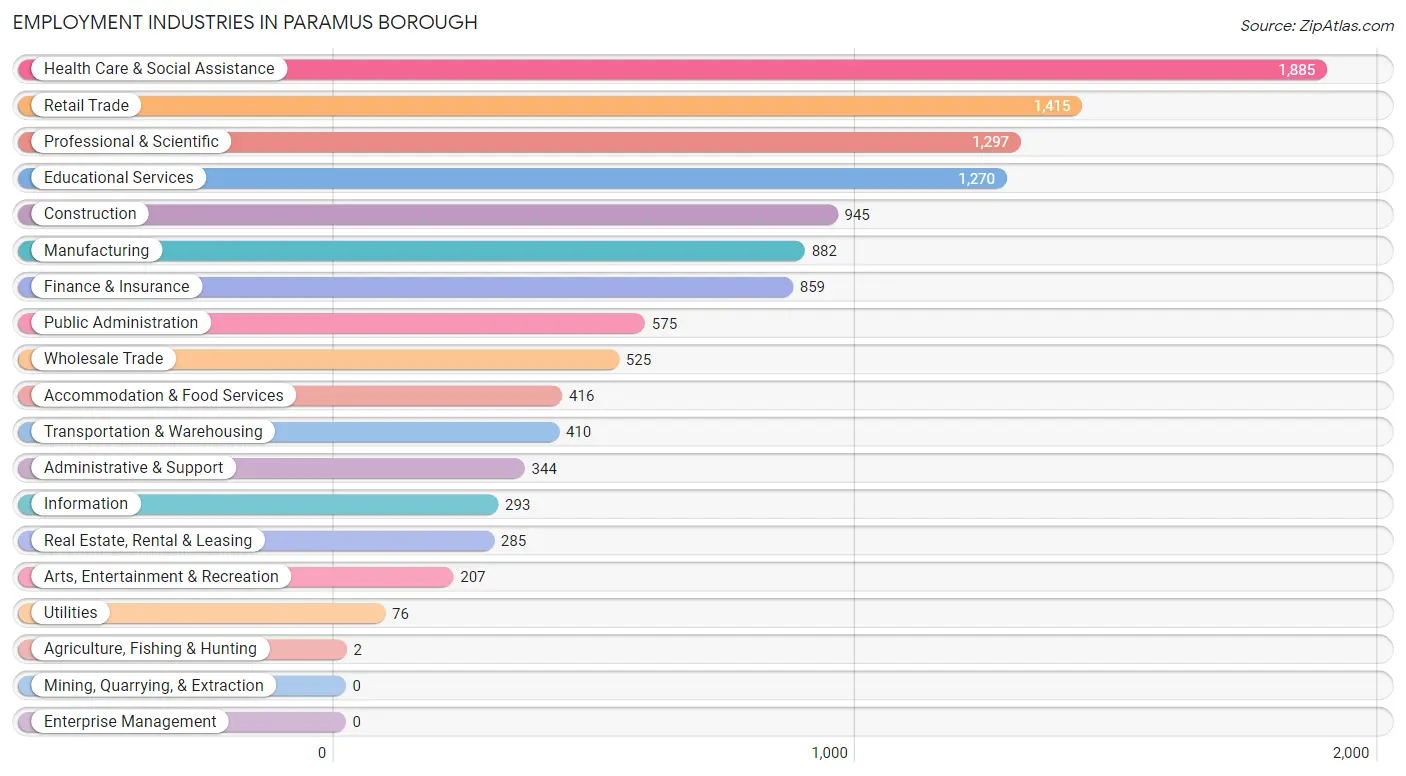
The major employment industries in Paramus borough include Health Care & Social Assistance (1,885 | 15.5%), Retail Trade (1,415 | 11.6%), Professional & Scientific (1,297 | 10.6%), Educational Services (1,270 | 10.4%), and Construction (945 | 7.7%).
Employment Industries by Sex in Paramus borough
The Paramus borough industries that see more men than women are Agriculture, Fishing & Hunting (100.0%), Construction (96.6%), and Transportation & Warehousing (88.5%), whereas the industries that tend to have a higher number of women are Health Care & Social Assistance (78.4%), Arts, Entertainment & Recreation (60.4%), and Educational Services (59.4%).
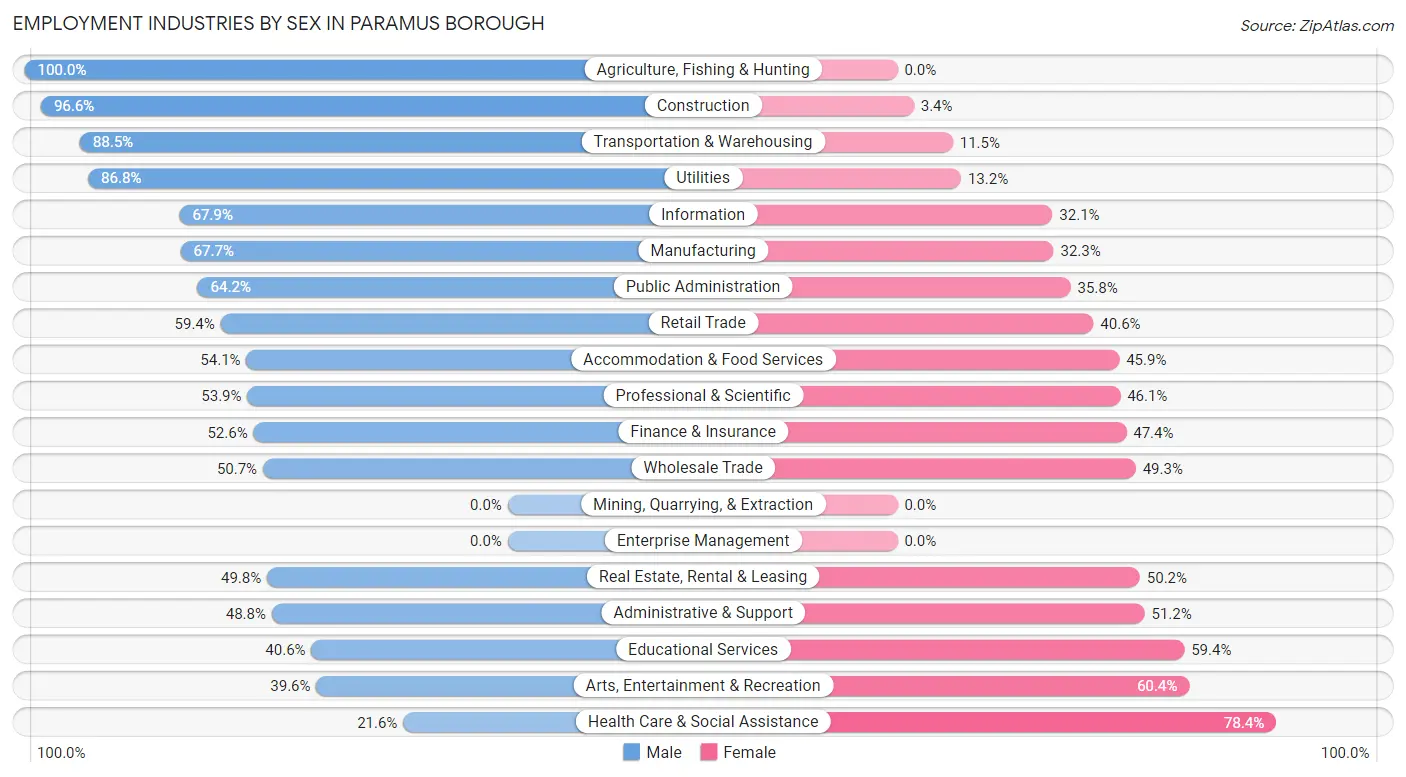
| Industry | Male | Female |
| Agriculture, Fishing & Hunting | 2 (100.0%) | 0 (0.0%) |
| Mining, Quarrying, & Extraction | 0 (0.0%) | 0 (0.0%) |
| Construction | 913 (96.6%) | 32 (3.4%) |
| Manufacturing | 597 (67.7%) | 285 (32.3%) |
| Wholesale Trade | 266 (50.7%) | 259 (49.3%) |
| Retail Trade | 841 (59.4%) | 574 (40.6%) |
| Transportation & Warehousing | 363 (88.5%) | 47 (11.5%) |
| Utilities | 66 (86.8%) | 10 (13.2%) |
| Information | 199 (67.9%) | 94 (32.1%) |
| Finance & Insurance | 452 (52.6%) | 407 (47.4%) |
| Real Estate, Rental & Leasing | 142 (49.8%) | 143 (50.2%) |
| Professional & Scientific | 699 (53.9%) | 598 (46.1%) |
| Enterprise Management | 0 (0.0%) | 0 (0.0%) |
| Administrative & Support | 168 (48.8%) | 176 (51.2%) |
| Educational Services | 516 (40.6%) | 754 (59.4%) |
| Health Care & Social Assistance | 408 (21.6%) | 1,477 (78.4%) |
| Arts, Entertainment & Recreation | 82 (39.6%) | 125 (60.4%) |
| Accommodation & Food Services | 225 (54.1%) | 191 (45.9%) |
| Public Administration | 369 (64.2%) | 206 (35.8%) |
| Total | 6,571 (53.9%) | 5,623 (46.1%) |
Education in Paramus borough
School Enrollment in Paramus borough
The most common levels of schooling among the 6,139 students in Paramus borough are college / undergraduate (1,424 | 23.2%), middle school (1,377 | 22.4%), and high school (1,270 | 20.7%).
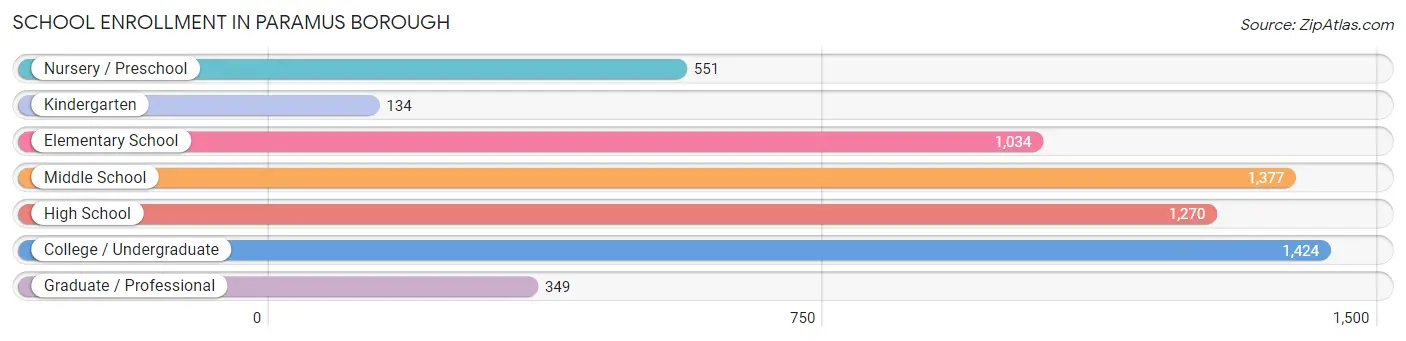
| School Level | # Students | % Students |
| Nursery / Preschool | 551 | 9.0% |
| Kindergarten | 134 | 2.2% |
| Elementary School | 1,034 | 16.8% |
| Middle School | 1,377 | 22.4% |
| High School | 1,270 | 20.7% |
| College / Undergraduate | 1,424 | 23.2% |
| Graduate / Professional | 349 | 5.7% |
| Total | 6,139 | 100.0% |
School Enrollment by Age by Funding Source in Paramus borough
Out of a total of 6,139 students who are enrolled in schools in Paramus borough, 1,369 (22.3%) attend a private institution, while the remaining 4,770 (77.7%) are enrolled in public schools. The age group of 3 to 4 year olds has the highest likelihood of being enrolled in private schools, with 275 (72.6% in the age bracket) enrolled. Conversely, the age group of 10 to 14 year olds has the lowest likelihood of being enrolled in a private school, with 1,638 (93.5% in the age bracket) attending a public institution.
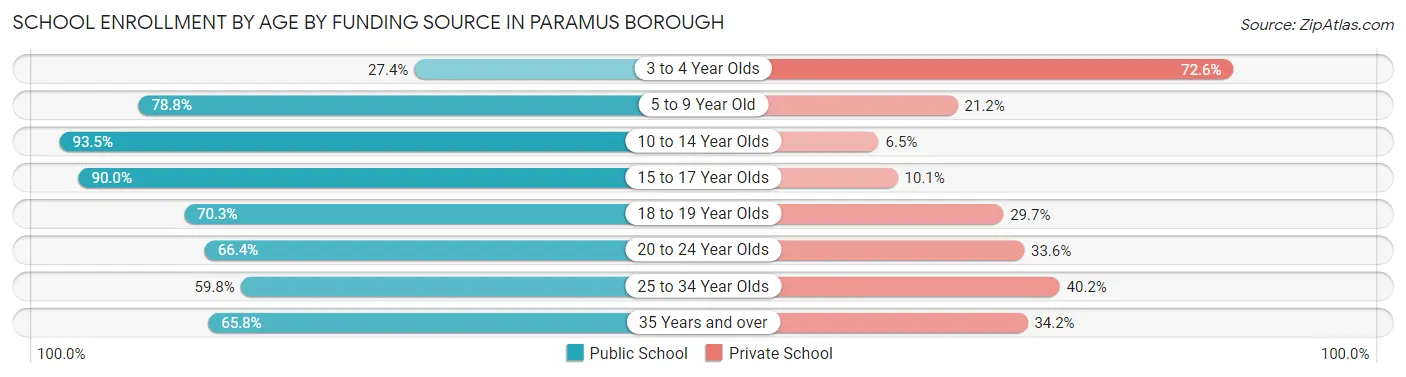
| Age Bracket | Public School | Private School |
| 3 to 4 Year Olds | 104 (27.4%) | 275 (72.6%) |
| 5 to 9 Year Old | 902 (78.8%) | 243 (21.2%) |
| 10 to 14 Year Olds | 1,638 (93.5%) | 114 (6.5%) |
| 15 to 17 Year Olds | 841 (89.9%) | 94 (10.1%) |
| 18 to 19 Year Olds | 421 (70.3%) | 178 (29.7%) |
| 20 to 24 Year Olds | 607 (66.4%) | 307 (33.6%) |
| 25 to 34 Year Olds | 159 (59.8%) | 107 (40.2%) |
| 35 Years and over | 98 (65.8%) | 51 (34.2%) |
| Total | 4,770 (77.7%) | 1,369 (22.3%) |
Educational Attainment by Field of Study in Paramus borough
Business (1,935 | 18.7%), education (1,234 | 11.9%), science & technology (1,177 | 11.4%), social sciences (1,001 | 9.7%), and engineering (936 | 9.0%) are the most common fields of study among 10,353 individuals in Paramus borough who have obtained a bachelor's degree or higher.
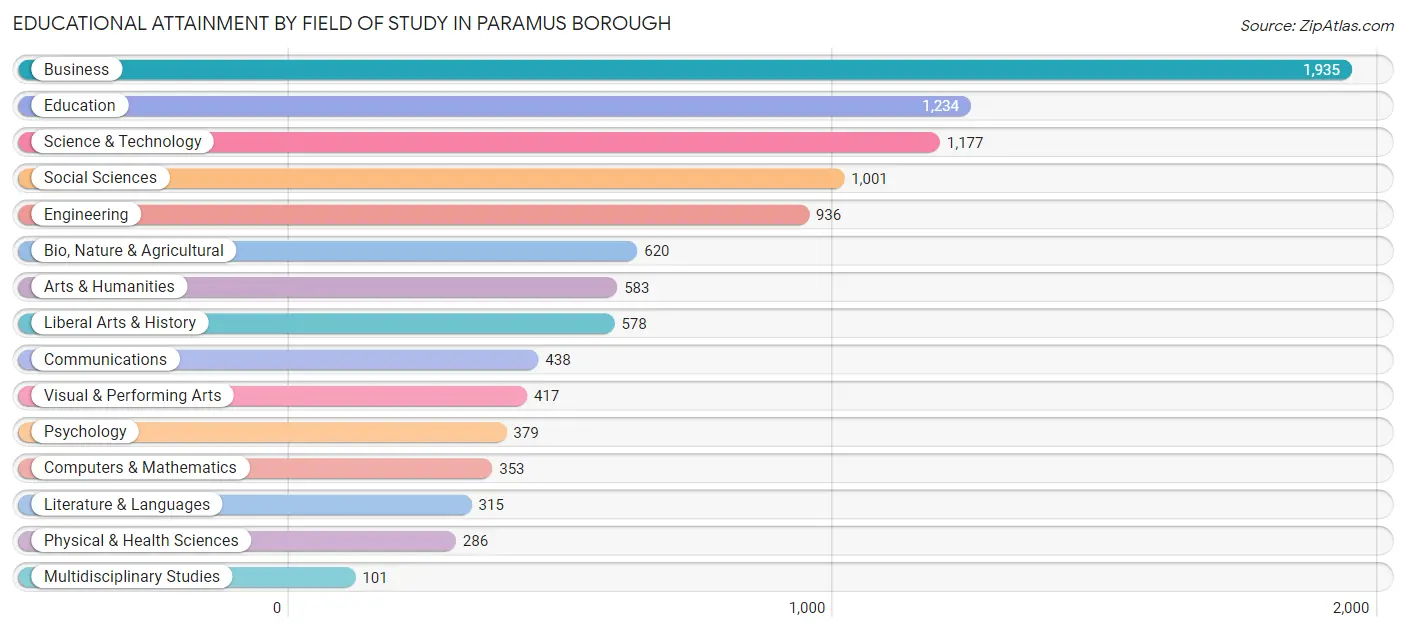
| Field of Study | # Graduates | % Graduates |
| Computers & Mathematics | 353 | 3.4% |
| Bio, Nature & Agricultural | 620 | 6.0% |
| Physical & Health Sciences | 286 | 2.8% |
| Psychology | 379 | 3.7% |
| Social Sciences | 1,001 | 9.7% |
| Engineering | 936 | 9.0% |
| Multidisciplinary Studies | 101 | 1.0% |
| Science & Technology | 1,177 | 11.4% |
| Business | 1,935 | 18.7% |
| Education | 1,234 | 11.9% |
| Literature & Languages | 315 | 3.0% |
| Liberal Arts & History | 578 | 5.6% |
| Visual & Performing Arts | 417 | 4.0% |
| Communications | 438 | 4.2% |
| Arts & Humanities | 583 | 5.6% |
| Total | 10,353 | 100.0% |
Transportation & Commute in Paramus borough
Vehicle Availability by Sex in Paramus borough
The most prevalent vehicle ownership categories in Paramus borough are males with 2 vehicles (2,838, accounting for 44.3%) and females with 2 vehicles (2,221, making up 52.4%).
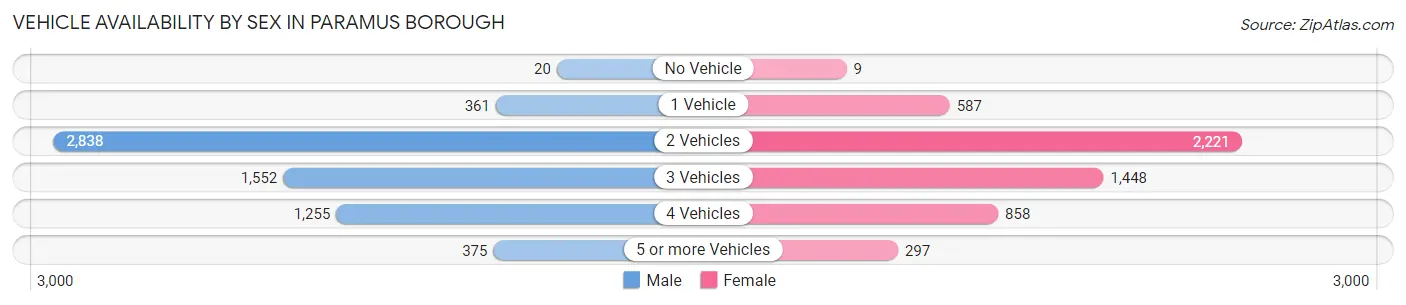
| Vehicles Available | Male | Female |
| No Vehicle | 20 (0.3%) | 9 (0.2%) |
| 1 Vehicle | 361 (5.6%) | 587 (10.8%) |
| 2 Vehicles | 2,838 (44.3%) | 2,221 (41.0%) |
| 3 Vehicles | 1,552 (24.2%) | 1,448 (26.7%) |
| 4 Vehicles | 1,255 (19.6%) | 858 (15.8%) |
| 5 or more Vehicles | 375 (5.9%) | 297 (5.5%) |
| Total | 6,401 (100.0%) | 5,420 (100.0%) |
Commute Time in Paramus borough
The most frequently occuring commute durations in Paramus borough are 20 to 24 minutes (1,806 commuters, 18.9%), 60 to 89 minutes (1,354 commuters, 14.2%), and 15 to 19 minutes (1,122 commuters, 11.8%).
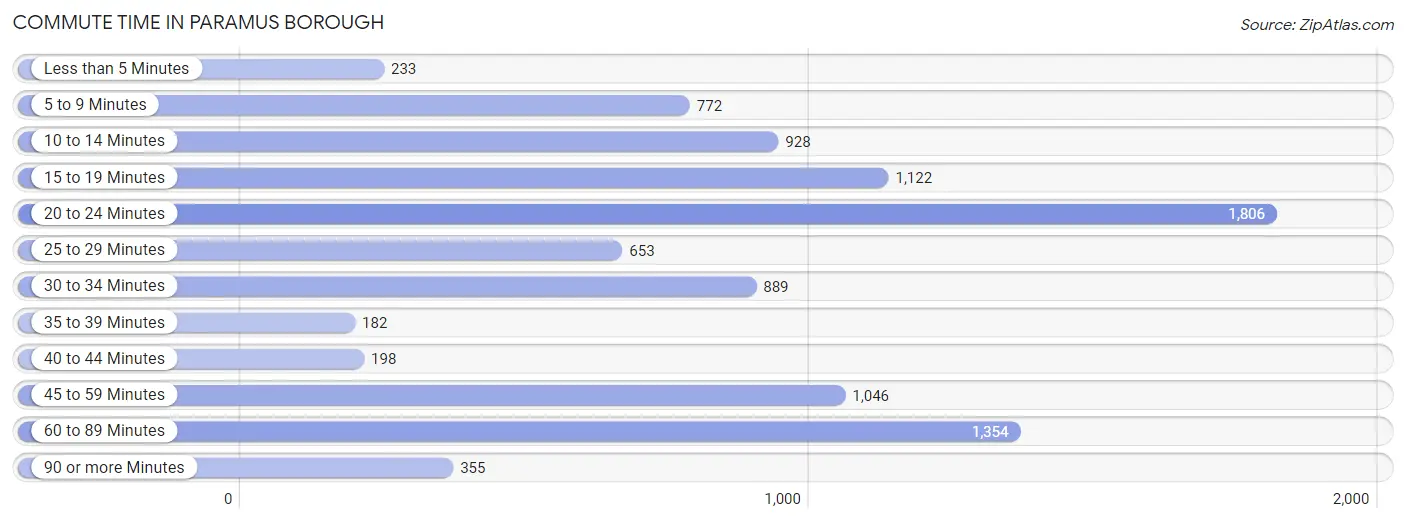
| Commute Time | # Commuters | % Commuters |
| Less than 5 Minutes | 233 | 2.4% |
| 5 to 9 Minutes | 772 | 8.1% |
| 10 to 14 Minutes | 928 | 9.7% |
| 15 to 19 Minutes | 1,122 | 11.8% |
| 20 to 24 Minutes | 1,806 | 18.9% |
| 25 to 29 Minutes | 653 | 6.9% |
| 30 to 34 Minutes | 889 | 9.3% |
| 35 to 39 Minutes | 182 | 1.9% |
| 40 to 44 Minutes | 198 | 2.1% |
| 45 to 59 Minutes | 1,046 | 11.0% |
| 60 to 89 Minutes | 1,354 | 14.2% |
| 90 or more Minutes | 355 | 3.7% |
Commute Time by Sex in Paramus borough
The most common commute times in Paramus borough are 60 to 89 minutes (971 commuters, 18.4%) for males and 20 to 24 minutes (892 commuters, 21.0%) for females.
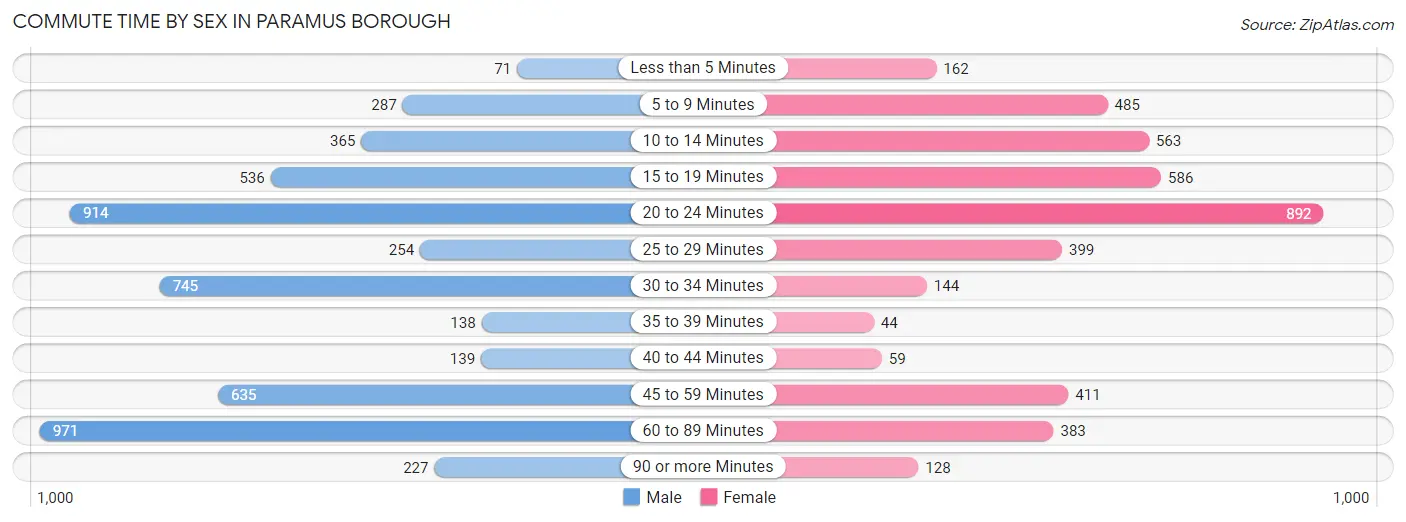
| Commute Time | Male | Female |
| Less than 5 Minutes | 71 (1.3%) | 162 (3.8%) |
| 5 to 9 Minutes | 287 (5.4%) | 485 (11.4%) |
| 10 to 14 Minutes | 365 (6.9%) | 563 (13.2%) |
| 15 to 19 Minutes | 536 (10.2%) | 586 (13.8%) |
| 20 to 24 Minutes | 914 (17.3%) | 892 (21.0%) |
| 25 to 29 Minutes | 254 (4.8%) | 399 (9.4%) |
| 30 to 34 Minutes | 745 (14.1%) | 144 (3.4%) |
| 35 to 39 Minutes | 138 (2.6%) | 44 (1.0%) |
| 40 to 44 Minutes | 139 (2.6%) | 59 (1.4%) |
| 45 to 59 Minutes | 635 (12.0%) | 411 (9.7%) |
| 60 to 89 Minutes | 971 (18.4%) | 383 (9.0%) |
| 90 or more Minutes | 227 (4.3%) | 128 (3.0%) |
Time of Departure to Work by Sex in Paramus borough
The most frequent times of departure to work in Paramus borough are 7:00 AM to 7:29 AM (935, 17.7%) for males and 8:00 AM to 8:29 AM (980, 23.0%) for females.
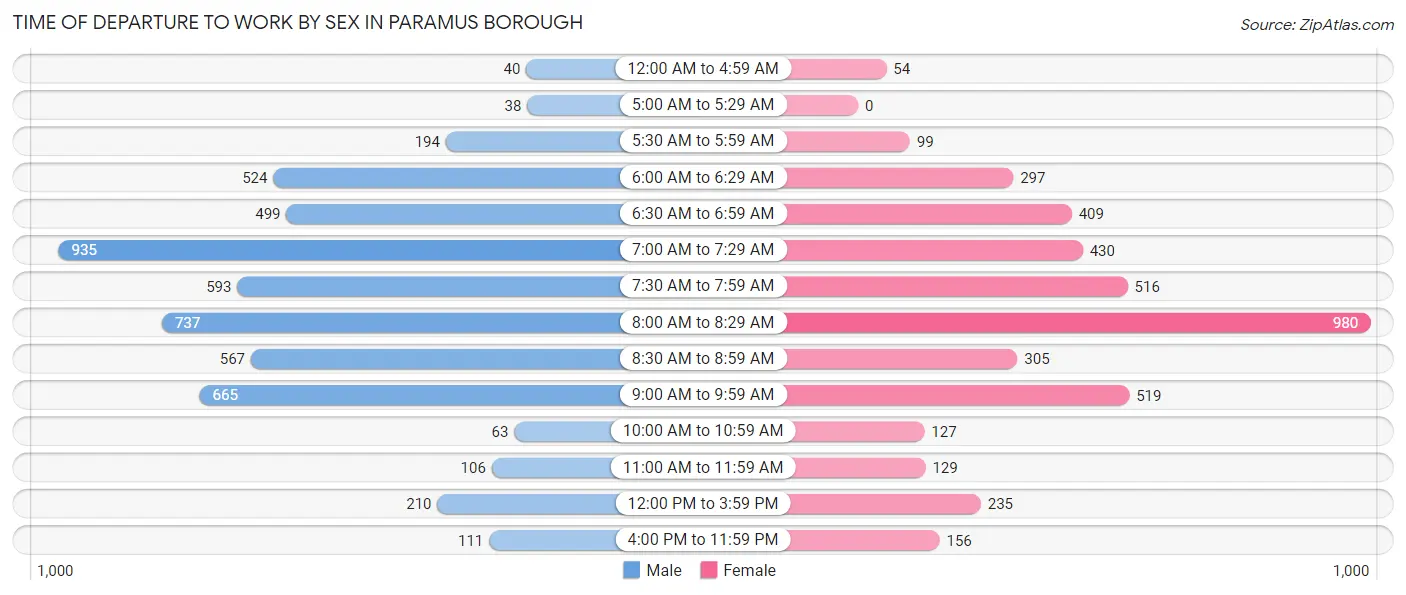
| Time of Departure | Male | Female |
| 12:00 AM to 4:59 AM | 40 (0.8%) | 54 (1.3%) |
| 5:00 AM to 5:29 AM | 38 (0.7%) | 0 (0.0%) |
| 5:30 AM to 5:59 AM | 194 (3.7%) | 99 (2.3%) |
| 6:00 AM to 6:29 AM | 524 (9.9%) | 297 (7.0%) |
| 6:30 AM to 6:59 AM | 499 (9.5%) | 409 (9.6%) |
| 7:00 AM to 7:29 AM | 935 (17.7%) | 430 (10.1%) |
| 7:30 AM to 7:59 AM | 593 (11.2%) | 516 (12.1%) |
| 8:00 AM to 8:29 AM | 737 (14.0%) | 980 (23.0%) |
| 8:30 AM to 8:59 AM | 567 (10.7%) | 305 (7.2%) |
| 9:00 AM to 9:59 AM | 665 (12.6%) | 519 (12.2%) |
| 10:00 AM to 10:59 AM | 63 (1.2%) | 127 (3.0%) |
| 11:00 AM to 11:59 AM | 106 (2.0%) | 129 (3.0%) |
| 12:00 PM to 3:59 PM | 210 (4.0%) | 235 (5.5%) |
| 4:00 PM to 11:59 PM | 111 (2.1%) | 156 (3.7%) |
| Total | 5,282 (100.0%) | 4,256 (100.0%) |
Housing Occupancy in Paramus borough
Occupancy by Ownership in Paramus borough
Of the total 8,410 dwellings in Paramus borough, owner-occupied units account for 6,853 (81.5%), while renter-occupied units make up 1,557 (18.5%).
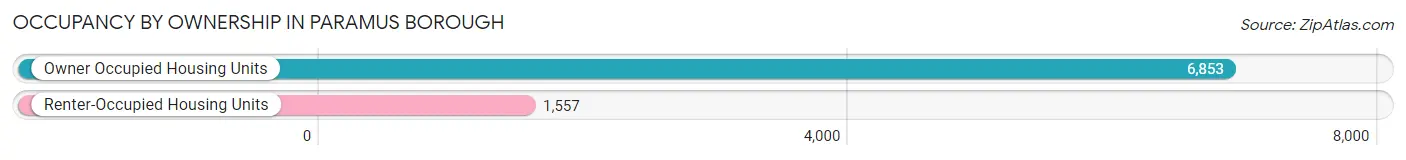
| Occupancy | # Housing Units | % Housing Units |
| Owner Occupied Housing Units | 6,853 | 81.5% |
| Renter-Occupied Housing Units | 1,557 | 18.5% |
| Total Occupied Housing Units | 8,410 | 100.0% |
Occupancy by Household Size in Paramus borough
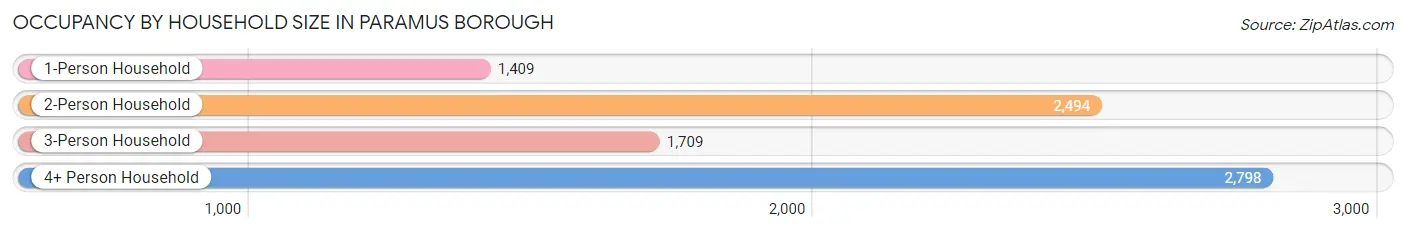
| Household Size | # Housing Units | % Housing Units |
| 1-Person Household | 1,409 | 16.8% |
| 2-Person Household | 2,494 | 29.7% |
| 3-Person Household | 1,709 | 20.3% |
| 4+ Person Household | 2,798 | 33.3% |
| Total Housing Units | 8,410 | 100.0% |
Occupancy by Ownership by Household Size in Paramus borough
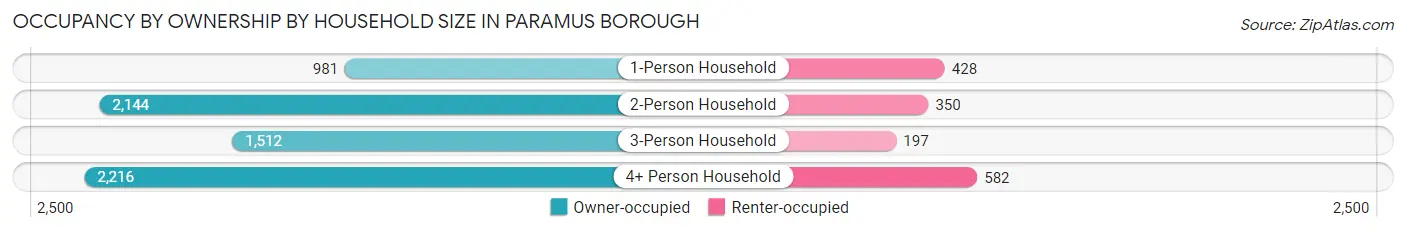
| Household Size | Owner-occupied | Renter-occupied |
| 1-Person Household | 981 (69.6%) | 428 (30.4%) |
| 2-Person Household | 2,144 (86.0%) | 350 (14.0%) |
| 3-Person Household | 1,512 (88.5%) | 197 (11.5%) |
| 4+ Person Household | 2,216 (79.2%) | 582 (20.8%) |
| Total Housing Units | 6,853 (81.5%) | 1,557 (18.5%) |
Occupancy by Educational Attainment in Paramus borough
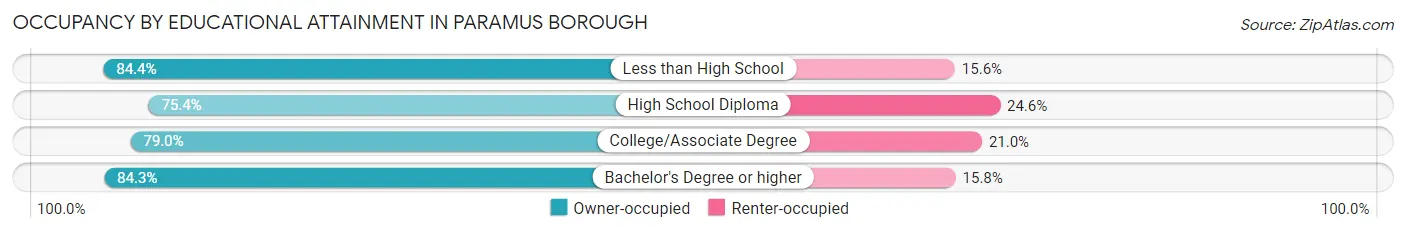
| Household Size | Owner-occupied | Renter-occupied |
| Less than High School | 146 (84.4%) | 27 (15.6%) |
| High School Diploma | 1,121 (75.4%) | 365 (24.6%) |
| College/Associate Degree | 1,538 (79.0%) | 408 (21.0%) |
| Bachelor's Degree or higher | 4,048 (84.3%) | 757 (15.8%) |
Occupancy by Age of Householder in Paramus borough
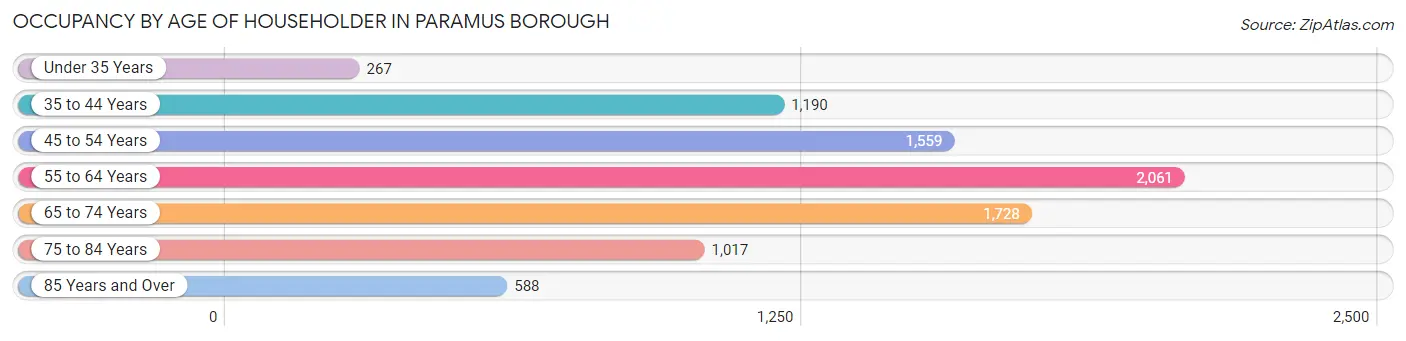
| Age Bracket | # Households | % Households |
| Under 35 Years | 267 | 3.2% |
| 35 to 44 Years | 1,190 | 14.1% |
| 45 to 54 Years | 1,559 | 18.5% |
| 55 to 64 Years | 2,061 | 24.5% |
| 65 to 74 Years | 1,728 | 20.5% |
| 75 to 84 Years | 1,017 | 12.1% |
| 85 Years and Over | 588 | 7.0% |
| Total | 8,410 | 100.0% |
Housing Finances in Paramus borough
Median Income by Occupancy in Paramus borough
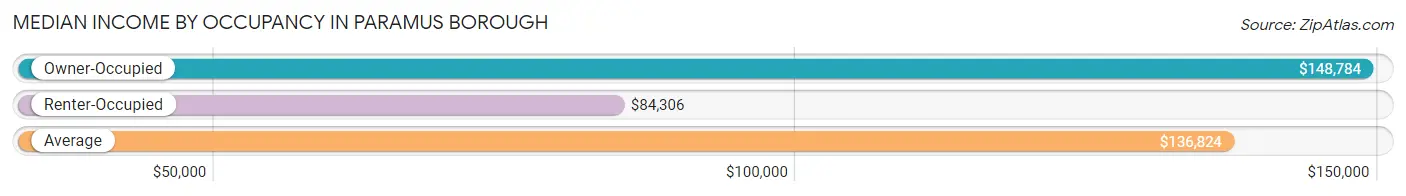
| Occupancy Type | # Households | Median Income |
| Owner-Occupied | 6,853 (81.5%) | $148,784 |
| Renter-Occupied | 1,557 (18.5%) | $84,306 |
| Average | 8,410 (100.0%) | $136,824 |
Occupancy by Householder Income Bracket in Paramus borough
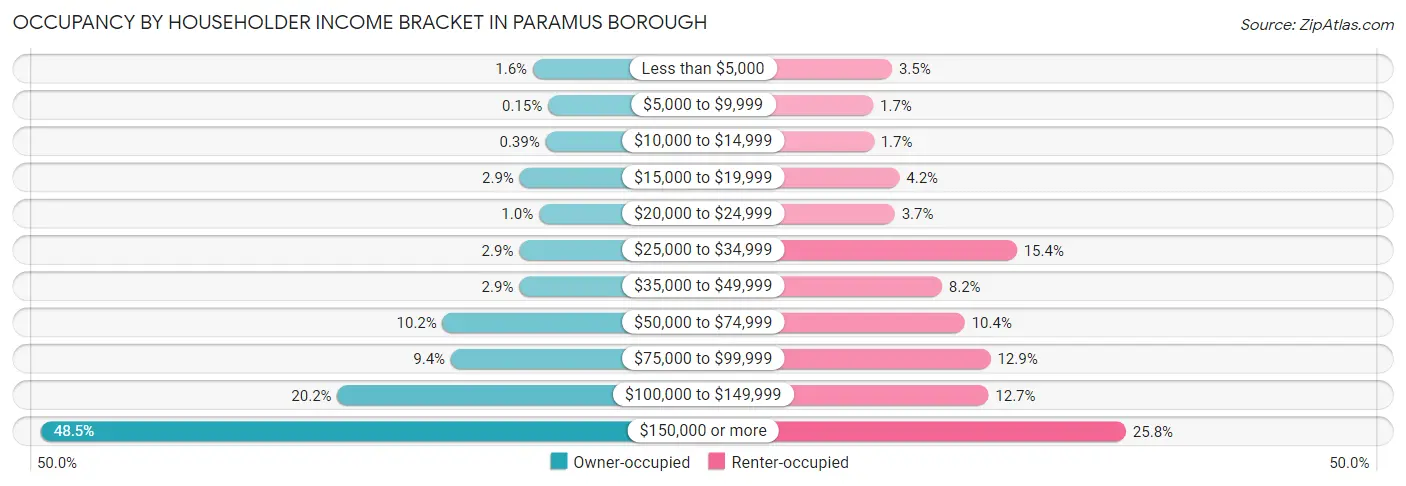
| Income Bracket | Owner-occupied | Renter-occupied |
| Less than $5,000 | 109 (1.6%) | 54 (3.5%) |
| $5,000 to $9,999 | 10 (0.2%) | 26 (1.7%) |
| $10,000 to $14,999 | 27 (0.4%) | 27 (1.7%) |
| $15,000 to $19,999 | 195 (2.9%) | 65 (4.2%) |
| $20,000 to $24,999 | 69 (1.0%) | 58 (3.7%) |
| $25,000 to $34,999 | 198 (2.9%) | 239 (15.3%) |
| $35,000 to $49,999 | 198 (2.9%) | 128 (8.2%) |
| $50,000 to $74,999 | 698 (10.2%) | 162 (10.4%) |
| $75,000 to $99,999 | 644 (9.4%) | 200 (12.9%) |
| $100,000 to $149,999 | 1,385 (20.2%) | 197 (12.7%) |
| $150,000 or more | 3,320 (48.4%) | 401 (25.8%) |
| Total | 6,853 (100.0%) | 1,557 (100.0%) |
Monthly Housing Cost Tiers in Paramus borough
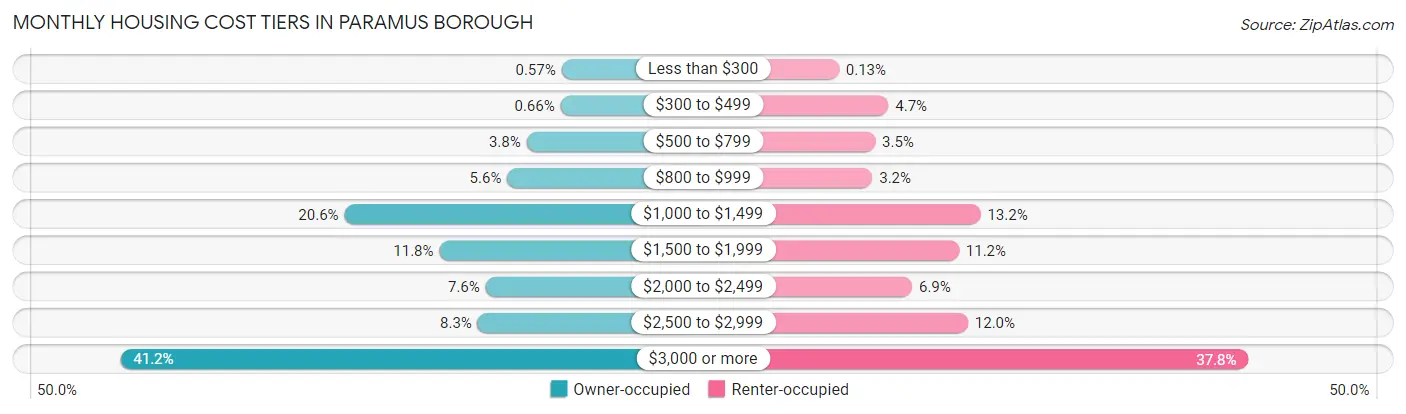
| Monthly Cost | Owner-occupied | Renter-occupied |
| Less than $300 | 39 (0.6%) | 2 (0.1%) |
| $300 to $499 | 45 (0.7%) | 73 (4.7%) |
| $500 to $799 | 260 (3.8%) | 54 (3.5%) |
| $800 to $999 | 382 (5.6%) | 50 (3.2%) |
| $1,000 to $1,499 | 1,409 (20.6%) | 205 (13.2%) |
| $1,500 to $1,999 | 810 (11.8%) | 174 (11.2%) |
| $2,000 to $2,499 | 518 (7.6%) | 107 (6.9%) |
| $2,500 to $2,999 | 568 (8.3%) | 187 (12.0%) |
| $3,000 or more | 2,822 (41.2%) | 589 (37.8%) |
| Total | 6,853 (100.0%) | 1,557 (100.0%) |
Physical Housing Characteristics in Paramus borough
Housing Structures in Paramus borough
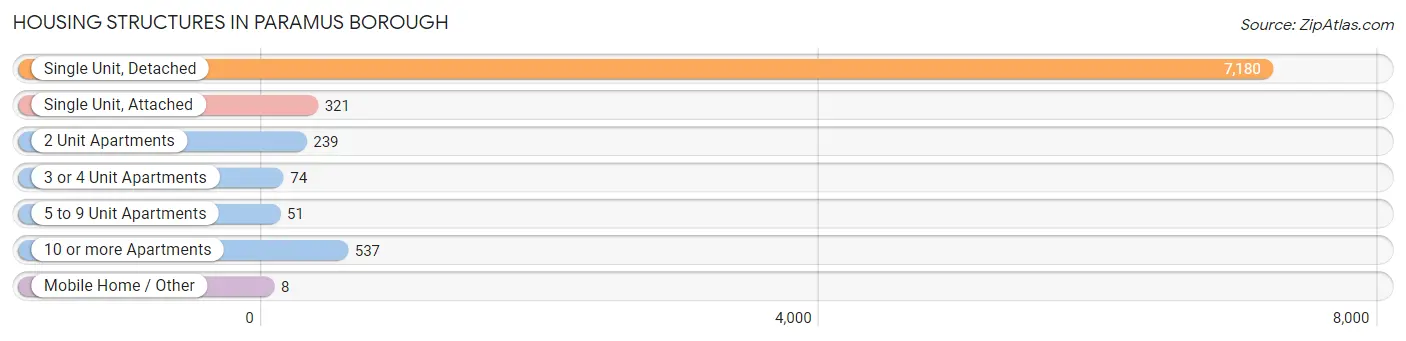
| Structure Type | # Housing Units | % Housing Units |
| Single Unit, Detached | 7,180 | 85.4% |
| Single Unit, Attached | 321 | 3.8% |
| 2 Unit Apartments | 239 | 2.8% |
| 3 or 4 Unit Apartments | 74 | 0.9% |
| 5 to 9 Unit Apartments | 51 | 0.6% |
| 10 or more Apartments | 537 | 6.4% |
| Mobile Home / Other | 8 | 0.1% |
| Total | 8,410 | 100.0% |
Housing Structures by Occupancy in Paramus borough
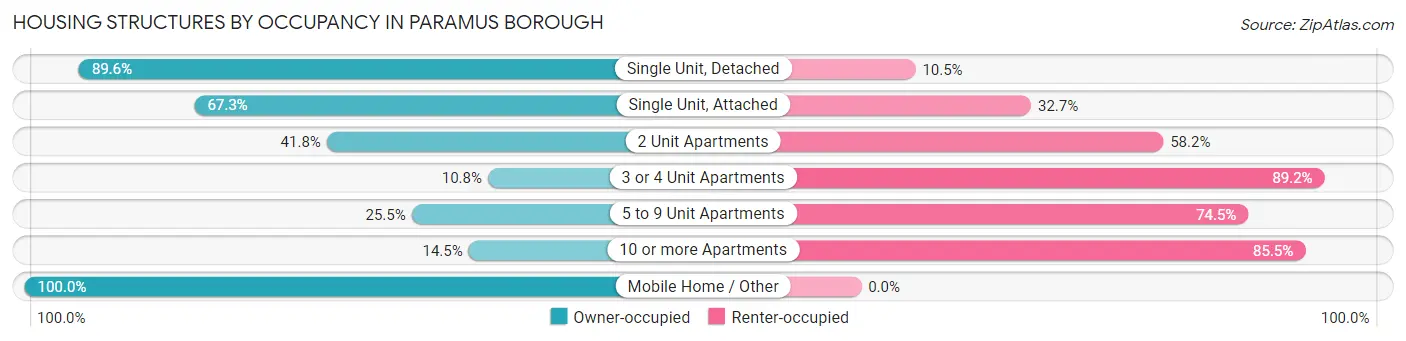
| Structure Type | Owner-occupied | Renter-occupied |
| Single Unit, Detached | 6,430 (89.5%) | 750 (10.4%) |
| Single Unit, Attached | 216 (67.3%) | 105 (32.7%) |
| 2 Unit Apartments | 100 (41.8%) | 139 (58.2%) |
| 3 or 4 Unit Apartments | 8 (10.8%) | 66 (89.2%) |
| 5 to 9 Unit Apartments | 13 (25.5%) | 38 (74.5%) |
| 10 or more Apartments | 78 (14.5%) | 459 (85.5%) |
| Mobile Home / Other | 8 (100.0%) | 0 (0.0%) |
| Total | 6,853 (81.5%) | 1,557 (18.5%) |
Housing Structures by Number of Rooms in Paramus borough
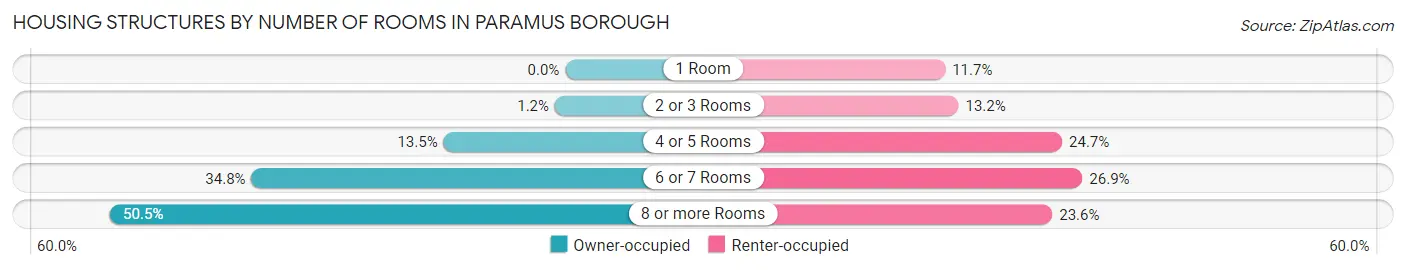
| Number of Rooms | Owner-occupied | Renter-occupied |
| 1 Room | 0 (0.0%) | 182 (11.7%) |
| 2 or 3 Rooms | 79 (1.1%) | 205 (13.2%) |
| 4 or 5 Rooms | 926 (13.5%) | 384 (24.7%) |
| 6 or 7 Rooms | 2,387 (34.8%) | 419 (26.9%) |
| 8 or more Rooms | 3,461 (50.5%) | 367 (23.6%) |
| Total | 6,853 (100.0%) | 1,557 (100.0%) |
Housing Structure by Heating Type in Paramus borough
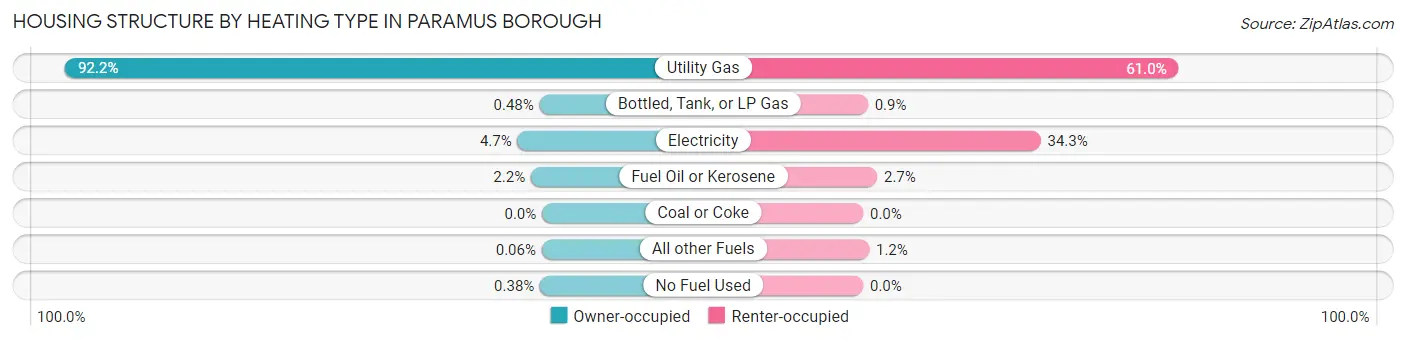
| Heating Type | Owner-occupied | Renter-occupied |
| Utility Gas | 6,318 (92.2%) | 949 (61.0%) |
| Bottled, Tank, or LP Gas | 33 (0.5%) | 14 (0.9%) |
| Electricity | 325 (4.7%) | 534 (34.3%) |
| Fuel Oil or Kerosene | 147 (2.1%) | 42 (2.7%) |
| Coal or Coke | 0 (0.0%) | 0 (0.0%) |
| All other Fuels | 4 (0.1%) | 18 (1.2%) |
| No Fuel Used | 26 (0.4%) | 0 (0.0%) |
| Total | 6,853 (100.0%) | 1,557 (100.0%) |
Household Vehicle Usage in Paramus borough
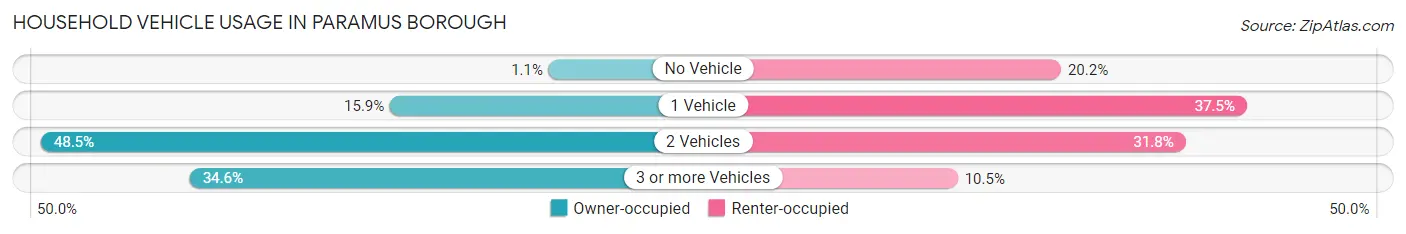
| Vehicles per Household | Owner-occupied | Renter-occupied |
| No Vehicle | 73 (1.1%) | 314 (20.2%) |
| 1 Vehicle | 1,088 (15.9%) | 584 (37.5%) |
| 2 Vehicles | 3,322 (48.5%) | 495 (31.8%) |
| 3 or more Vehicles | 2,370 (34.6%) | 164 (10.5%) |
| Total | 6,853 (100.0%) | 1,557 (100.0%) |
Real Estate & Mortgages in Paramus borough
Real Estate and Mortgage Overview in Paramus borough
| Characteristic | Without Mortgage | With Mortgage |
| Housing Units | 2,777 | 4,076 |
| Median Property Value | $622,900 | $737,300 |
| Median Household Income | $118,125 | $2,295 |
| Monthly Housing Costs | $1,258 | $2,780 |
| Real Estate Taxes | $9,617 | $40 |
Property Value by Mortgage Status in Paramus borough
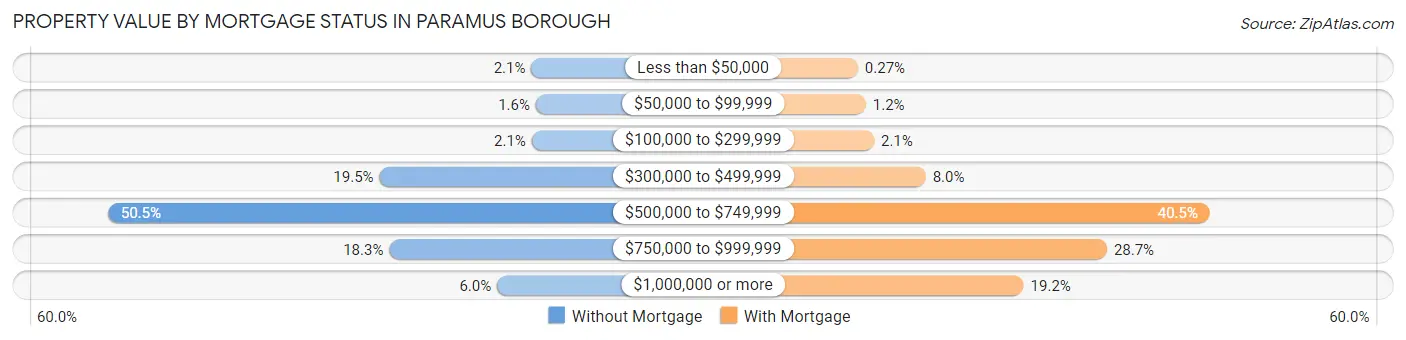
| Property Value | Without Mortgage | With Mortgage |
| Less than $50,000 | 58 (2.1%) | 11 (0.3%) |
| $50,000 to $99,999 | 44 (1.6%) | 48 (1.2%) |
| $100,000 to $299,999 | 57 (2.1%) | 86 (2.1%) |
| $300,000 to $499,999 | 540 (19.5%) | 327 (8.0%) |
| $500,000 to $749,999 | 1,402 (50.5%) | 1,650 (40.5%) |
| $750,000 to $999,999 | 509 (18.3%) | 1,171 (28.7%) |
| $1,000,000 or more | 167 (6.0%) | 783 (19.2%) |
| Total | 2,777 (100.0%) | 4,076 (100.0%) |
Household Income by Mortgage Status in Paramus borough
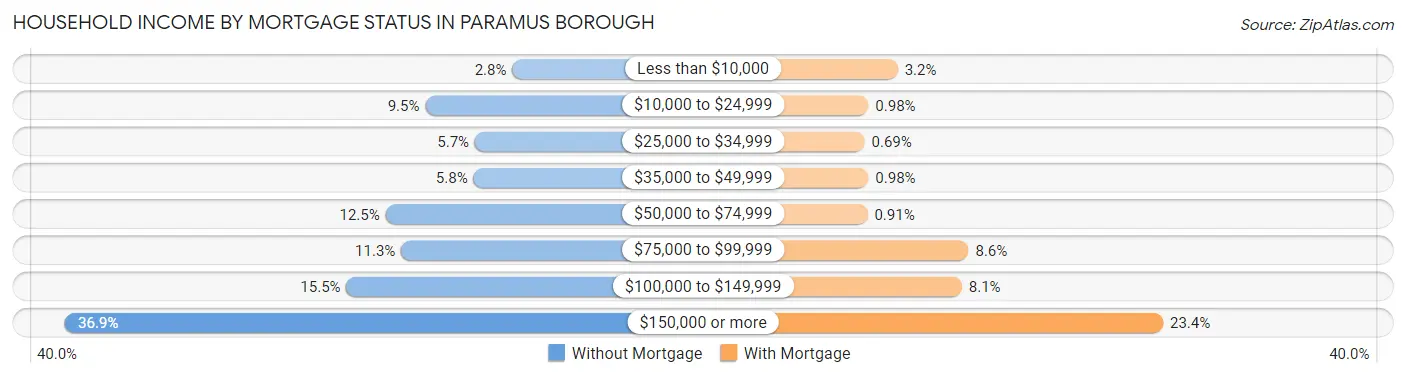
| Household Income | Without Mortgage | With Mortgage |
| Less than $10,000 | 79 (2.8%) | 131 (3.2%) |
| $10,000 to $24,999 | 263 (9.5%) | 40 (1.0%) |
| $25,000 to $34,999 | 158 (5.7%) | 28 (0.7%) |
| $35,000 to $49,999 | 161 (5.8%) | 40 (1.0%) |
| $50,000 to $74,999 | 347 (12.5%) | 37 (0.9%) |
| $75,000 to $99,999 | 314 (11.3%) | 351 (8.6%) |
| $100,000 to $149,999 | 430 (15.5%) | 330 (8.1%) |
| $150,000 or more | 1,025 (36.9%) | 955 (23.4%) |
| Total | 2,777 (100.0%) | 4,076 (100.0%) |
Property Value to Household Income Ratio in Paramus borough
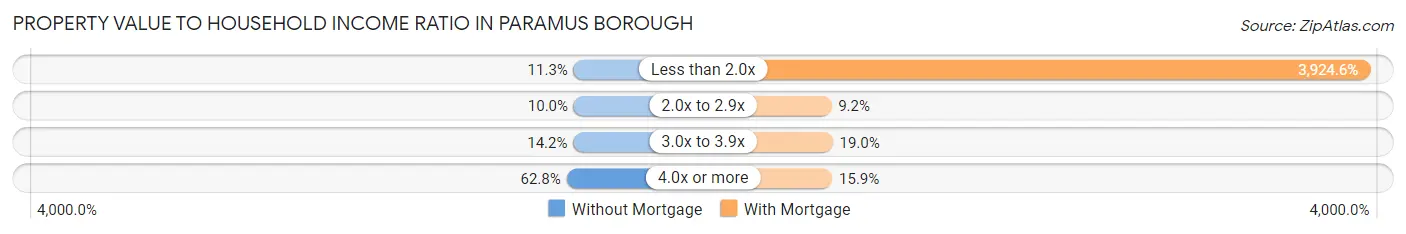
| Value-to-Income Ratio | Without Mortgage | With Mortgage |
| Less than 2.0x | 313 (11.3%) | 159,966 (3,924.6%) |
| 2.0x to 2.9x | 278 (10.0%) | 375 (9.2%) |
| 3.0x to 3.9x | 394 (14.2%) | 774 (19.0%) |
| 4.0x or more | 1,745 (62.8%) | 649 (15.9%) |
| Total | 2,777 (100.0%) | 4,076 (100.0%) |
Real Estate Taxes by Mortgage Status in Paramus borough
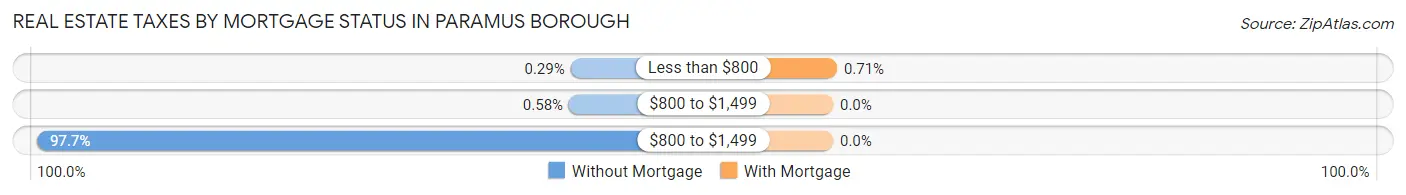
| Property Taxes | Without Mortgage | With Mortgage |
| Less than $800 | 8 (0.3%) | 29 (0.7%) |
| $800 to $1,499 | 16 (0.6%) | 0 (0.0%) |
| $800 to $1,499 | 2,714 (97.7%) | 0 (0.0%) |
| Total | 2,777 (100.0%) | 4,076 (100.0%) |
Health & Disability in Paramus borough
Health Insurance Coverage by Age in Paramus borough
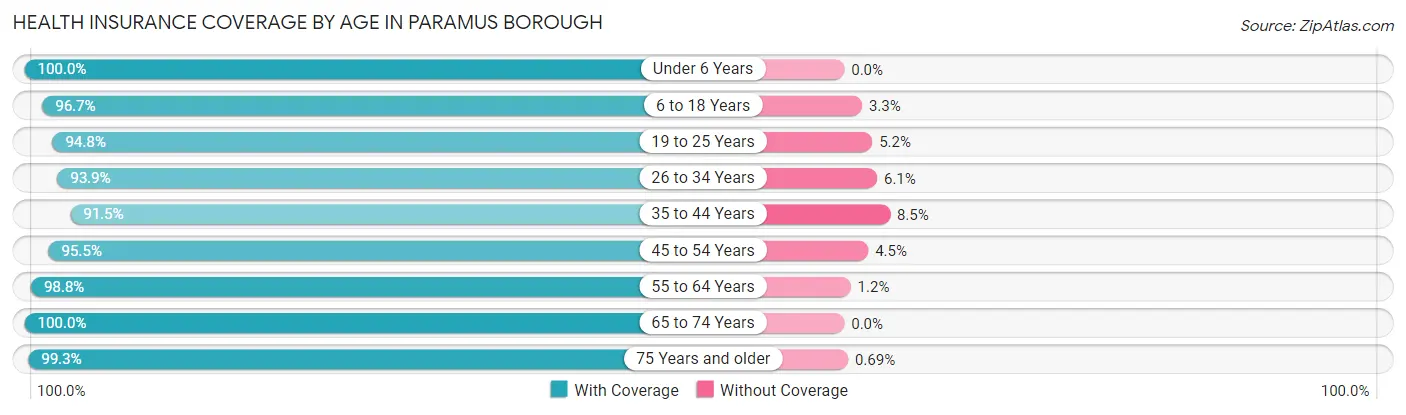
| Age Bracket | With Coverage | Without Coverage |
| Under 6 Years | 1,218 (100.0%) | 0 (0.0%) |
| 6 to 18 Years | 3,868 (96.7%) | 132 (3.3%) |
| 19 to 25 Years | 1,912 (94.8%) | 105 (5.2%) |
| 26 to 34 Years | 1,876 (93.9%) | 122 (6.1%) |
| 35 to 44 Years | 2,651 (91.5%) | 247 (8.5%) |
| 45 to 54 Years | 2,891 (95.5%) | 135 (4.5%) |
| 55 to 64 Years | 4,074 (98.8%) | 49 (1.2%) |
| 65 to 74 Years | 3,252 (100.0%) | 0 (0.0%) |
| 75 Years and older | 2,605 (99.3%) | 18 (0.7%) |
| Total | 24,347 (96.8%) | 808 (3.2%) |
Health Insurance Coverage by Citizenship Status in Paramus borough
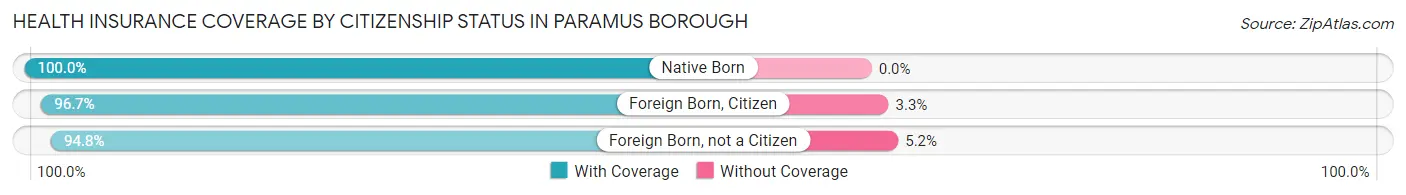
| Citizenship Status | With Coverage | Without Coverage |
| Native Born | 1,218 (100.0%) | 0 (0.0%) |
| Foreign Born, Citizen | 3,868 (96.7%) | 132 (3.3%) |
| Foreign Born, not a Citizen | 1,912 (94.8%) | 105 (5.2%) |
Health Insurance Coverage by Household Income in Paramus borough
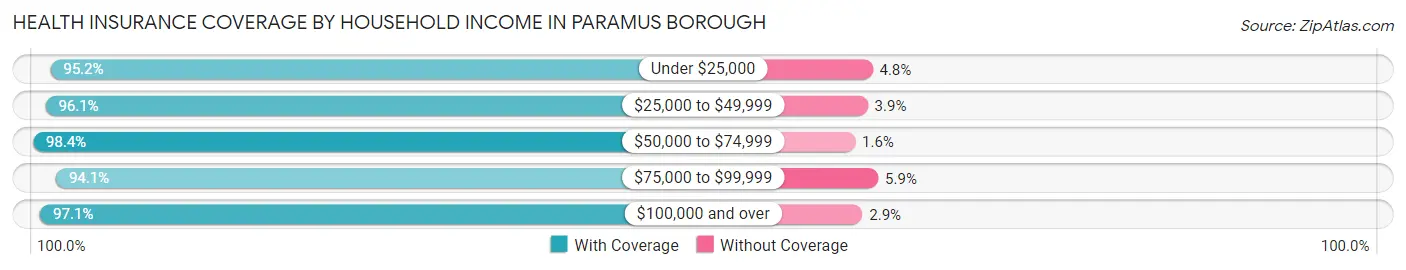
| Household Income | With Coverage | Without Coverage |
| Under $25,000 | 948 (95.2%) | 48 (4.8%) |
| $25,000 to $49,999 | 1,252 (96.1%) | 51 (3.9%) |
| $50,000 to $74,999 | 2,468 (98.4%) | 39 (1.6%) |
| $75,000 to $99,999 | 2,033 (94.1%) | 127 (5.9%) |
| $100,000 and over | 17,460 (97.1%) | 526 (2.9%) |
Public vs Private Health Insurance Coverage by Age in Paramus borough
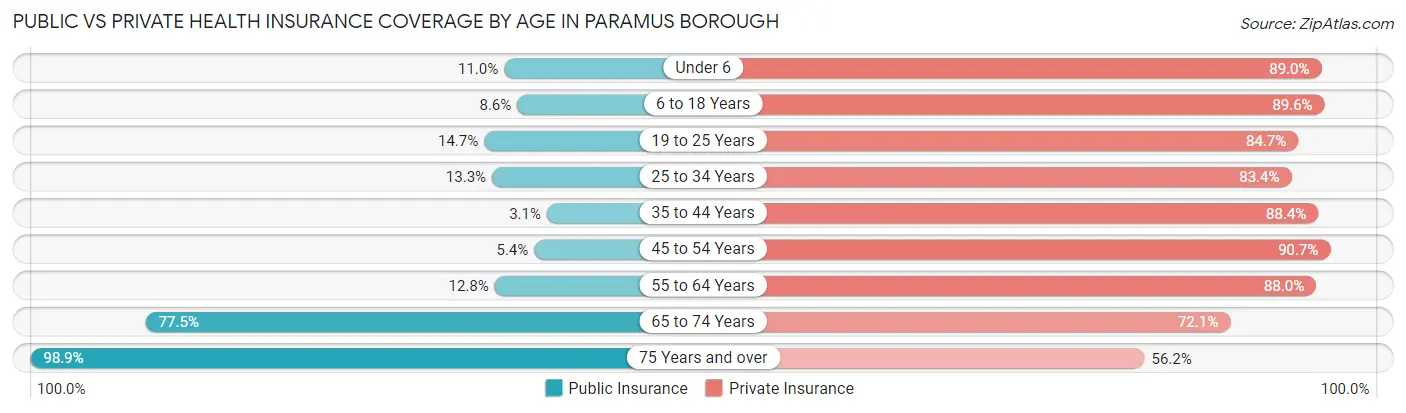
| Age Bracket | Public Insurance | Private Insurance |
| Under 6 | 134 (11.0%) | 1,084 (89.0%) |
| 6 to 18 Years | 343 (8.6%) | 3,583 (89.6%) |
| 19 to 25 Years | 297 (14.7%) | 1,708 (84.7%) |
| 25 to 34 Years | 265 (13.3%) | 1,667 (83.4%) |
| 35 to 44 Years | 89 (3.1%) | 2,562 (88.4%) |
| 45 to 54 Years | 164 (5.4%) | 2,743 (90.6%) |
| 55 to 64 Years | 526 (12.8%) | 3,629 (88.0%) |
| 65 to 74 Years | 2,521 (77.5%) | 2,343 (72.1%) |
| 75 Years and over | 2,595 (98.9%) | 1,474 (56.2%) |
| Total | 6,934 (27.6%) | 20,793 (82.7%) |
Disability Status by Sex by Age in Paramus borough
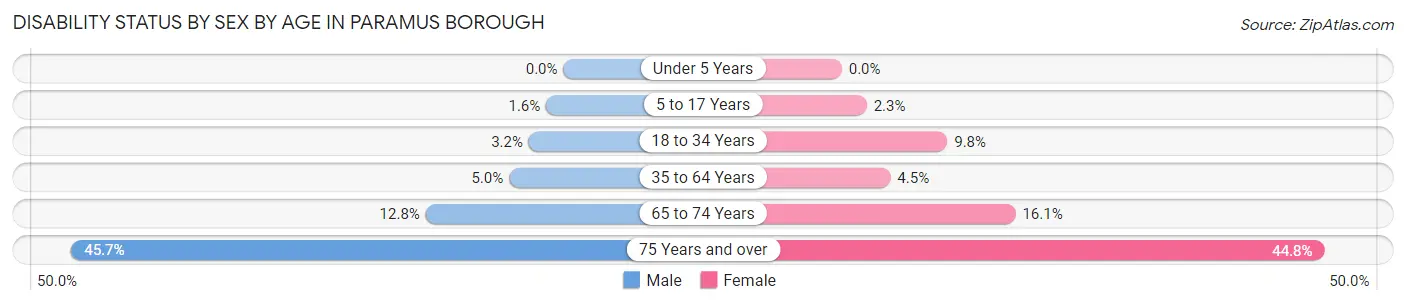
| Age Bracket | Male | Female |
| Under 5 Years | 0 (0.0%) | 0 (0.0%) |
| 5 to 17 Years | 34 (1.6%) | 42 (2.3%) |
| 18 to 34 Years | 76 (3.2%) | 194 (9.8%) |
| 35 to 64 Years | 247 (5.0%) | 232 (4.5%) |
| 65 to 74 Years | 219 (12.8%) | 248 (16.1%) |
| 75 Years and over | 437 (45.7%) | 746 (44.8%) |
Disability Class by Sex by Age in Paramus borough
Disability Class: Hearing Difficulty
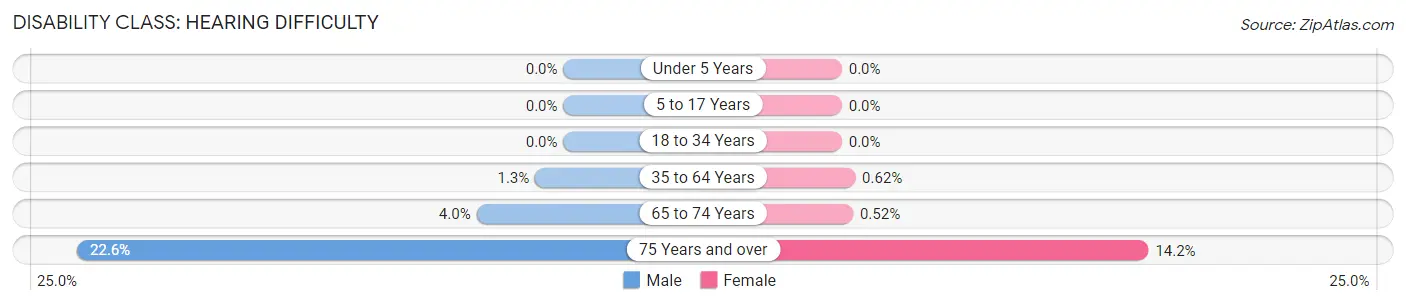
| Age Bracket | Male | Female |
| Under 5 Years | 0 (0.0%) | 0 (0.0%) |
| 5 to 17 Years | 0 (0.0%) | 0 (0.0%) |
| 18 to 34 Years | 0 (0.0%) | 0 (0.0%) |
| 35 to 64 Years | 64 (1.3%) | 32 (0.6%) |
| 65 to 74 Years | 69 (4.0%) | 8 (0.5%) |
| 75 Years and over | 216 (22.6%) | 237 (14.2%) |
Disability Class: Vision Difficulty
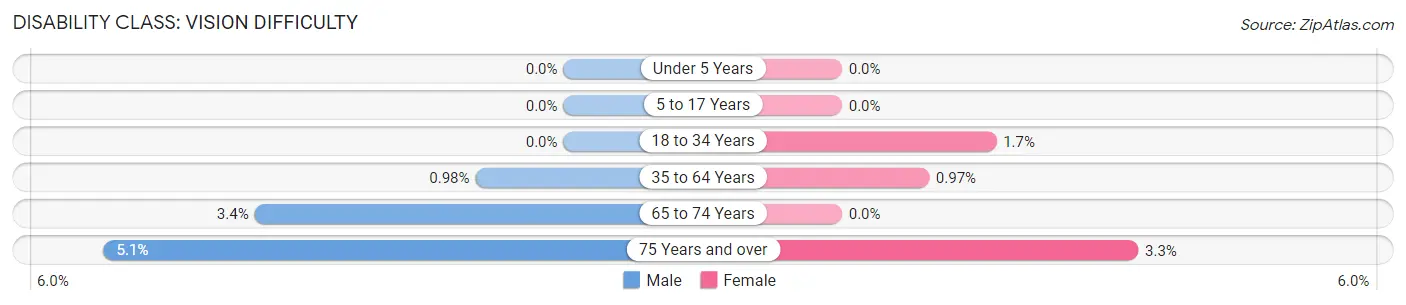
| Age Bracket | Male | Female |
| Under 5 Years | 0 (0.0%) | 0 (0.0%) |
| 5 to 17 Years | 0 (0.0%) | 0 (0.0%) |
| 18 to 34 Years | 0 (0.0%) | 34 (1.7%) |
| 35 to 64 Years | 48 (1.0%) | 50 (1.0%) |
| 65 to 74 Years | 59 (3.4%) | 0 (0.0%) |
| 75 Years and over | 49 (5.1%) | 55 (3.3%) |
Disability Class: Cognitive Difficulty
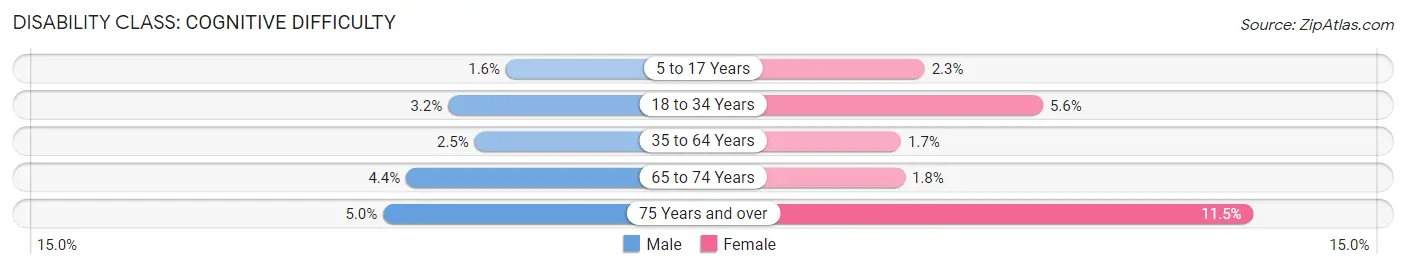
| Age Bracket | Male | Female |
| 5 to 17 Years | 34 (1.6%) | 42 (2.3%) |
| 18 to 34 Years | 76 (3.2%) | 111 (5.6%) |
| 35 to 64 Years | 121 (2.5%) | 85 (1.7%) |
| 65 to 74 Years | 75 (4.4%) | 27 (1.8%) |
| 75 Years and over | 48 (5.0%) | 191 (11.5%) |
Disability Class: Ambulatory Difficulty
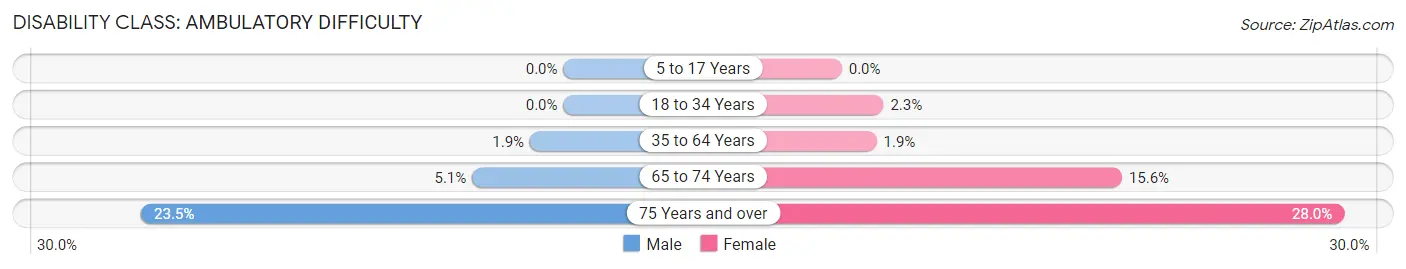
| Age Bracket | Male | Female |
| 5 to 17 Years | 0 (0.0%) | 0 (0.0%) |
| 18 to 34 Years | 0 (0.0%) | 46 (2.3%) |
| 35 to 64 Years | 91 (1.9%) | 100 (1.9%) |
| 65 to 74 Years | 87 (5.1%) | 240 (15.6%) |
| 75 Years and over | 225 (23.5%) | 466 (28.0%) |
Disability Class: Self-Care Difficulty
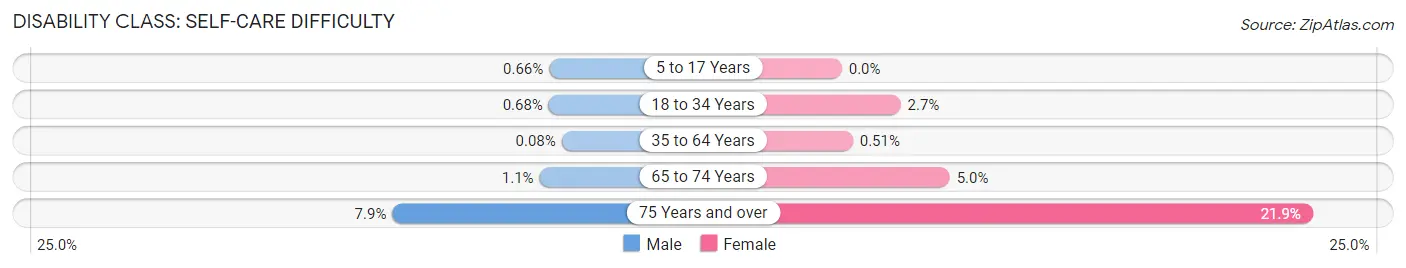
| Age Bracket | Male | Female |
| 5 to 17 Years | 14 (0.7%) | 0 (0.0%) |
| 18 to 34 Years | 16 (0.7%) | 54 (2.7%) |
| 35 to 64 Years | 4 (0.1%) | 26 (0.5%) |
| 65 to 74 Years | 19 (1.1%) | 77 (5.0%) |
| 75 Years and over | 76 (7.9%) | 364 (21.8%) |
Technology Access in Paramus borough
Computing Device Access in Paramus borough
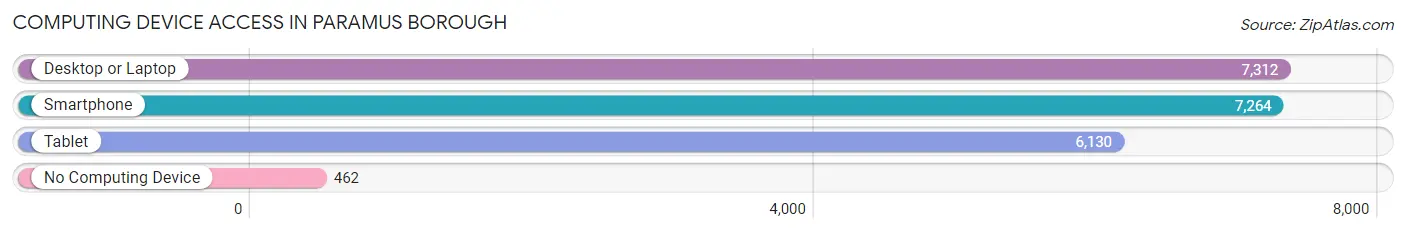
| Device Type | # Households | % Households |
| Desktop or Laptop | 7,312 | 86.9% |
| Smartphone | 7,264 | 86.4% |
| Tablet | 6,130 | 72.9% |
| No Computing Device | 462 | 5.5% |
| Total | 8,410 | 100.0% |
Internet Access in Paramus borough
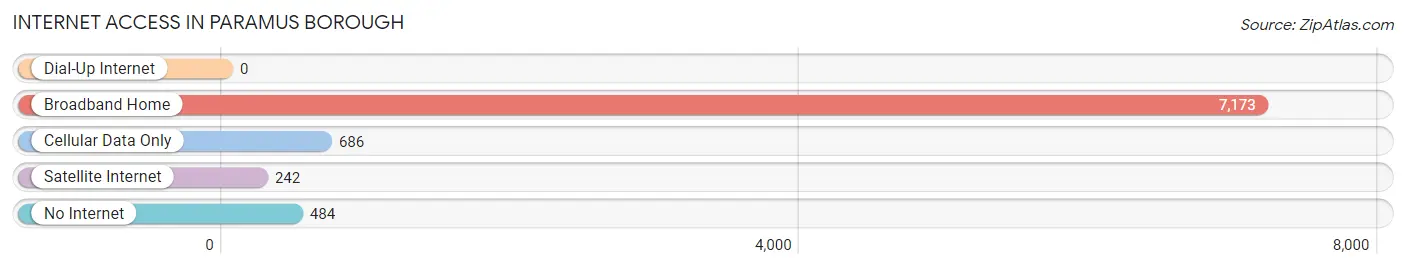
| Internet Type | # Households | % Households |
| Dial-Up Internet | 0 | 0.0% |
| Broadband Home | 7,173 | 85.3% |
| Cellular Data Only | 686 | 8.2% |
| Satellite Internet | 242 | 2.9% |
| No Internet | 484 | 5.8% |
| Total | 8,410 | 100.0% |
Paramus borough Summary
Paramus Borough, NJ is a small borough located in Bergen County, New Jersey. It is situated approximately 15 miles northwest of Manhattan and is part of the New York metropolitan area. The borough is home to a population of approximately 26,000 people, making it one of the most densely populated areas in the state.
History
Paramus was first settled in the early 1700s by Dutch settlers who named the area “Paramus” after the Native American word for “land of the wild turkeys.” The area was originally part of the larger Saddle River Township, which was established in 1710. In 1798, Paramus was officially incorporated as a borough.
Throughout the 19th century, Paramus was a rural farming community. In the early 20th century, the borough began to experience rapid growth as the area became increasingly suburbanized. This growth was largely due to the construction of the Garden State Parkway, which opened in 1954 and provided easy access to New York City.
Geography
Paramus is located in the northern part of Bergen County, New Jersey. It is bordered by the boroughs of Ridgewood, Fair Lawn, and Oradell, as well as the townships of Washington and Saddle River. The borough covers an area of 5.2 square miles and is home to a population of approximately 26,000 people.
The borough is situated on the western edge of the Hackensack River watershed and is part of the larger New York metropolitan area. The borough is home to several parks, including Van Saun County Park, which features a zoo, a carousel, and a miniature golf course.
Economy
Paramus is home to a diverse economy that is largely driven by the retail and service sectors. The borough is home to several large shopping malls, including the Garden State Plaza, which is the largest mall in New Jersey. The borough is also home to several corporate headquarters, including Toys “R” Us, Barnes & Noble, and Bed Bath & Beyond.
The borough is also home to several large employers, including the Hackensack University Medical Center, which is the largest employer in the borough. Other major employers include the Bergen County Technical Schools, the Bergen County Sheriff’s Office, and the Bergen County Prosecutor’s Office.
Demographics
As of the 2010 census, Paramus had a population of 26,342 people. The racial makeup of the borough was 79.3% White, 8.2% African American, 0.2% Native American, 8.2% Asian, and 4.1% from other races. Hispanic or Latino of any race were 11.7% of the population.
The median household income in Paramus was $90,917, and the median family income was $106,817. The per capita income for the borough was $41,945. About 4.2% of families and 5.7% of the population were below the poverty line, including 6.3% of those under age 18 and 5.2% of those age 65 or over.
Common Questions
What is Per Capita Income in Paramus borough?
Per Capita income in Paramus borough is $55,747.
What is the Median Family Income in Paramus borough?
Median Family Income in Paramus borough is $153,422.
What is the Median Household income in Paramus borough?
Median Household Income in Paramus borough is $136,824.
What is Income or Wage Gap in Paramus borough?
Income or Wage Gap in Paramus borough is 24.0%.
Women in Paramus borough earn 76.0 cents for every dollar earned by a man.
What is Inequality or Gini Index in Paramus borough?
Inequality or Gini Index in Paramus borough is 0.43.
What is the Total Population of Paramus borough?
Total Population of Paramus borough is 26,582.
What is the Total Male Population of Paramus borough?
Total Male Population of Paramus borough is 13,262.
What is the Total Female Population of Paramus borough?
Total Female Population of Paramus borough is 13,320.
What is the Ratio of Males per 100 Females in Paramus borough?
There are 99.56 Males per 100 Females in Paramus borough.
What is the Ratio of Females per 100 Males in Paramus borough?
There are 100.44 Females per 100 Males in Paramus borough.
What is the Median Population Age in Paramus borough?
Median Population Age in Paramus borough is 49.0 Years.
What is the Average Family Size in Paramus borough
Average Family Size in Paramus borough is 3.4 People.
What is the Average Household Size in Paramus borough
Average Household Size in Paramus borough is 3.0 People.
How Large is the Labor Force in Paramus borough?
There are 13,208 People in the Labor Forcein in Paramus borough.
What is the Percentage of People in the Labor Force in Paramus borough?
59.0% of People are in the Labor Force in Paramus borough.
What is the Unemployment Rate in Paramus borough?
Unemployment Rate in Paramus borough is 7.6%.