Harrington Park borough, NJ Map & Demographics
Harrington Park borough Overview
$89,088
PER CAPITA INCOME
$195,250
AVG FAMILY INCOME
$183,138
AVG HOUSEHOLD INCOME
48.4%
WAGE / INCOME GAP [ % ]
51.6¢/ $1
WAGE / INCOME GAP [ $ ]
0.47
INEQUALITY / GINI INDEX
4,826
TOTAL POPULATION
2,330
MALE POPULATION
2,496
FEMALE POPULATION
93.35
MALES / 100 FEMALES
107.12
FEMALES / 100 MALES
46.9
MEDIAN AGE
3.1
AVG FAMILY SIZE
2.8
AVG HOUSEHOLD SIZE
2,417
LABOR FORCE [ PEOPLE ]
63.5%
PERCENT IN LABOR FORCE
2.6%
UNEMPLOYMENT RATE
Income in Harrington Park borough
Income Overview in Harrington Park borough
Per Capita Income in Harrington Park borough is $89,088, while median incomes of families and households are $195,250 and $183,138 respectively.
| Characteristic | Number | Measure |
| Per Capita Income | 4,826 | $89,088 |
| Median Family Income | 1,480 | $195,250 |
| Mean Family Income | 1,480 | $281,407 |
| Median Household Income | 1,737 | $183,138 |
| Mean Household Income | 1,737 | $246,676 |
| Income Deficit | 1,480 | $0 |
| Wage / Income Gap (%) | 4,826 | 48.35% |
| Wage / Income Gap ($) | 4,826 | 51.65¢ per $1 |
| Gini / Inequality Index | 4,826 | 0.47 |
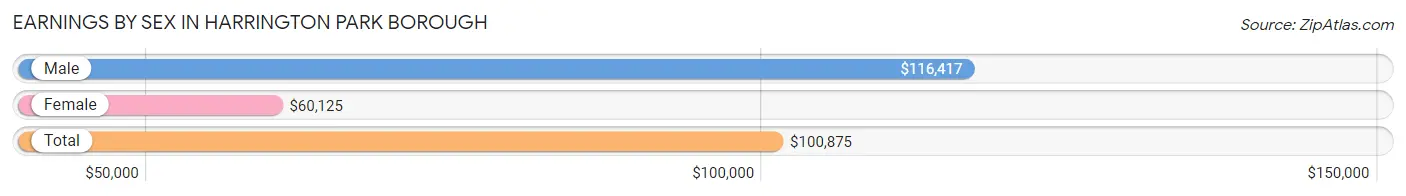
Earnings by Sex in Harrington Park borough
Average Earnings in Harrington Park borough are $100,875, $116,417 for men and $60,125 for women, a difference of 48.3%.
| Sex | Number | Average Earnings |
| Male | 1,485 (56.9%) | $116,417 |
| Female | 1,126 (43.1%) | $60,125 |
| Total | 2,611 (100.0%) | $100,875 |
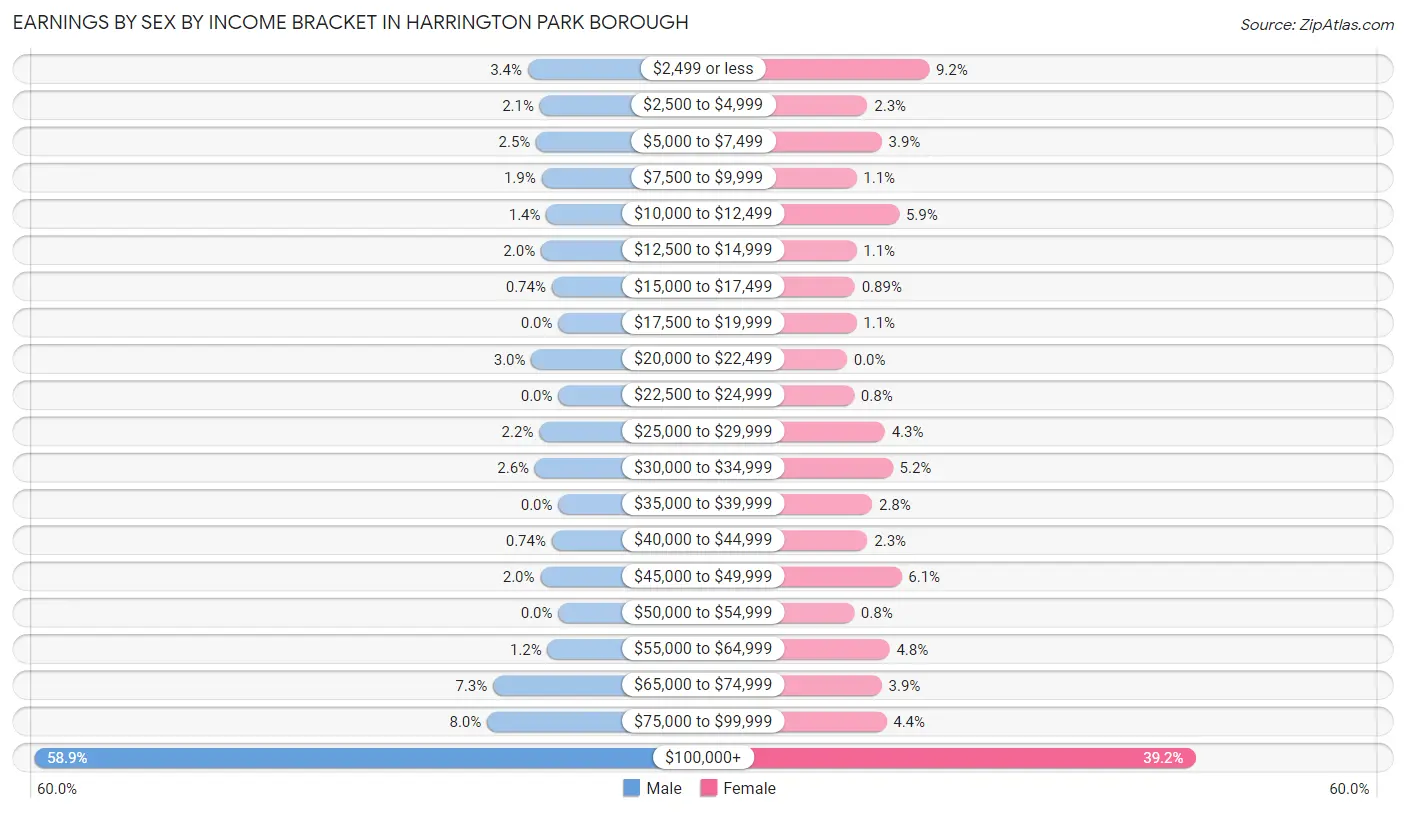
Earnings by Sex by Income Bracket in Harrington Park borough
The most common earnings brackets in Harrington Park borough are $100,000+ for men (875 | 58.9%) and $100,000+ for women (441 | 39.2%).
| Income | Male | Female |
| $2,499 or less | 51 (3.4%) | 104 (9.2%) |
| $2,500 to $4,999 | 31 (2.1%) | 26 (2.3%) |
| $5,000 to $7,499 | 37 (2.5%) | 44 (3.9%) |
| $7,500 to $9,999 | 28 (1.9%) | 12 (1.1%) |
| $10,000 to $12,499 | 20 (1.3%) | 66 (5.9%) |
| $12,500 to $14,999 | 29 (1.9%) | 12 (1.1%) |
| $15,000 to $17,499 | 11 (0.7%) | 10 (0.9%) |
| $17,500 to $19,999 | 0 (0.0%) | 12 (1.1%) |
| $20,000 to $22,499 | 45 (3.0%) | 0 (0.0%) |
| $22,500 to $24,999 | 0 (0.0%) | 9 (0.8%) |
| $25,000 to $29,999 | 32 (2.1%) | 48 (4.3%) |
| $30,000 to $34,999 | 39 (2.6%) | 58 (5.1%) |
| $35,000 to $39,999 | 0 (0.0%) | 32 (2.8%) |
| $40,000 to $44,999 | 11 (0.7%) | 26 (2.3%) |
| $45,000 to $49,999 | 30 (2.0%) | 69 (6.1%) |
| $50,000 to $54,999 | 0 (0.0%) | 9 (0.8%) |
| $55,000 to $64,999 | 18 (1.2%) | 54 (4.8%) |
| $65,000 to $74,999 | 109 (7.3%) | 44 (3.9%) |
| $75,000 to $99,999 | 119 (8.0%) | 50 (4.4%) |
| $100,000+ | 875 (58.9%) | 441 (39.2%) |
| Total | 1,485 (100.0%) | 1,126 (100.0%) |
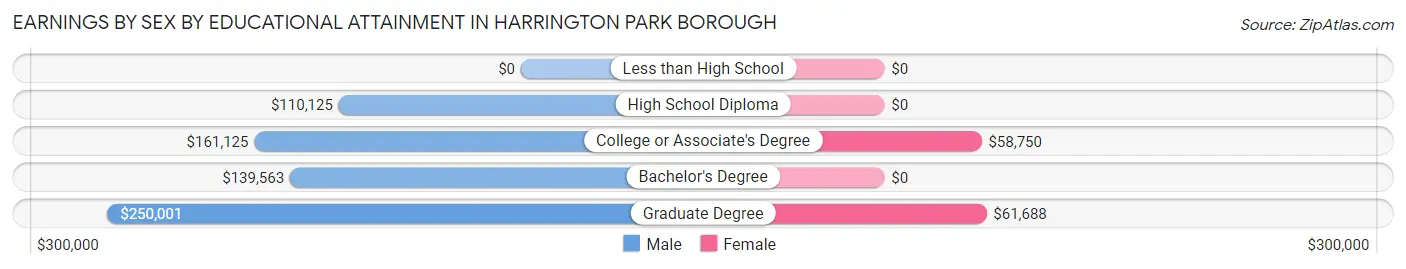
Earnings by Sex by Educational Attainment in Harrington Park borough
Average earnings in Harrington Park borough are $152,440 for men and $62,639 for women, a difference of 58.9%. Men with an educational attainment of graduate degree enjoy the highest average annual earnings of $250,001, while those with high school diploma education earn the least with $110,125. Women with an educational attainment of graduate degree earn the most with the average annual earnings of $61,688, while those with college or associate's degree education have the smallest earnings of $58,750.
| Educational Attainment | Male Income | Female Income |
| Less than High School | - | - |
| High School Diploma | $110,125 | $0 |
| College or Associate's Degree | $161,125 | $58,750 |
| Bachelor's Degree | $139,563 | $0 |
| Graduate Degree | $250,001 | $61,688 |
| Total | $152,440 | $62,639 |
Family Income in Harrington Park borough
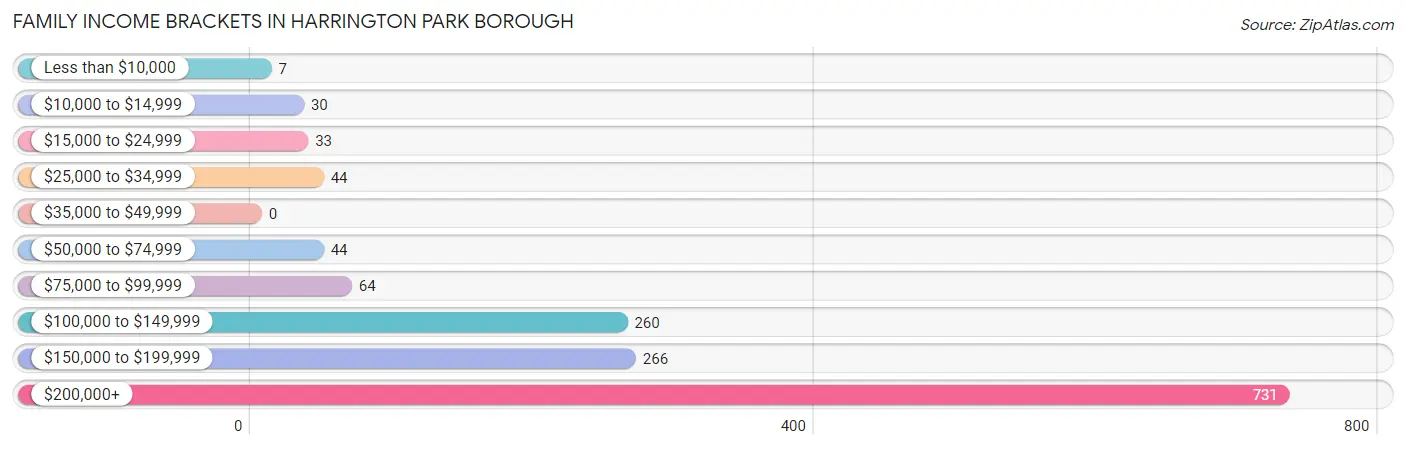
Family Income Brackets in Harrington Park borough
According to the Harrington Park borough family income data, there are 731 families falling into the $200,000+ income range, which is the most common income bracket and makes up 49.4% of all families.
| Income Bracket | # Families | % Families |
| Less than $10,000 | 7 | 0.5% |
| $10,000 to $14,999 | 30 | 2.0% |
| $15,000 to $24,999 | 33 | 2.2% |
| $25,000 to $34,999 | 44 | 3.0% |
| $35,000 to $49,999 | 0 | 0.0% |
| $50,000 to $74,999 | 44 | 3.0% |
| $75,000 to $99,999 | 64 | 4.3% |
| $100,000 to $149,999 | 260 | 17.6% |
| $150,000 to $199,999 | 266 | 18.0% |
| $200,000+ | 731 | 49.4% |
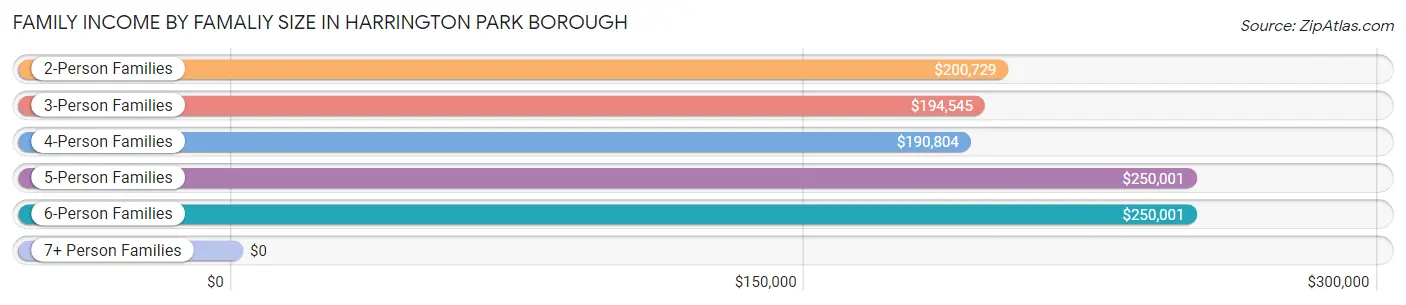
Family Income by Famaliy Size in Harrington Park borough
5-person families (110 | 7.4%) account for the highest median family income in Harrington Park borough with $250,001 per family, while 2-person families (681 | 46.0%) have the highest median income of $100,364 per family member.
| Income Bracket | # Families | Median Income |
| 2-Person Families | 681 (46.0%) | $200,729 |
| 3-Person Families | 336 (22.7%) | $194,545 |
| 4-Person Families | 319 (21.5%) | $190,804 |
| 5-Person Families | 110 (7.4%) | $250,001 |
| 6-Person Families | 34 (2.3%) | $250,001 |
| 7+ Person Families | 0 (0.0%) | $0 |
| Total | 1,480 (100.0%) | $195,250 |
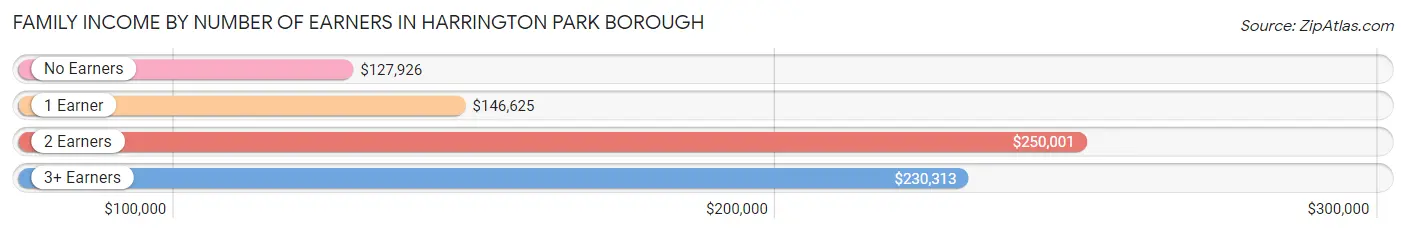
Family Income by Number of Earners in Harrington Park borough
The median family income in Harrington Park borough is $195,250, with families comprising 2 earners (718) having the highest median family income of $250,001, while families with no earners (192) have the lowest median family income of $127,926, accounting for 48.5% and 13.0% of families, respectively.
| Number of Earners | # Families | Median Income |
| No Earners | 192 (13.0%) | $127,926 |
| 1 Earner | 381 (25.7%) | $146,625 |
| 2 Earners | 718 (48.5%) | $250,001 |
| 3+ Earners | 189 (12.8%) | $230,313 |
| Total | 1,480 (100.0%) | $195,250 |
Household Income in Harrington Park borough
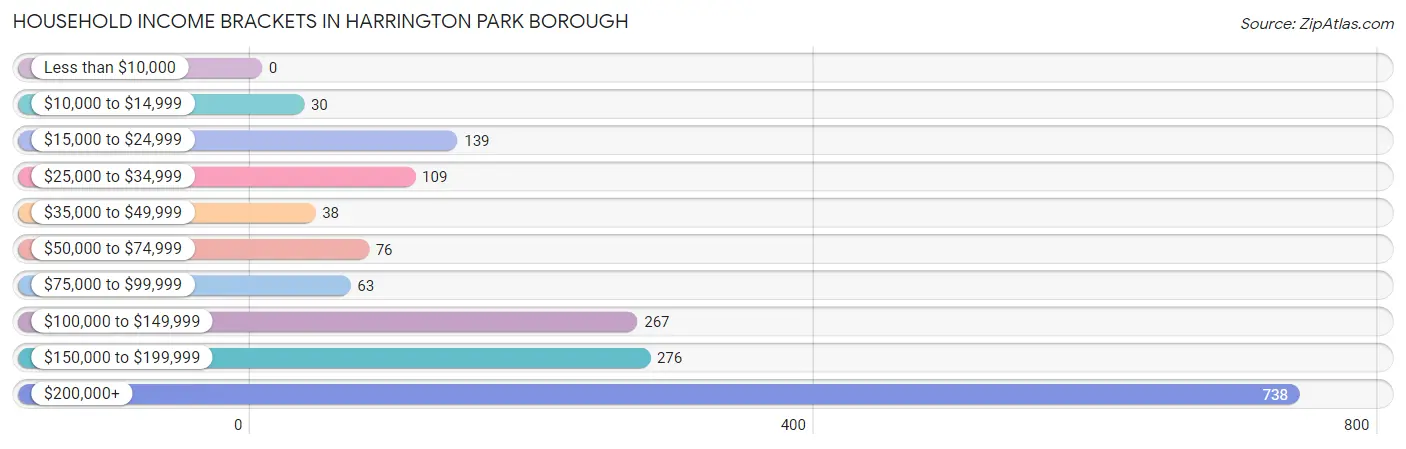
Household Income Brackets in Harrington Park borough
With 738 households falling in the category, the $200,000+ income range is the most frequent in Harrington Park borough, accounting for 42.5% of all households.
| Income Bracket | # Households | % Households |
| Less than $10,000 | 0 | 0.0% |
| $10,000 to $14,999 | 30 | 1.7% |
| $15,000 to $24,999 | 139 | 8.0% |
| $25,000 to $34,999 | 109 | 6.3% |
| $35,000 to $49,999 | 38 | 2.2% |
| $50,000 to $74,999 | 76 | 4.4% |
| $75,000 to $99,999 | 63 | 3.6% |
| $100,000 to $149,999 | 267 | 15.4% |
| $150,000 to $199,999 | 276 | 15.9% |
| $200,000+ | 738 | 42.5% |
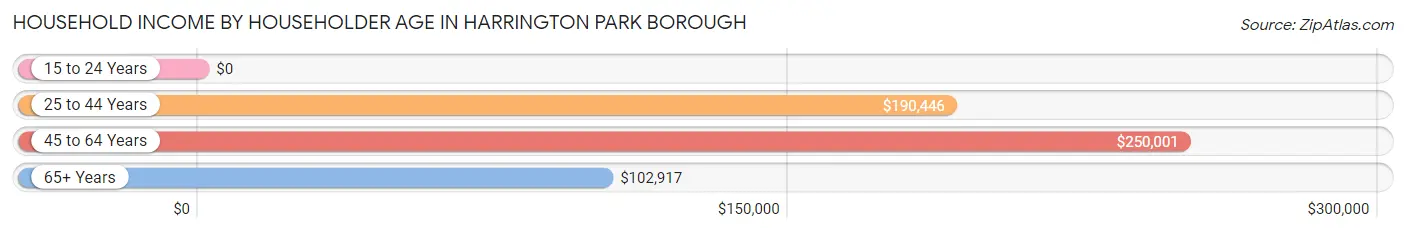
Household Income by Householder Age in Harrington Park borough
The median household income in Harrington Park borough is $183,138, with the highest median household income of $250,001 found in the 45 to 64 years age bracket for the primary householder. A total of 837 households (48.2%) fall into this category.
| Income Bracket | # Households | Median Income |
| 15 to 24 Years | 0 (0.0%) | $0 |
| 25 to 44 Years | 325 (18.7%) | $190,446 |
| 45 to 64 Years | 837 (48.2%) | $250,001 |
| 65+ Years | 575 (33.1%) | $102,917 |
| Total | 1,737 (100.0%) | $183,138 |
Poverty in Harrington Park borough
Income Below Poverty by Sex and Age in Harrington Park borough
With 5.4% poverty level for males and 5.9% for females among the residents of Harrington Park borough, 6 to 11 year old males and 6 to 11 year old females are the most vulnerable to poverty, with 30 males (17.6%) and 34 females (17.3%) in their respective age groups living below the poverty level.
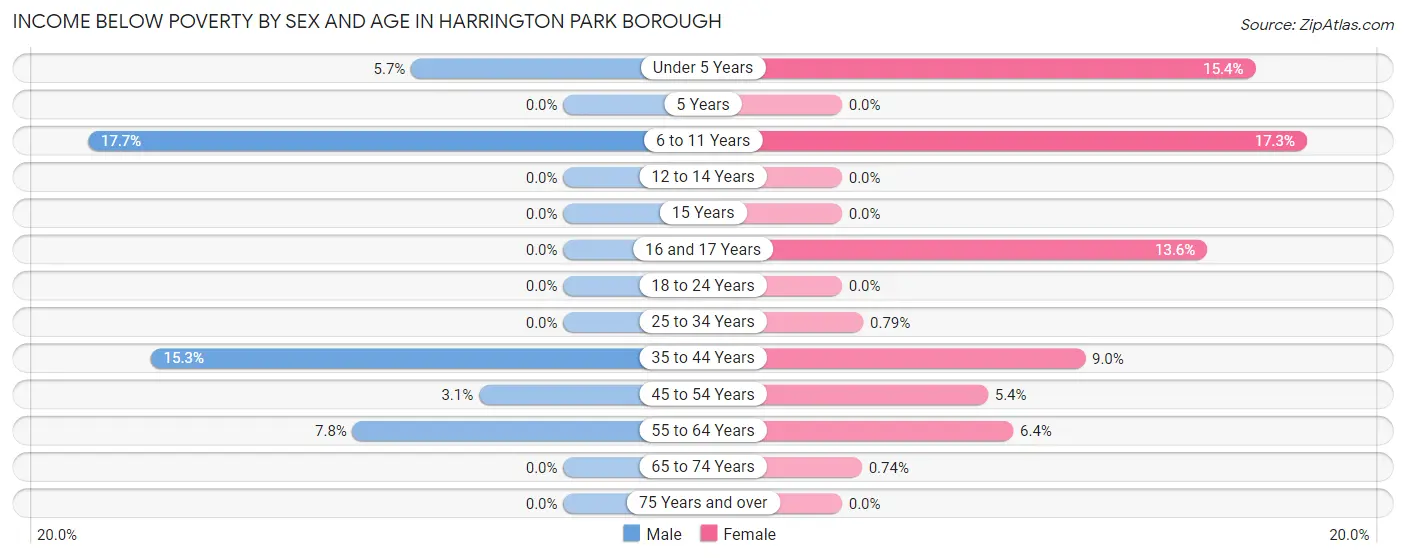
| Age Bracket | Male | Female |
| Under 5 Years | 7 (5.7%) | 31 (15.3%) |
| 5 Years | 0 (0.0%) | 0 (0.0%) |
| 6 to 11 Years | 30 (17.6%) | 34 (17.3%) |
| 12 to 14 Years | 0 (0.0%) | 0 (0.0%) |
| 15 Years | 0 (0.0%) | 0 (0.0%) |
| 16 and 17 Years | 0 (0.0%) | 8 (13.6%) |
| 18 to 24 Years | 0 (0.0%) | 0 (0.0%) |
| 25 to 34 Years | 0 (0.0%) | 1 (0.8%) |
| 35 to 44 Years | 38 (15.3%) | 25 (9.0%) |
| 45 to 54 Years | 10 (3.1%) | 26 (5.4%) |
| 55 to 64 Years | 41 (7.8%) | 21 (6.4%) |
| 65 to 74 Years | 0 (0.0%) | 1 (0.7%) |
| 75 Years and over | 0 (0.0%) | 0 (0.0%) |
| Total | 126 (5.4%) | 147 (5.9%) |
Income Above Poverty by Sex and Age in Harrington Park borough
According to the poverty statistics in Harrington Park borough, males aged 5 years and females aged 5 years are the age groups that are most secure financially, with 100.0% of males and 100.0% of females in these age groups living above the poverty line.
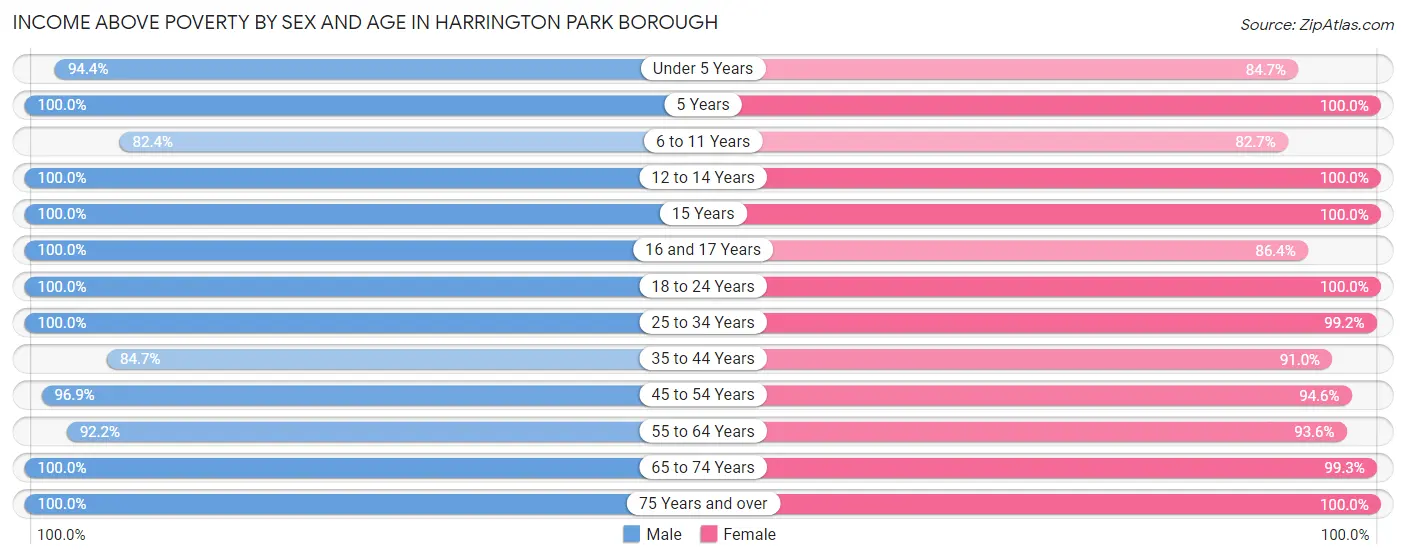
| Age Bracket | Male | Female |
| Under 5 Years | 117 (94.4%) | 171 (84.7%) |
| 5 Years | 30 (100.0%) | 31 (100.0%) |
| 6 to 11 Years | 140 (82.4%) | 163 (82.7%) |
| 12 to 14 Years | 44 (100.0%) | 158 (100.0%) |
| 15 Years | 33 (100.0%) | 31 (100.0%) |
| 16 and 17 Years | 107 (100.0%) | 51 (86.4%) |
| 18 to 24 Years | 201 (100.0%) | 95 (100.0%) |
| 25 to 34 Years | 109 (100.0%) | 126 (99.2%) |
| 35 to 44 Years | 210 (84.7%) | 252 (91.0%) |
| 45 to 54 Years | 309 (96.9%) | 454 (94.6%) |
| 55 to 64 Years | 483 (92.2%) | 309 (93.6%) |
| 65 to 74 Years | 162 (100.0%) | 134 (99.3%) |
| 75 Years and over | 259 (100.0%) | 374 (100.0%) |
| Total | 2,204 (94.6%) | 2,349 (94.1%) |
Income Below Poverty Among Married-Couple Families in Harrington Park borough
The poverty statistics for married-couple families in Harrington Park borough show that 4.6% or 63 of the total 1,378 families live below the poverty line. Families with 3 or 4 children have the highest poverty rate of 20.9%, comprising of 23 families. On the other hand, families with no children have the lowest poverty rate of 2.4%, which includes 20 families.
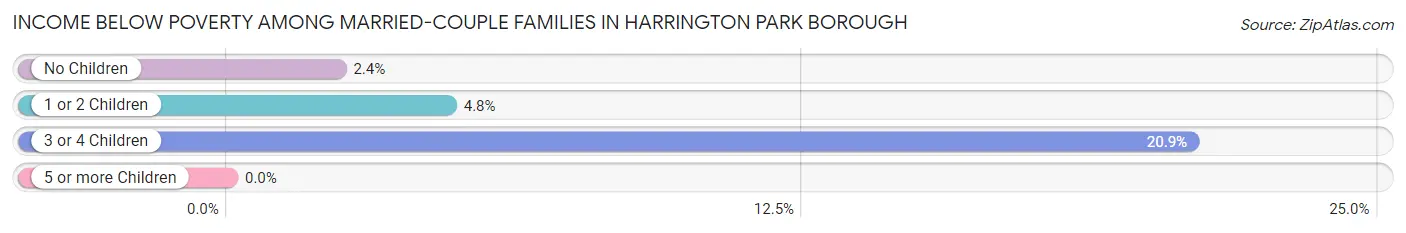
| Children | Above Poverty | Below Poverty |
| No Children | 828 (97.6%) | 20 (2.4%) |
| 1 or 2 Children | 400 (95.2%) | 20 (4.8%) |
| 3 or 4 Children | 87 (79.1%) | 23 (20.9%) |
| 5 or more Children | 0 (0.0%) | 0 (0.0%) |
| Total | 1,315 (95.4%) | 63 (4.6%) |
Income Below Poverty Among Single-Parent Households in Harrington Park borough
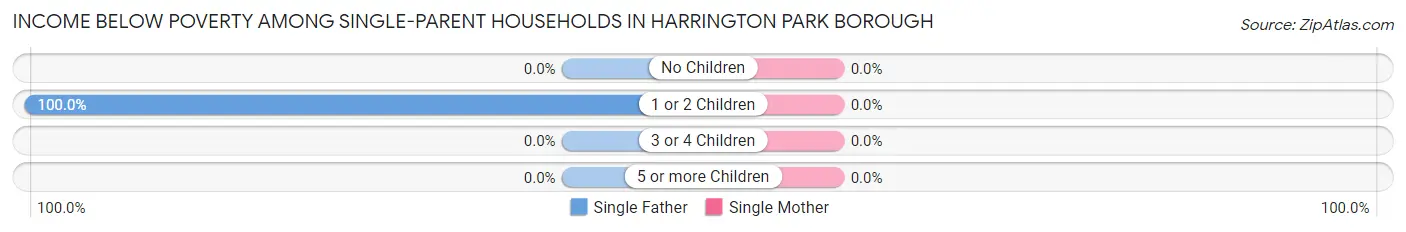
| Children | Single Father | Single Mother |
| No Children | 0 (0.0%) | 0 (0.0%) |
| 1 or 2 Children | 7 (100.0%) | 0 (0.0%) |
| 3 or 4 Children | 0 (0.0%) | 0 (0.0%) |
| 5 or more Children | 0 (0.0%) | 0 (0.0%) |
| Total | 7 (35.0%) | 0 (0.0%) |
Income Below Poverty Among Married-Couple vs Single-Parent Households in Harrington Park borough
The poverty data for Harrington Park borough shows that 63 of the married-couple family households (4.6%) and 7 of the single-parent households (6.9%) are living below the poverty level. Within the married-couple family households, those with 3 or 4 children have the highest poverty rate, with 23 households (20.9%) falling below the poverty line. Among the single-parent households, those with 1 or 2 children have the highest poverty rate, with 7 household (12.1%) living below poverty.
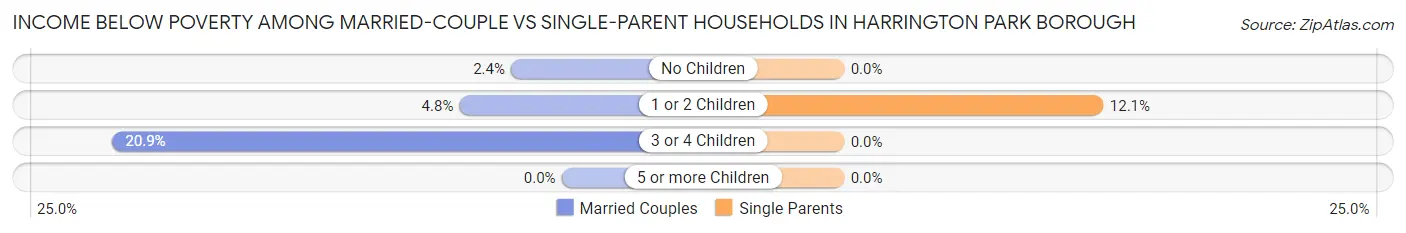
| Children | Married-Couple Families | Single-Parent Households |
| No Children | 20 (2.4%) | 0 (0.0%) |
| 1 or 2 Children | 20 (4.8%) | 7 (12.1%) |
| 3 or 4 Children | 23 (20.9%) | 0 (0.0%) |
| 5 or more Children | 0 (0.0%) | 0 (0.0%) |
| Total | 63 (4.6%) | 7 (6.9%) |
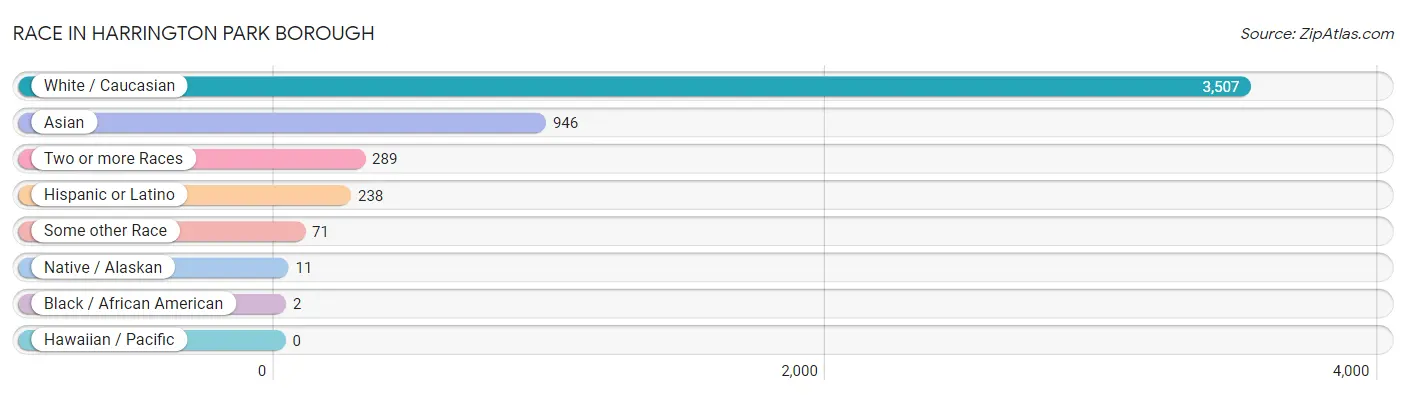
Race in Harrington Park borough
The most populous races in Harrington Park borough are White / Caucasian (3,507 | 72.7%), Asian (946 | 19.6%), and Two or more Races (289 | 6.0%).
| Race | # Population | % Population |
| Asian | 946 | 19.6% |
| Black / African American | 2 | 0.0% |
| Hawaiian / Pacific | 0 | 0.0% |
| Hispanic or Latino | 238 | 4.9% |
| Native / Alaskan | 11 | 0.2% |
| White / Caucasian | 3,507 | 72.7% |
| Two or more Races | 289 | 6.0% |
| Some other Race | 71 | 1.5% |
| Total | 4,826 | 100.0% |
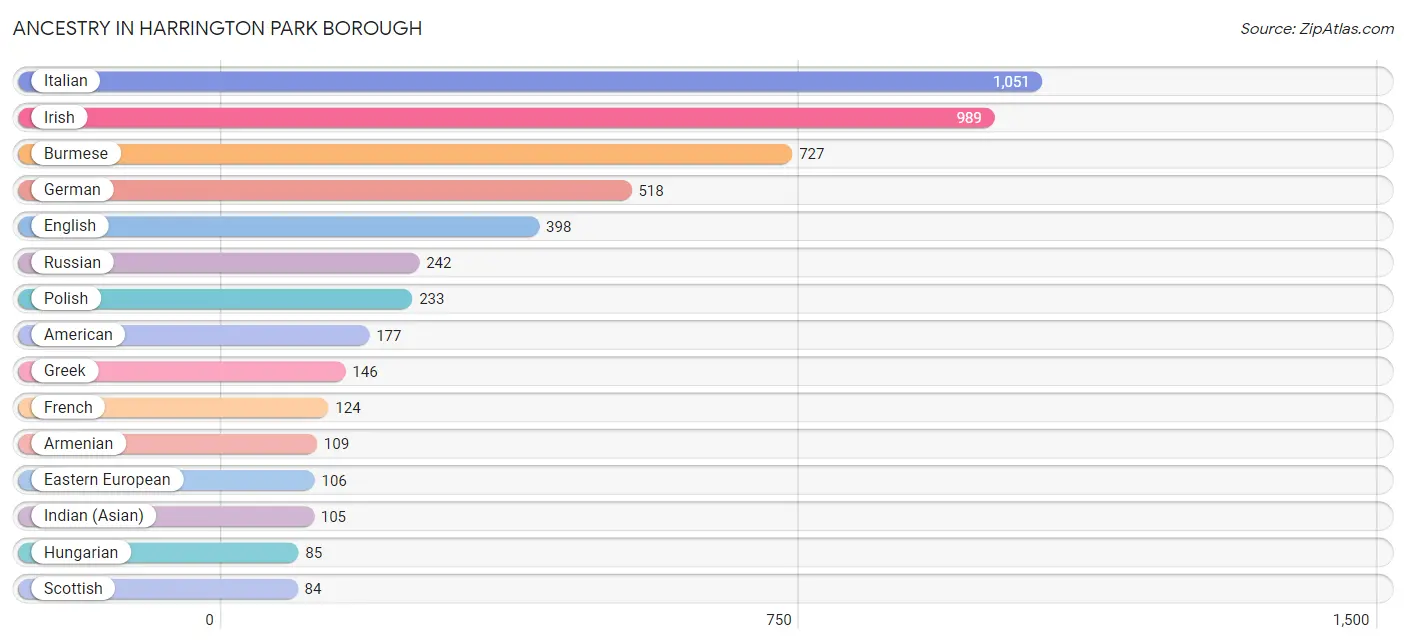
Ancestry in Harrington Park borough
The most populous ancestries reported in Harrington Park borough are Italian (1,051 | 21.8%), Irish (989 | 20.5%), Burmese (727 | 15.1%), German (518 | 10.7%), and English (398 | 8.3%), together accounting for 76.3% of all Harrington Park borough residents.
| Ancestry | # Population | % Population |
| American | 177 | 3.7% |
| Arab | 32 | 0.7% |
| Armenian | 109 | 2.3% |
| Austrian | 37 | 0.8% |
| British | 10 | 0.2% |
| Burmese | 727 | 15.1% |
| Canadian | 10 | 0.2% |
| Croatian | 49 | 1.0% |
| Cuban | 46 | 0.9% |
| Dominican | 15 | 0.3% |
| Dutch | 60 | 1.2% |
| Eastern European | 106 | 2.2% |
| Ecuadorian | 28 | 0.6% |
| English | 398 | 8.3% |
| European | 41 | 0.9% |
| French | 124 | 2.6% |
| French Canadian | 21 | 0.4% |
| German | 518 | 10.7% |
| Greek | 146 | 3.0% |
| Hungarian | 85 | 1.8% |
| Icelander | 20 | 0.4% |
| Indian (Asian) | 105 | 2.2% |
| Iraqi | 11 | 0.2% |
| Irish | 989 | 20.5% |
| Israeli | 53 | 1.1% |
| Italian | 1,051 | 21.8% |
| Jamaican | 24 | 0.5% |
| Korean | 72 | 1.5% |
| Lebanese | 21 | 0.4% |
| Mexican | 25 | 0.5% |
| Norwegian | 34 | 0.7% |
| Polish | 233 | 4.8% |
| Puerto Rican | 79 | 1.6% |
| Romanian | 27 | 0.6% |
| Russian | 242 | 5.0% |
| Scotch-Irish | 32 | 0.7% |
| Scottish | 84 | 1.7% |
| Slavic | 1 | 0.0% |
| Slovene | 8 | 0.2% |
| South American | 28 | 0.6% |
| South American Indian | 28 | 0.6% |
| Spaniard | 14 | 0.3% |
| Spanish | 31 | 0.6% |
| Swedish | 21 | 0.4% |
| Swiss | 59 | 1.2% |
| Thai | 41 | 0.9% |
| Turkish | 8 | 0.2% |
| Ukrainian | 19 | 0.4% |
| Welsh | 48 | 1.0% | View All 49 Rows |
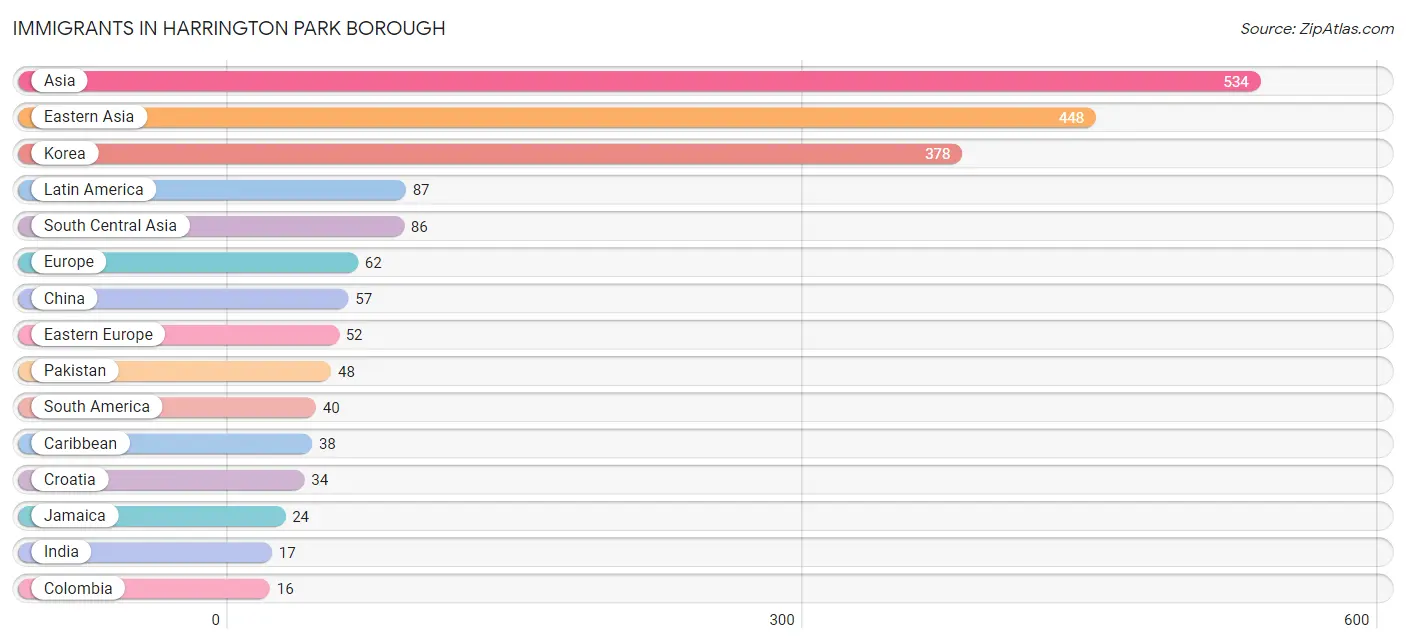
Immigrants in Harrington Park borough
The most numerous immigrant groups reported in Harrington Park borough came from Asia (534 | 11.1%), Eastern Asia (448 | 9.3%), Korea (378 | 7.8%), Latin America (87 | 1.8%), and South Central Asia (86 | 1.8%), together accounting for 31.8% of all Harrington Park borough residents.
| Immigration Origin | # Population | % Population |
| Asia | 534 | 11.1% |
| Brazil | 8 | 0.2% |
| Canada | 10 | 0.2% |
| Caribbean | 38 | 0.8% |
| Central America | 9 | 0.2% |
| China | 57 | 1.2% |
| Colombia | 16 | 0.3% |
| Croatia | 34 | 0.7% |
| Eastern Asia | 448 | 9.3% |
| Eastern Europe | 52 | 1.1% |
| Europe | 62 | 1.3% |
| India | 17 | 0.4% |
| Iran | 8 | 0.2% |
| Italy | 10 | 0.2% |
| Jamaica | 24 | 0.5% |
| Japan | 13 | 0.3% |
| Korea | 378 | 7.8% |
| Latin America | 87 | 1.8% |
| Mexico | 9 | 0.2% |
| Pakistan | 48 | 1.0% |
| Peru | 10 | 0.2% |
| Poland | 10 | 0.2% |
| South America | 40 | 0.8% |
| South Central Asia | 86 | 1.8% |
| Southern Europe | 10 | 0.2% |
| Sri Lanka | 13 | 0.3% |
| Taiwan | 12 | 0.3% |
| Trinidad and Tobago | 14 | 0.3% |
| Venezuela | 6 | 0.1% | View All 29 Rows |
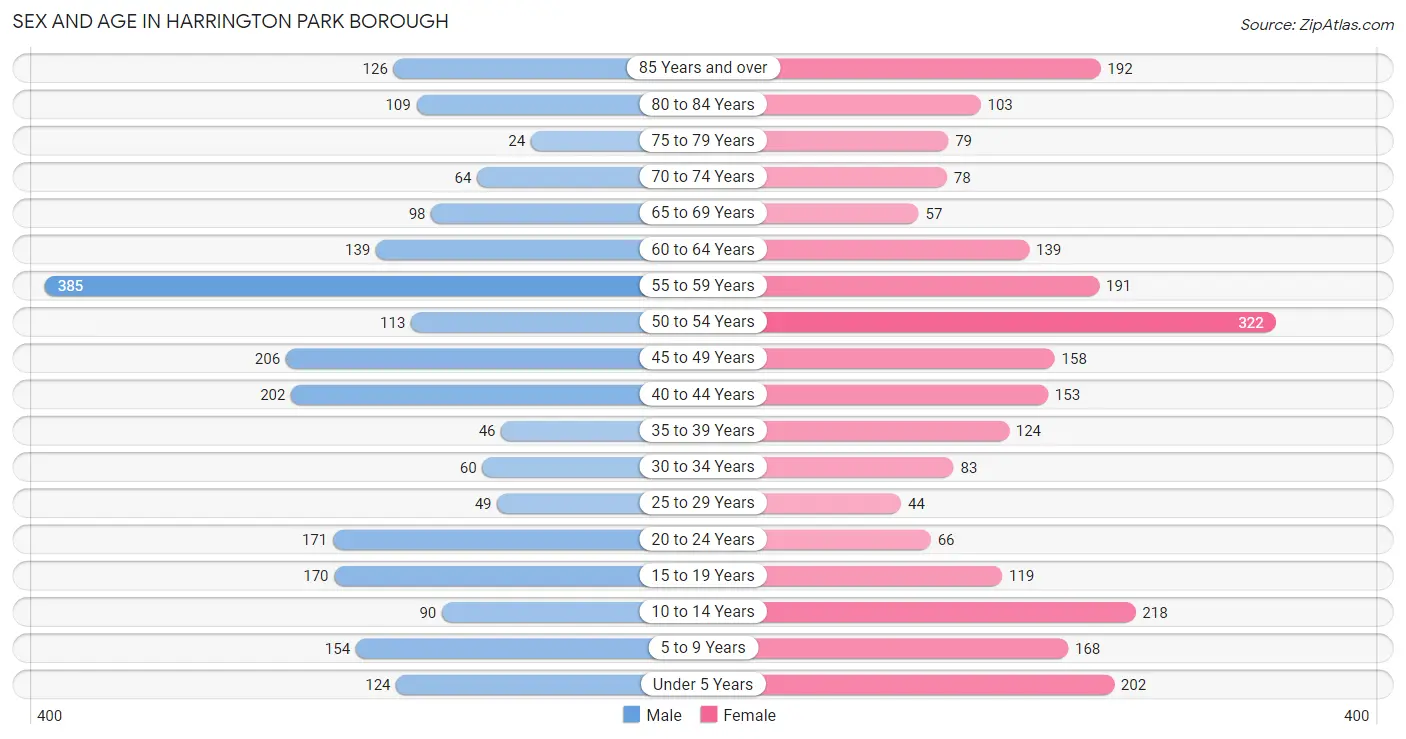
Sex and Age in Harrington Park borough
Sex and Age in Harrington Park borough
The most populous age groups in Harrington Park borough are 55 to 59 Years (385 | 16.5%) for men and 50 to 54 Years (322 | 12.9%) for women.
| Age Bracket | Male | Female |
| Under 5 Years | 124 (5.3%) | 202 (8.1%) |
| 5 to 9 Years | 154 (6.6%) | 168 (6.7%) |
| 10 to 14 Years | 90 (3.9%) | 218 (8.7%) |
| 15 to 19 Years | 170 (7.3%) | 119 (4.8%) |
| 20 to 24 Years | 171 (7.3%) | 66 (2.6%) |
| 25 to 29 Years | 49 (2.1%) | 44 (1.8%) |
| 30 to 34 Years | 60 (2.6%) | 83 (3.3%) |
| 35 to 39 Years | 46 (2.0%) | 124 (5.0%) |
| 40 to 44 Years | 202 (8.7%) | 153 (6.1%) |
| 45 to 49 Years | 206 (8.8%) | 158 (6.3%) |
| 50 to 54 Years | 113 (4.9%) | 322 (12.9%) |
| 55 to 59 Years | 385 (16.5%) | 191 (7.6%) |
| 60 to 64 Years | 139 (6.0%) | 139 (5.6%) |
| 65 to 69 Years | 98 (4.2%) | 57 (2.3%) |
| 70 to 74 Years | 64 (2.8%) | 78 (3.1%) |
| 75 to 79 Years | 24 (1.0%) | 79 (3.2%) |
| 80 to 84 Years | 109 (4.7%) | 103 (4.1%) |
| 85 Years and over | 126 (5.4%) | 192 (7.7%) |
| Total | 2,330 (100.0%) | 2,496 (100.0%) |
Families and Households in Harrington Park borough
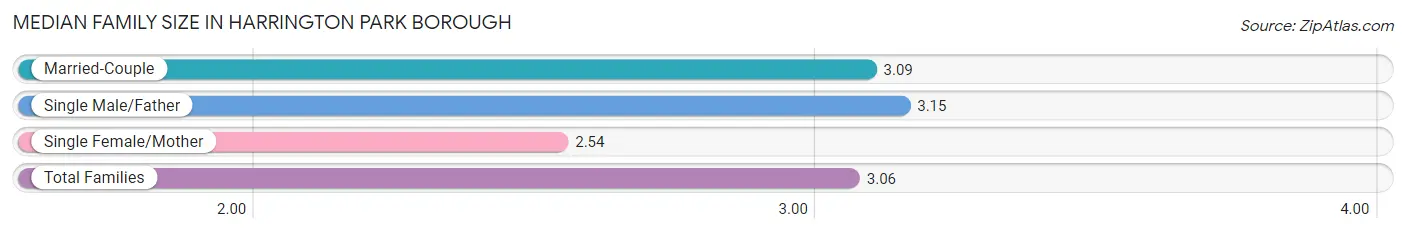
Median Family Size in Harrington Park borough
The median family size in Harrington Park borough is 3.06 persons per family, with single male/father families (20 | 1.3%) accounting for the largest median family size of 3.15 persons per family. On the other hand, single female/mother families (82 | 5.5%) represent the smallest median family size with 2.54 persons per family.
| Family Type | # Families | Family Size |
| Married-Couple | 1,378 (93.1%) | 3.09 |
| Single Male/Father | 20 (1.3%) | 3.15 |
| Single Female/Mother | 82 (5.5%) | 2.54 |
| Total Families | 1,480 (100.0%) | 3.06 |
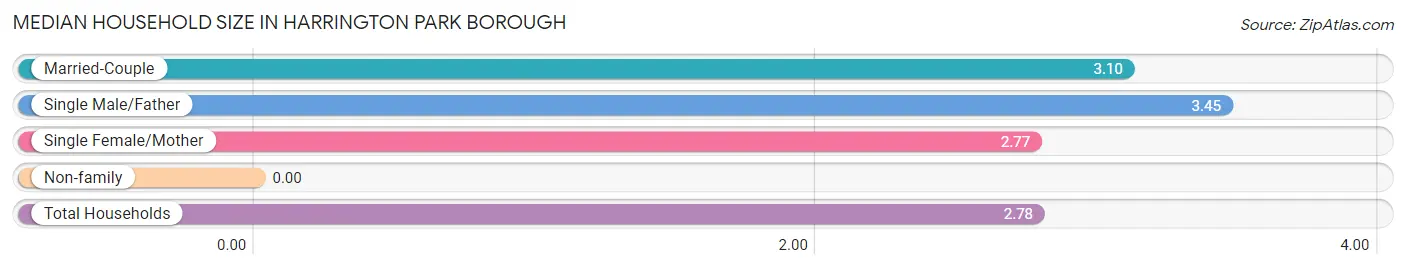
Median Household Size in Harrington Park borough
| Household Type | # Households | Household Size |
| Married-Couple | 1,378 (79.3%) | 3.10 |
| Single Male/Father | 20 (1.1%) | 3.45 |
| Single Female/Mother | 82 (4.7%) | 2.77 |
| Non-family | 257 (14.8%) | - |
| Total Households | 1,737 (100.0%) | 2.78 |
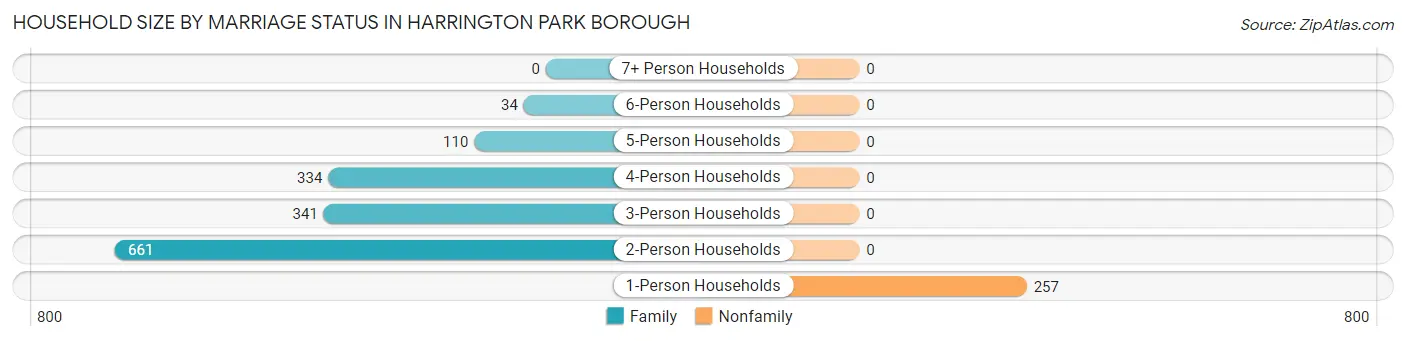
Household Size by Marriage Status in Harrington Park borough
Out of a total of 1,737 households in Harrington Park borough, 1,480 (85.2%) are family households, while 257 (14.8%) are nonfamily households. The most numerous type of family households are 2-person households, comprising 661, and the most common type of nonfamily households are 1-person households, comprising 257.
| Household Size | Family Households | Nonfamily Households |
| 1-Person Households | - | 257 (14.8%) |
| 2-Person Households | 661 (38.1%) | 0 (0.0%) |
| 3-Person Households | 341 (19.6%) | 0 (0.0%) |
| 4-Person Households | 334 (19.2%) | 0 (0.0%) |
| 5-Person Households | 110 (6.3%) | 0 (0.0%) |
| 6-Person Households | 34 (2.0%) | 0 (0.0%) |
| 7+ Person Households | 0 (0.0%) | 0 (0.0%) |
| Total | 1,480 (85.2%) | 257 (14.8%) |
Female Fertility in Harrington Park borough
Fertility by Age in Harrington Park borough
Average fertility rate in Harrington Park borough is 52.0 births per 1,000 women. Women in the age bracket of 20 to 34 years have the highest fertility rate with 233.0 births per 1,000 women. Women in the age bracket of 20 to 34 years acount for 100.0% of all women with births.
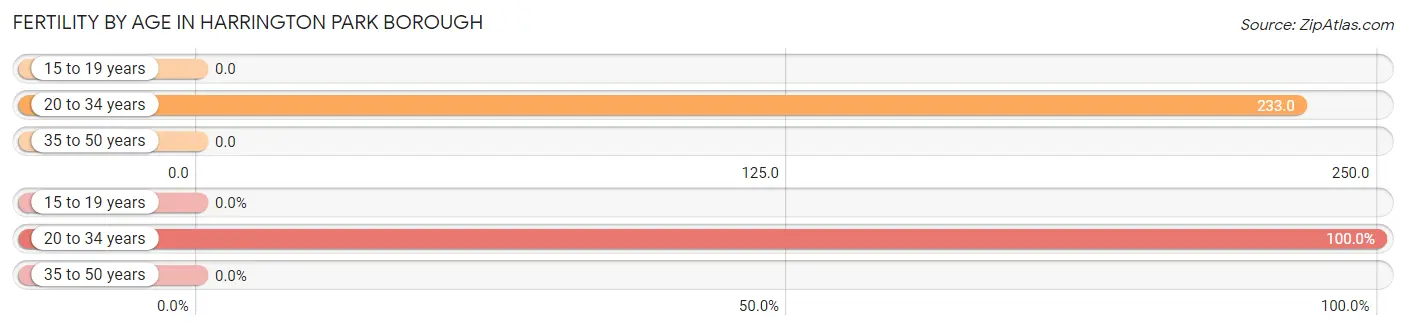
| Age Bracket | Women with Births | Births / 1,000 Women |
| 15 to 19 years | 0 (0.0%) | 0.0 |
| 20 to 34 years | 45 (100.0%) | 233.0 |
| 35 to 50 years | 0 (0.0%) | 0.0 |
| Total | 45 (100.0%) | 52.0 |
Fertility by Age by Marriage Status in Harrington Park borough
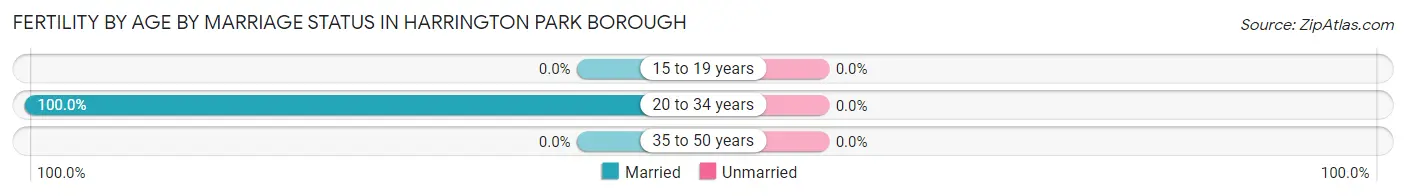
| Age Bracket | Married | Unmarried |
| 15 to 19 years | 0 (0.0%) | 0 (0.0%) |
| 20 to 34 years | 45 (100.0%) | 0 (0.0%) |
| 35 to 50 years | 0 (0.0%) | 0 (0.0%) |
| Total | 45 (100.0%) | 0 (0.0%) |
Fertility by Education in Harrington Park borough
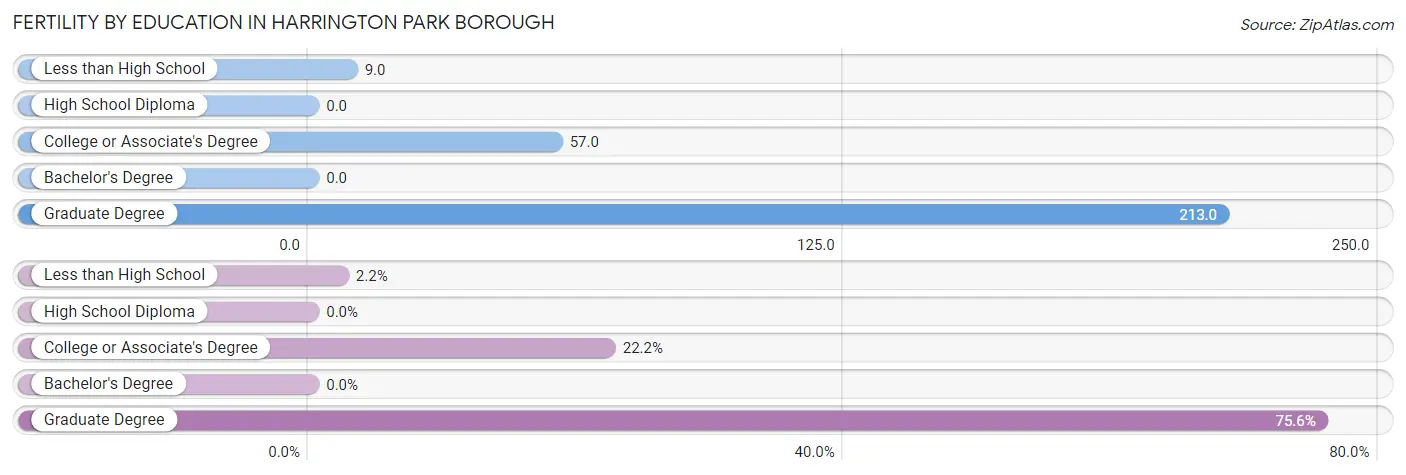
| Educational Attainment | Women with Births | Births / 1,000 Women |
| Less than High School | 1 (2.2%) | 9.0 |
| High School Diploma | 0 (0.0%) | 0.0 |
| College or Associate's Degree | 10 (22.2%) | 57.0 |
| Bachelor's Degree | 0 (0.0%) | 0.0 |
| Graduate Degree | 34 (75.6%) | 213.0 |
| Total | 45 (100.0%) | 52.0 |
Fertility by Education by Marriage Status in Harrington Park borough
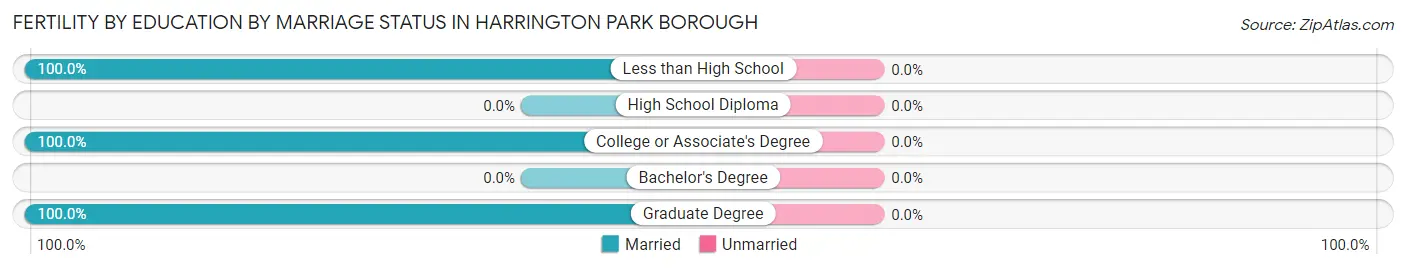
| Educational Attainment | Married | Unmarried |
| Less than High School | 1 (100.0%) | 0 (0.0%) |
| High School Diploma | 0 (0.0%) | 0 (0.0%) |
| College or Associate's Degree | 10 (100.0%) | 0 (0.0%) |
| Bachelor's Degree | 0 (0.0%) | 0 (0.0%) |
| Graduate Degree | 34 (100.0%) | 0 (0.0%) |
| Total | 45 (100.0%) | 0 (0.0%) |
Employment Characteristics in Harrington Park borough
Employment by Class of Employer in Harrington Park borough
Among the 2,332 employed individuals in Harrington Park borough, private company employees (1,571 | 67.4%), self-employed (incorporated) (237 | 10.2%), and local government employees (187 | 8.0%) make up the most common classes of employment.
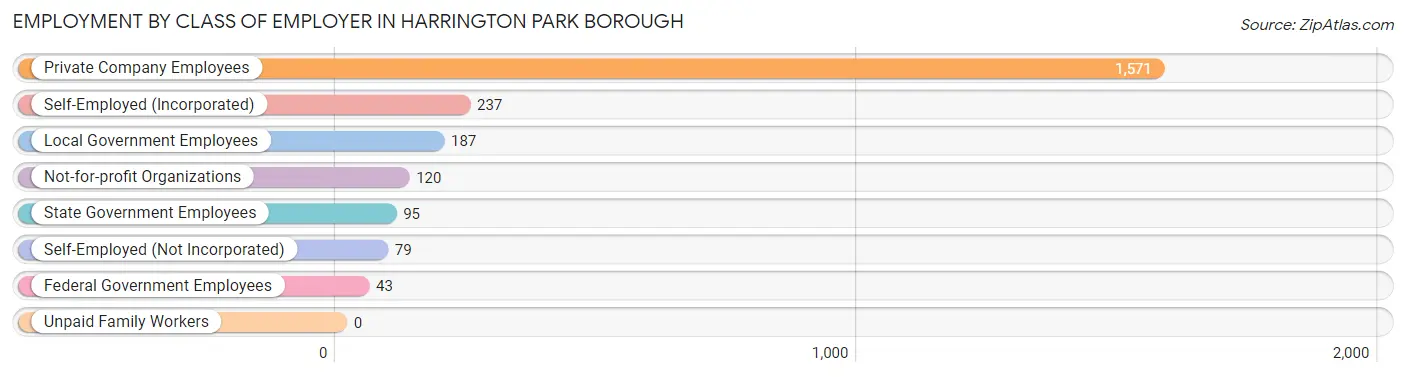
| Employer Class | # Employees | % Employees |
| Private Company Employees | 1,571 | 67.4% |
| Self-Employed (Incorporated) | 237 | 10.2% |
| Self-Employed (Not Incorporated) | 79 | 3.4% |
| Not-for-profit Organizations | 120 | 5.1% |
| Local Government Employees | 187 | 8.0% |
| State Government Employees | 95 | 4.1% |
| Federal Government Employees | 43 | 1.8% |
| Unpaid Family Workers | 0 | 0.0% |
| Total | 2,332 | 100.0% |
Employment Status by Age in Harrington Park borough
According to the labor force statistics for Harrington Park borough, out of the total population over 16 years of age (3,806), 63.5% or 2,417 individuals are in the labor force, with 2.6% or 63 of them unemployed. The age group with the highest labor force participation rate is 30 to 34 years, with 94.4% or 135 individuals in the labor force. Within the labor force, the 16 to 19 years age range has the highest percentage of unemployed individuals, with 20.5% or 8 of them being unemployed.
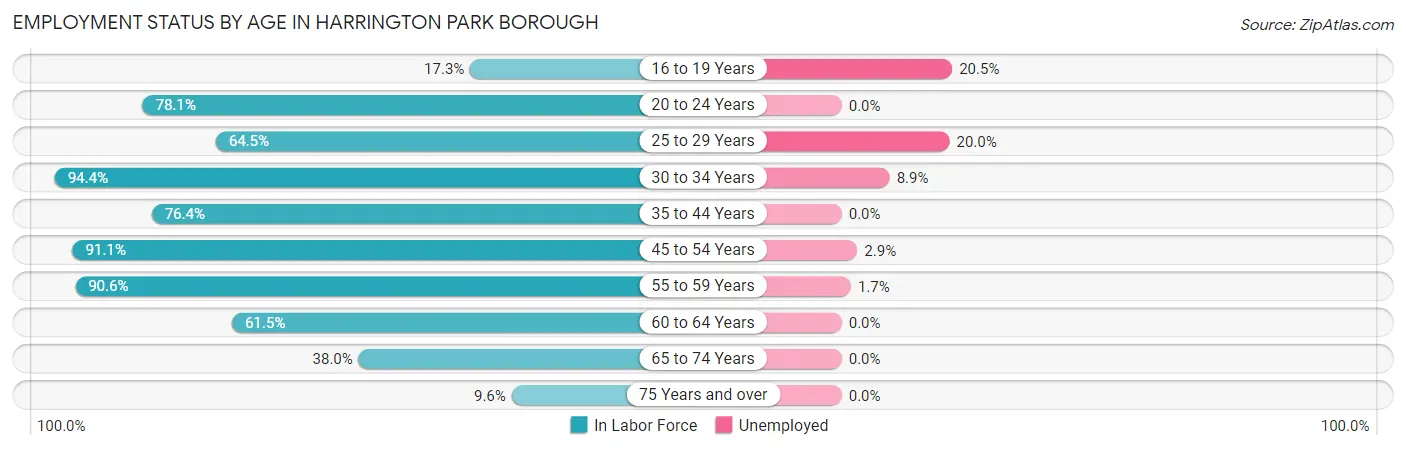
| Age Bracket | In Labor Force | Unemployed |
| 16 to 19 Years | 39 (17.3%) | 8 (20.5%) |
| 20 to 24 Years | 185 (78.1%) | 0 (0.0%) |
| 25 to 29 Years | 60 (64.5%) | 12 (20.0%) |
| 30 to 34 Years | 135 (94.4%) | 12 (8.9%) |
| 35 to 44 Years | 401 (76.4%) | 0 (0.0%) |
| 45 to 54 Years | 728 (91.1%) | 21 (2.9%) |
| 55 to 59 Years | 522 (90.6%) | 9 (1.7%) |
| 60 to 64 Years | 171 (61.5%) | 0 (0.0%) |
| 65 to 74 Years | 113 (38.0%) | 0 (0.0%) |
| 75 Years and over | 61 (9.6%) | 0 (0.0%) |
| Total | 2,417 (63.5%) | 63 (2.6%) |
Employment Status by Educational Attainment in Harrington Park borough
According to labor force statistics for Harrington Park borough, 83.6% of individuals (2,018) out of the total population between 25 and 64 years of age (2,414) are in the labor force, with 2.7% or 54 of them being unemployed. The group with the highest labor force participation rate are those with the educational attainment of bachelor's degree or higher, with 85.4% or 1,563 individuals in the labor force. Within the labor force, individuals with college / associate degree education have the highest percentage of unemployment, with 2.9% or 10 of them being unemployed.
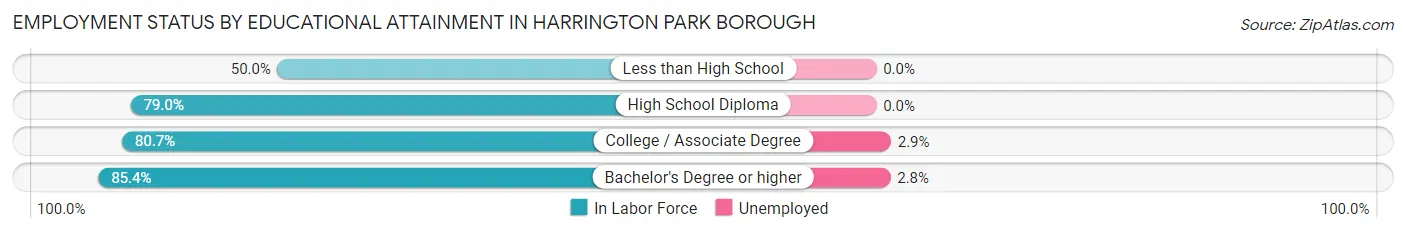
| Educational Attainment | In Labor Force | Unemployed |
| Less than High School | 24 (50.0%) | 0 (0.0%) |
| High School Diploma | 83 (79.0%) | 0 (0.0%) |
| College / Associate Degree | 348 (80.7%) | 12 (2.9%) |
| Bachelor's Degree or higher | 1,563 (85.4%) | 51 (2.8%) |
| Total | 2,018 (83.6%) | 65 (2.7%) |
Employment Occupations by Sex in Harrington Park borough
Management, Business, Science and Arts Occupations
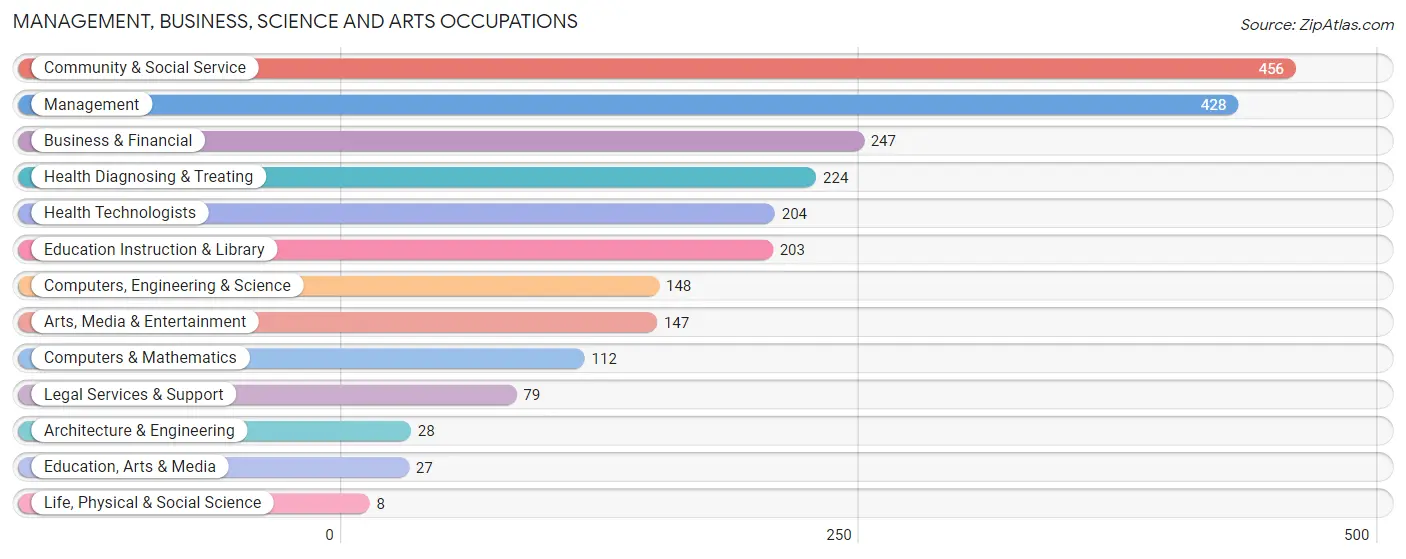
The most common Management, Business, Science and Arts occupations in Harrington Park borough are Community & Social Service (456 | 19.4%), Management (428 | 18.2%), Business & Financial (247 | 10.5%), Health Diagnosing & Treating (224 | 9.5%), and Health Technologists (204 | 8.7%).
Management, Business, Science and Arts Occupations by Sex
Within the Management, Business, Science and Arts occupations in Harrington Park borough, the most male-oriented occupations are Architecture & Engineering (100.0%), Life, Physical & Social Science (100.0%), and Computers, Engineering & Science (92.6%), while the most female-oriented occupations are Education, Arts & Media (96.3%), Education Instruction & Library (89.7%), and Community & Social Service (67.3%).
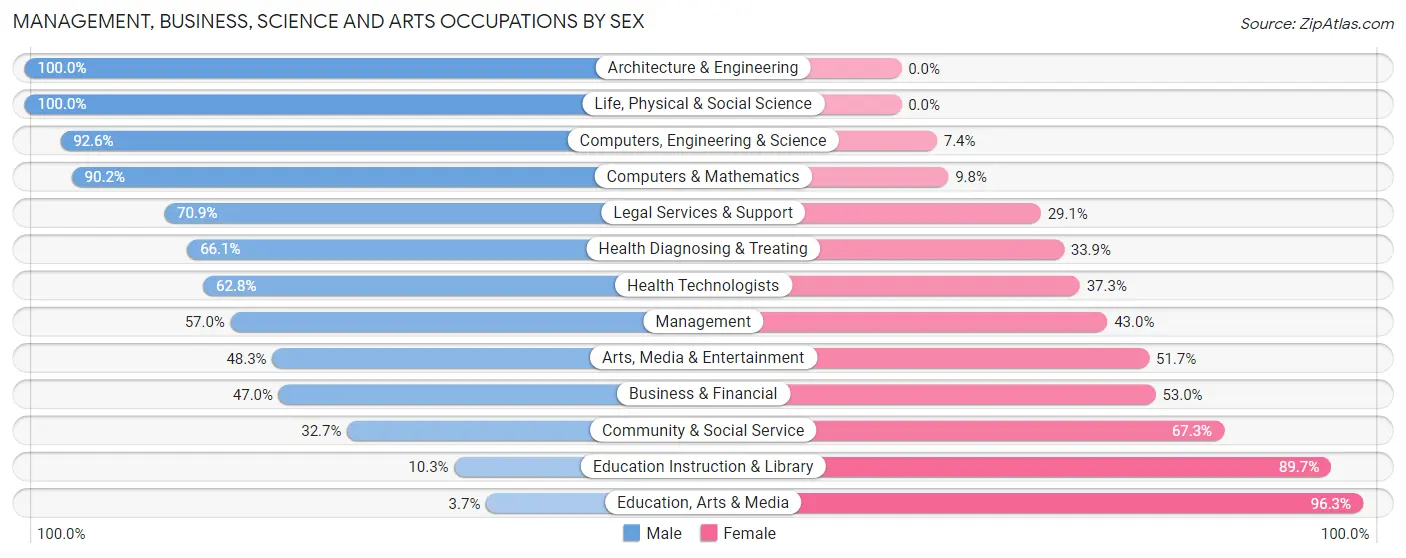
| Occupation | Male | Female |
| Management | 244 (57.0%) | 184 (43.0%) |
| Business & Financial | 116 (47.0%) | 131 (53.0%) |
| Computers, Engineering & Science | 137 (92.6%) | 11 (7.4%) |
| Computers & Mathematics | 101 (90.2%) | 11 (9.8%) |
| Architecture & Engineering | 28 (100.0%) | 0 (0.0%) |
| Life, Physical & Social Science | 8 (100.0%) | 0 (0.0%) |
| Community & Social Service | 149 (32.7%) | 307 (67.3%) |
| Education, Arts & Media | 1 (3.7%) | 26 (96.3%) |
| Legal Services & Support | 56 (70.9%) | 23 (29.1%) |
| Education Instruction & Library | 21 (10.3%) | 182 (89.7%) |
| Arts, Media & Entertainment | 71 (48.3%) | 76 (51.7%) |
| Health Diagnosing & Treating | 148 (66.1%) | 76 (33.9%) |
| Health Technologists | 128 (62.7%) | 76 (37.2%) |
| Total (Category) | 794 (52.8%) | 709 (47.2%) |
| Total (Overall) | 1,359 (57.8%) | 994 (42.2%) |
Services Occupations
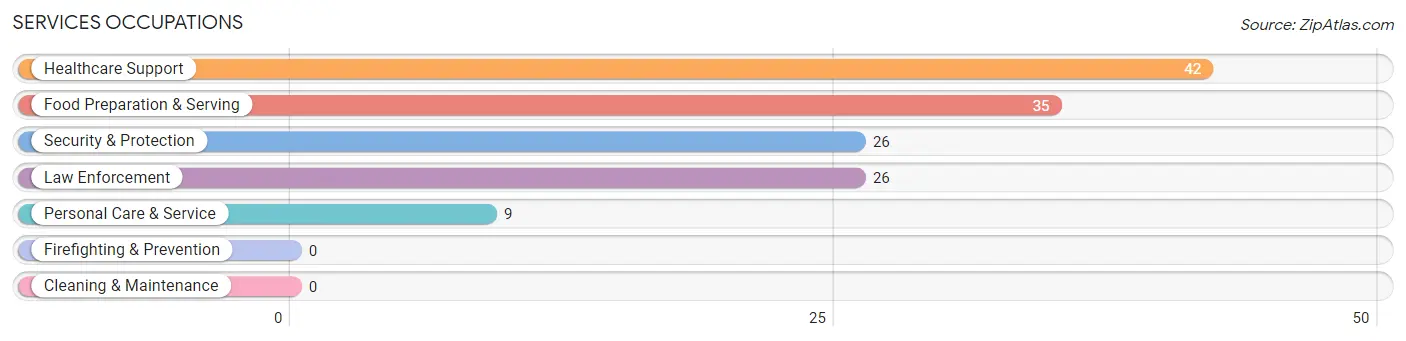
The most common Services occupations in Harrington Park borough are Healthcare Support (42 | 1.8%), Food Preparation & Serving (35 | 1.5%), Security & Protection (26 | 1.1%), Law Enforcement (26 | 1.1%), and Personal Care & Service (9 | 0.4%).
Services Occupations by Sex
Within the Services occupations in Harrington Park borough, the most male-oriented occupations are Security & Protection (100.0%), Law Enforcement (100.0%), and Food Preparation & Serving (74.3%), while the most female-oriented occupations are Healthcare Support (100.0%), Personal Care & Service (100.0%), and Food Preparation & Serving (25.7%).
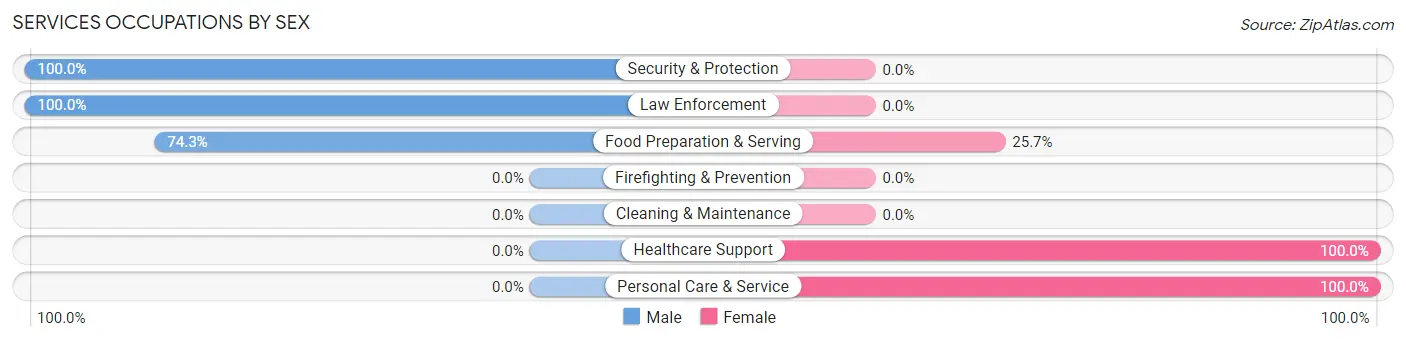
| Occupation | Male | Female |
| Healthcare Support | 0 (0.0%) | 42 (100.0%) |
| Security & Protection | 26 (100.0%) | 0 (0.0%) |
| Firefighting & Prevention | 0 (0.0%) | 0 (0.0%) |
| Law Enforcement | 26 (100.0%) | 0 (0.0%) |
| Food Preparation & Serving | 26 (74.3%) | 9 (25.7%) |
| Cleaning & Maintenance | 0 (0.0%) | 0 (0.0%) |
| Personal Care & Service | 0 (0.0%) | 9 (100.0%) |
| Total (Category) | 52 (46.4%) | 60 (53.6%) |
| Total (Overall) | 1,359 (57.8%) | 994 (42.2%) |
Sales and Office Occupations
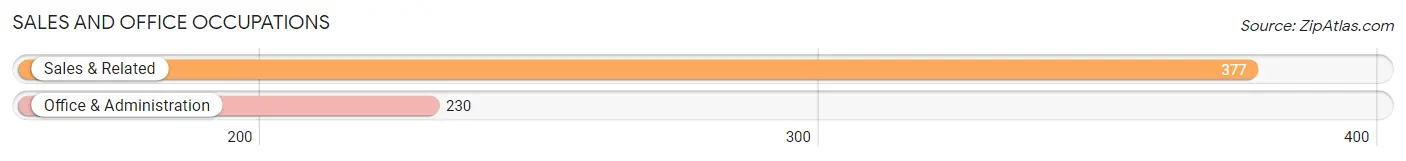
The most common Sales and Office occupations in Harrington Park borough are Sales & Related (377 | 16.0%), and Office & Administration (230 | 9.8%).
Sales and Office Occupations by Sex
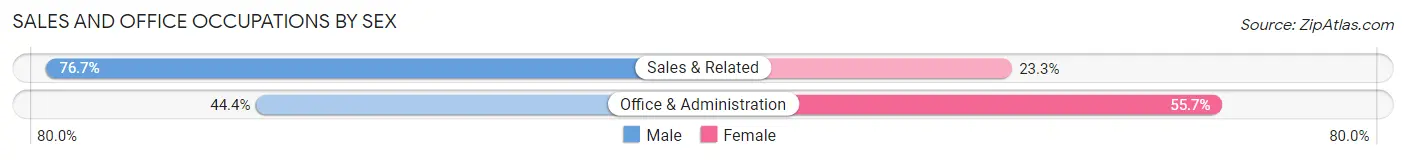
| Occupation | Male | Female |
| Sales & Related | 289 (76.7%) | 88 (23.3%) |
| Office & Administration | 102 (44.4%) | 128 (55.6%) |
| Total (Category) | 391 (64.4%) | 216 (35.6%) |
| Total (Overall) | 1,359 (57.8%) | 994 (42.2%) |
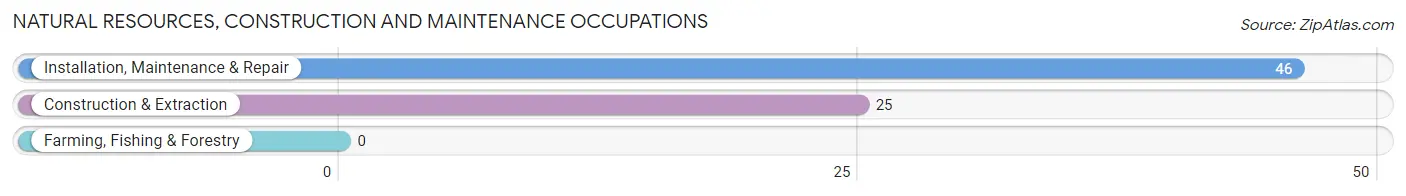
Natural Resources, Construction and Maintenance Occupations
The most common Natural Resources, Construction and Maintenance occupations in Harrington Park borough are Installation, Maintenance & Repair (46 | 1.9%), and Construction & Extraction (25 | 1.1%).
Natural Resources, Construction and Maintenance Occupations by Sex
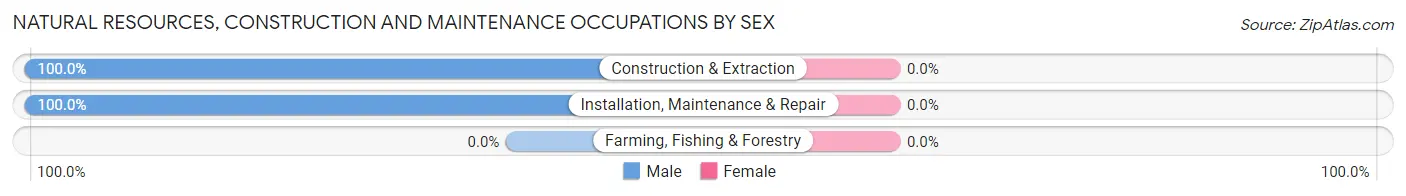
| Occupation | Male | Female |
| Farming, Fishing & Forestry | 0 (0.0%) | 0 (0.0%) |
| Construction & Extraction | 25 (100.0%) | 0 (0.0%) |
| Installation, Maintenance & Repair | 46 (100.0%) | 0 (0.0%) |
| Total (Category) | 71 (100.0%) | 0 (0.0%) |
| Total (Overall) | 1,359 (57.8%) | 994 (42.2%) |
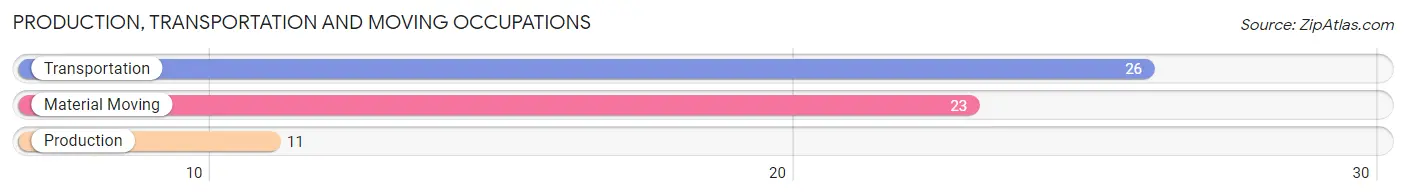
Production, Transportation and Moving Occupations
The most common Production, Transportation and Moving occupations in Harrington Park borough are Transportation (26 | 1.1%), Material Moving (23 | 1.0%), and Production (11 | 0.5%).
Production, Transportation and Moving Occupations by Sex
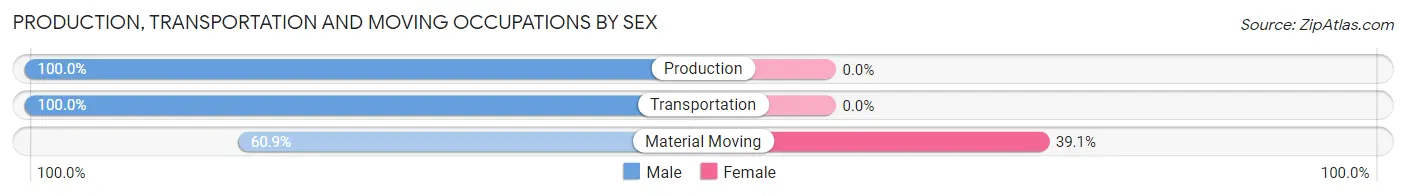
| Occupation | Male | Female |
| Production | 11 (100.0%) | 0 (0.0%) |
| Transportation | 26 (100.0%) | 0 (0.0%) |
| Material Moving | 14 (60.9%) | 9 (39.1%) |
| Total (Category) | 51 (85.0%) | 9 (15.0%) |
| Total (Overall) | 1,359 (57.8%) | 994 (42.2%) |
Employment Industries by Sex in Harrington Park borough
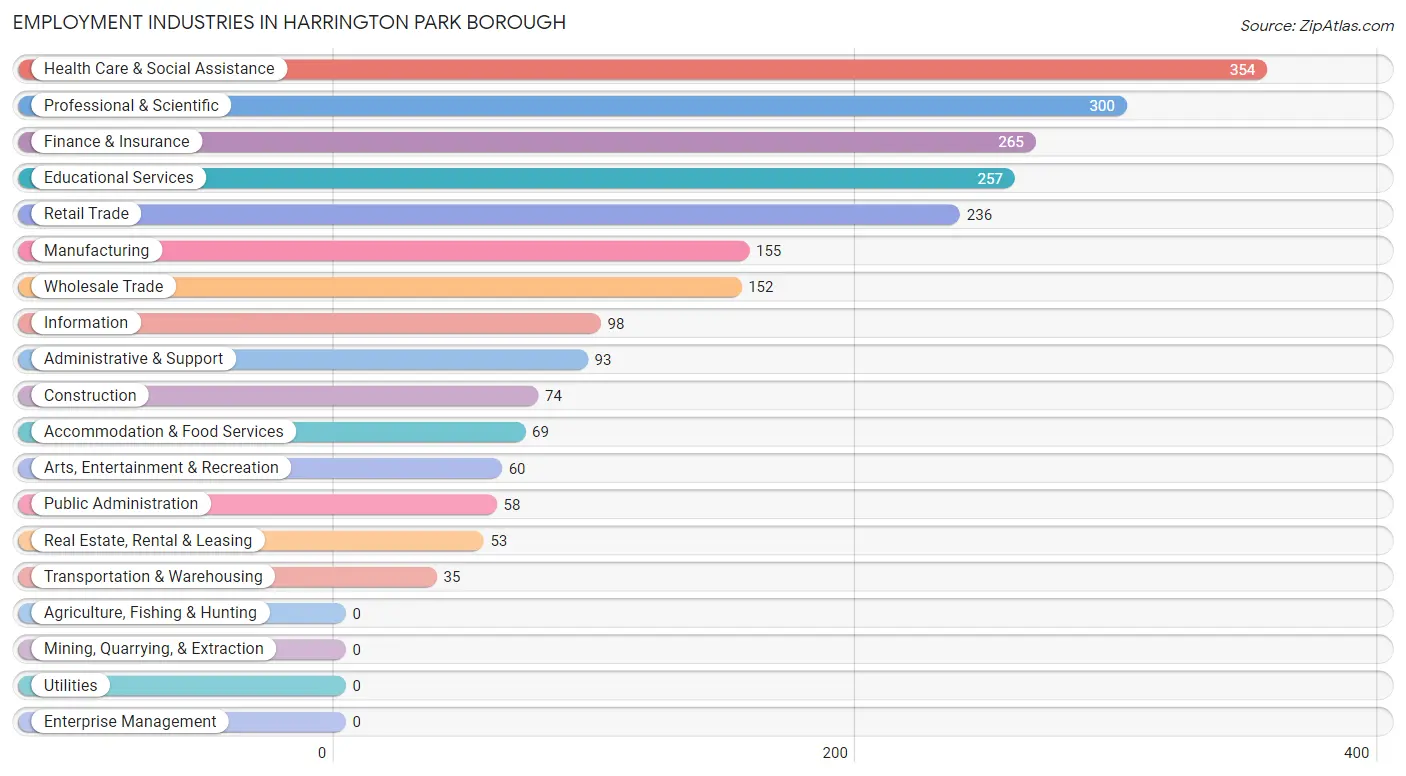
Employment Industries in Harrington Park borough
The major employment industries in Harrington Park borough include Health Care & Social Assistance (354 | 15.0%), Professional & Scientific (300 | 12.8%), Finance & Insurance (265 | 11.3%), Educational Services (257 | 10.9%), and Retail Trade (236 | 10.0%).
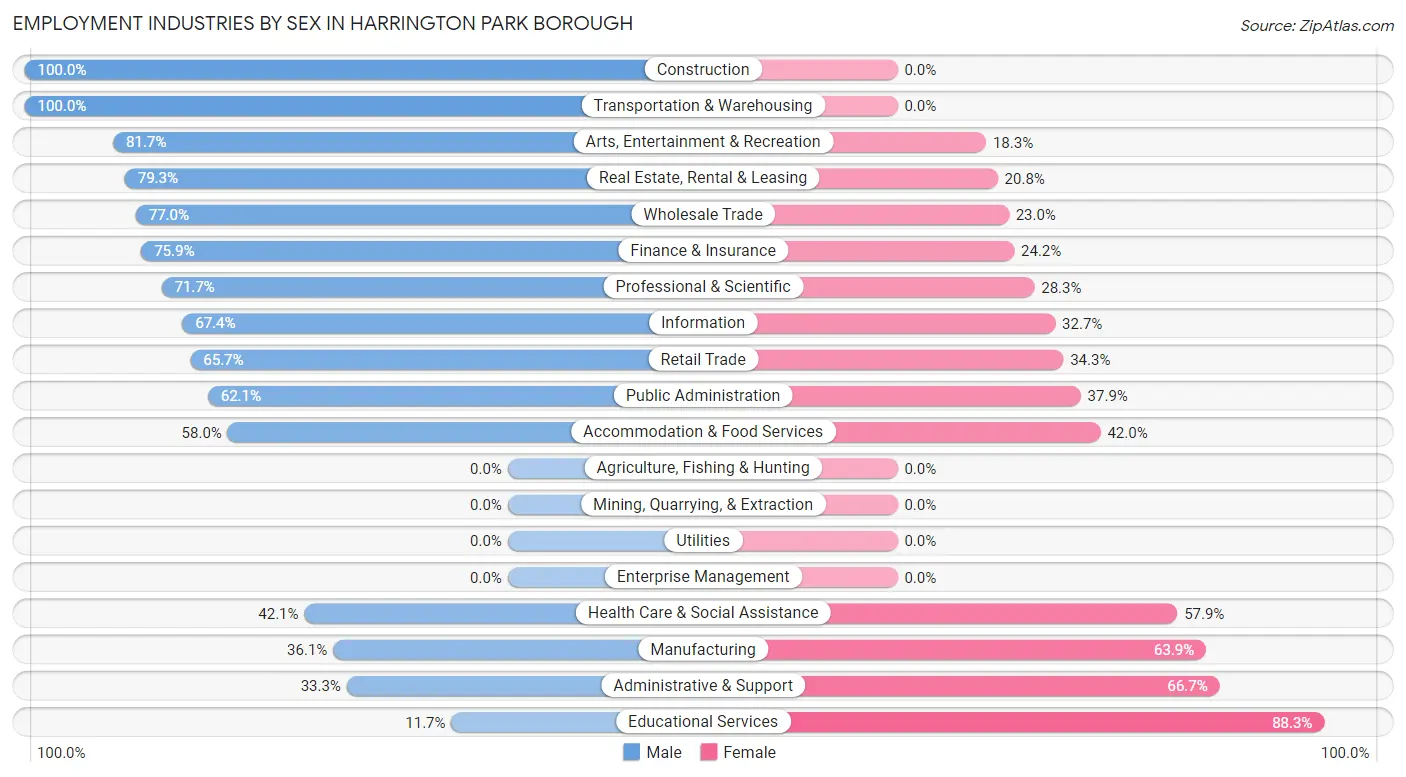
Employment Industries by Sex in Harrington Park borough
The Harrington Park borough industries that see more men than women are Construction (100.0%), Transportation & Warehousing (100.0%), and Arts, Entertainment & Recreation (81.7%), whereas the industries that tend to have a higher number of women are Educational Services (88.3%), Administrative & Support (66.7%), and Manufacturing (63.9%).
| Industry | Male | Female |
| Agriculture, Fishing & Hunting | 0 (0.0%) | 0 (0.0%) |
| Mining, Quarrying, & Extraction | 0 (0.0%) | 0 (0.0%) |
| Construction | 74 (100.0%) | 0 (0.0%) |
| Manufacturing | 56 (36.1%) | 99 (63.9%) |
| Wholesale Trade | 117 (77.0%) | 35 (23.0%) |
| Retail Trade | 155 (65.7%) | 81 (34.3%) |
| Transportation & Warehousing | 35 (100.0%) | 0 (0.0%) |
| Utilities | 0 (0.0%) | 0 (0.0%) |
| Information | 66 (67.3%) | 32 (32.7%) |
| Finance & Insurance | 201 (75.8%) | 64 (24.1%) |
| Real Estate, Rental & Leasing | 42 (79.2%) | 11 (20.7%) |
| Professional & Scientific | 215 (71.7%) | 85 (28.3%) |
| Enterprise Management | 0 (0.0%) | 0 (0.0%) |
| Administrative & Support | 31 (33.3%) | 62 (66.7%) |
| Educational Services | 30 (11.7%) | 227 (88.3%) |
| Health Care & Social Assistance | 149 (42.1%) | 205 (57.9%) |
| Arts, Entertainment & Recreation | 49 (81.7%) | 11 (18.3%) |
| Accommodation & Food Services | 40 (58.0%) | 29 (42.0%) |
| Public Administration | 36 (62.1%) | 22 (37.9%) |
| Total | 1,359 (57.8%) | 994 (42.2%) |
Education in Harrington Park borough
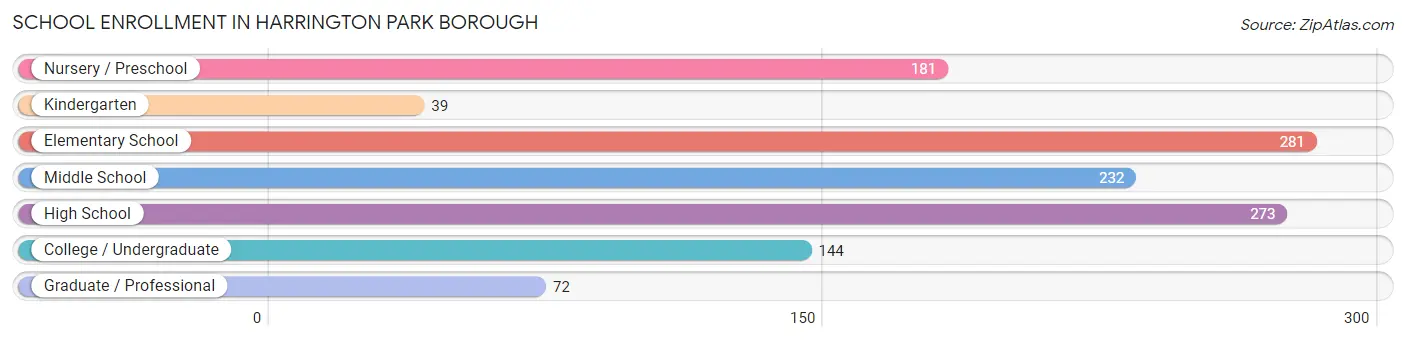
School Enrollment in Harrington Park borough
The most common levels of schooling among the 1,222 students in Harrington Park borough are elementary school (281 | 23.0%), high school (273 | 22.3%), and middle school (232 | 19.0%).
| School Level | # Students | % Students |
| Nursery / Preschool | 181 | 14.8% |
| Kindergarten | 39 | 3.2% |
| Elementary School | 281 | 23.0% |
| Middle School | 232 | 19.0% |
| High School | 273 | 22.3% |
| College / Undergraduate | 144 | 11.8% |
| Graduate / Professional | 72 | 5.9% |
| Total | 1,222 | 100.0% |
School Enrollment by Age by Funding Source in Harrington Park borough
Out of a total of 1,222 students who are enrolled in schools in Harrington Park borough, 316 (25.9%) attend a private institution, while the remaining 906 (74.1%) are enrolled in public schools. The age group of 25 to 34 year olds has the highest likelihood of being enrolled in private schools, with 37 (100.0% in the age bracket) enrolled. Conversely, the age group of 10 to 14 year olds has the lowest likelihood of being enrolled in a private school, with 288 (93.5% in the age bracket) attending a public institution.
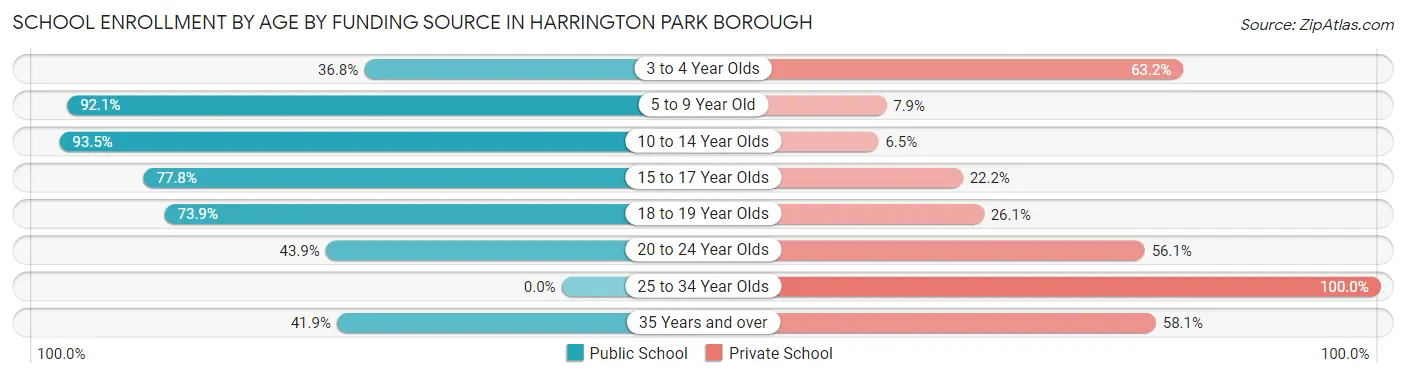
| Age Bracket | Public School | Private School |
| 3 to 4 Year Olds | 50 (36.8%) | 86 (63.2%) |
| 5 to 9 Year Old | 290 (92.1%) | 25 (7.9%) |
| 10 to 14 Year Olds | 288 (93.5%) | 20 (6.5%) |
| 15 to 17 Year Olds | 179 (77.8%) | 51 (22.2%) |
| 18 to 19 Year Olds | 34 (73.9%) | 12 (26.1%) |
| 20 to 24 Year Olds | 47 (43.9%) | 60 (56.1%) |
| 25 to 34 Year Olds | 0 (0.0%) | 37 (100.0%) |
| 35 Years and over | 18 (41.9%) | 25 (58.1%) |
| Total | 906 (74.1%) | 316 (25.9%) |
Educational Attainment by Field of Study in Harrington Park borough
Business (582 | 23.6%), education (333 | 13.5%), science & technology (214 | 8.7%), literature & languages (201 | 8.2%), and social sciences (188 | 7.6%) are the most common fields of study among 2,461 individuals in Harrington Park borough who have obtained a bachelor's degree or higher.
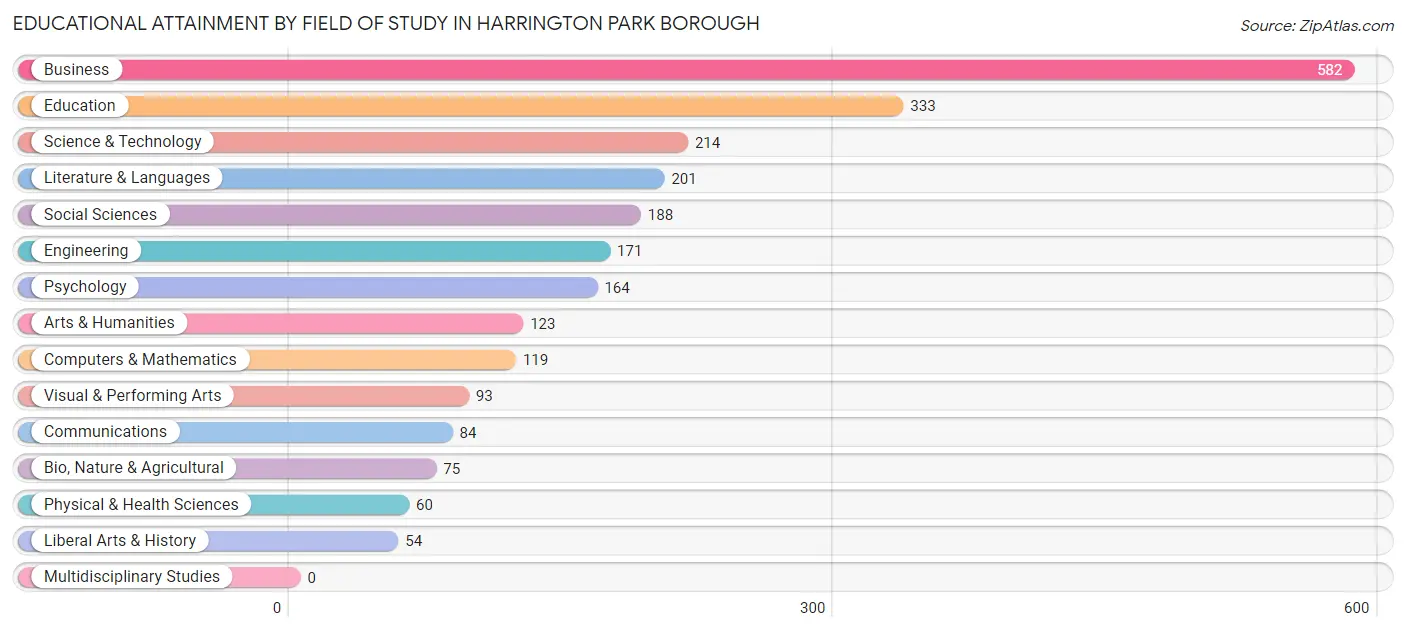
| Field of Study | # Graduates | % Graduates |
| Computers & Mathematics | 119 | 4.8% |
| Bio, Nature & Agricultural | 75 | 3.0% |
| Physical & Health Sciences | 60 | 2.4% |
| Psychology | 164 | 6.7% |
| Social Sciences | 188 | 7.6% |
| Engineering | 171 | 7.0% |
| Multidisciplinary Studies | 0 | 0.0% |
| Science & Technology | 214 | 8.7% |
| Business | 582 | 23.6% |
| Education | 333 | 13.5% |
| Literature & Languages | 201 | 8.2% |
| Liberal Arts & History | 54 | 2.2% |
| Visual & Performing Arts | 93 | 3.8% |
| Communications | 84 | 3.4% |
| Arts & Humanities | 123 | 5.0% |
| Total | 2,461 | 100.0% |
Transportation & Commute in Harrington Park borough
Vehicle Availability by Sex in Harrington Park borough
The most prevalent vehicle ownership categories in Harrington Park borough are males with 2 vehicles (548, accounting for 40.4%) and females with 2 vehicles (387, making up 56.3%).
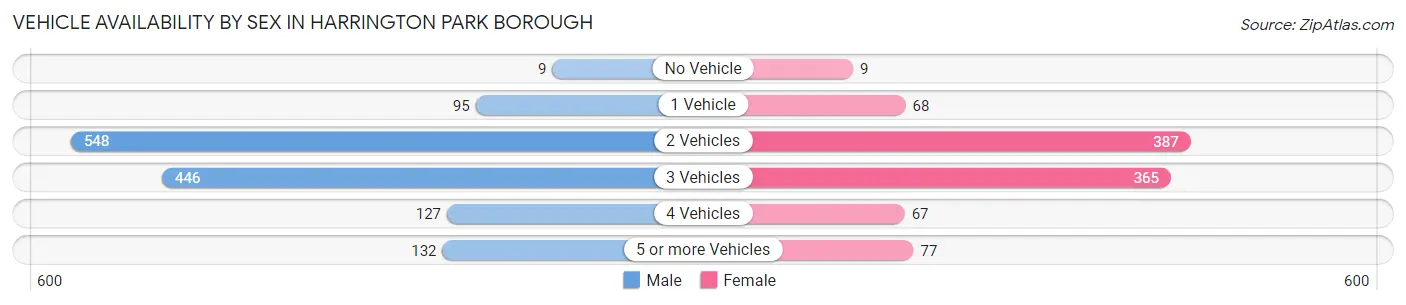
| Vehicles Available | Male | Female |
| No Vehicle | 9 (0.7%) | 9 (0.9%) |
| 1 Vehicle | 95 (7.0%) | 68 (7.0%) |
| 2 Vehicles | 548 (40.4%) | 387 (39.8%) |
| 3 Vehicles | 446 (32.9%) | 365 (37.5%) |
| 4 Vehicles | 127 (9.4%) | 67 (6.9%) |
| 5 or more Vehicles | 132 (9.7%) | 77 (7.9%) |
| Total | 1,357 (100.0%) | 973 (100.0%) |
Commute Time in Harrington Park borough
The most frequently occuring commute durations in Harrington Park borough are 15 to 19 minutes (283 commuters, 14.6%), 45 to 59 minutes (244 commuters, 12.6%), and 5 to 9 minutes (214 commuters, 11.1%).
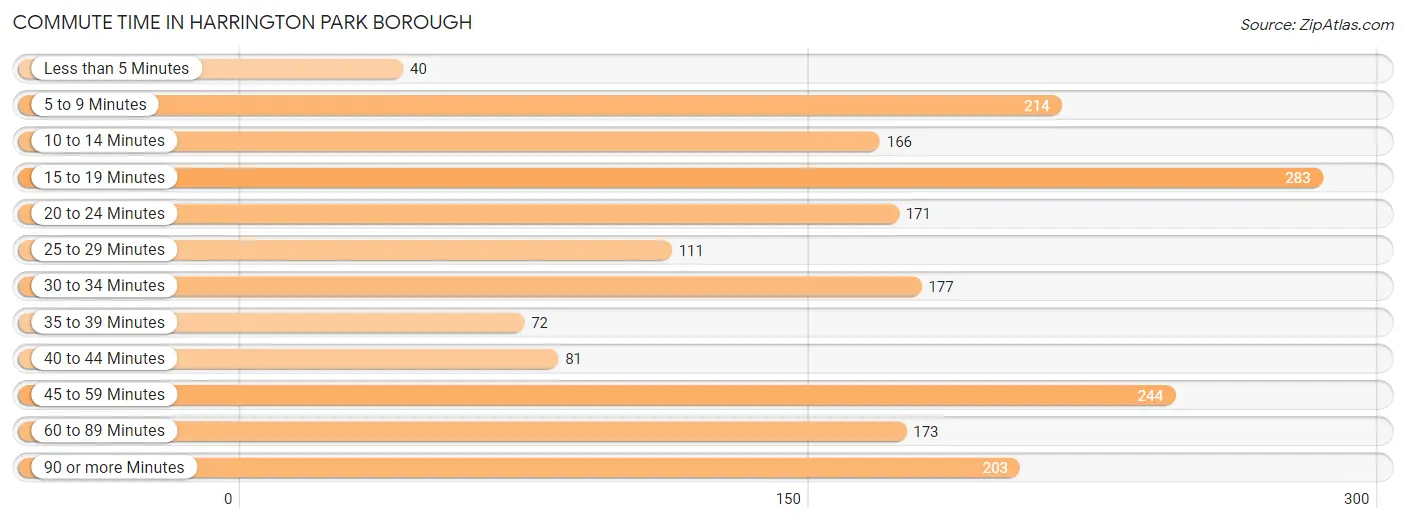
| Commute Time | # Commuters | % Commuters |
| Less than 5 Minutes | 40 | 2.1% |
| 5 to 9 Minutes | 214 | 11.1% |
| 10 to 14 Minutes | 166 | 8.6% |
| 15 to 19 Minutes | 283 | 14.6% |
| 20 to 24 Minutes | 171 | 8.8% |
| 25 to 29 Minutes | 111 | 5.7% |
| 30 to 34 Minutes | 177 | 9.1% |
| 35 to 39 Minutes | 72 | 3.7% |
| 40 to 44 Minutes | 81 | 4.2% |
| 45 to 59 Minutes | 244 | 12.6% |
| 60 to 89 Minutes | 173 | 8.9% |
| 90 or more Minutes | 203 | 10.5% |
Commute Time by Sex in Harrington Park borough
The most common commute times in Harrington Park borough are 15 to 19 minutes (232 commuters, 20.9%) for males and 5 to 9 minutes (124 commuters, 15.0%) for females.
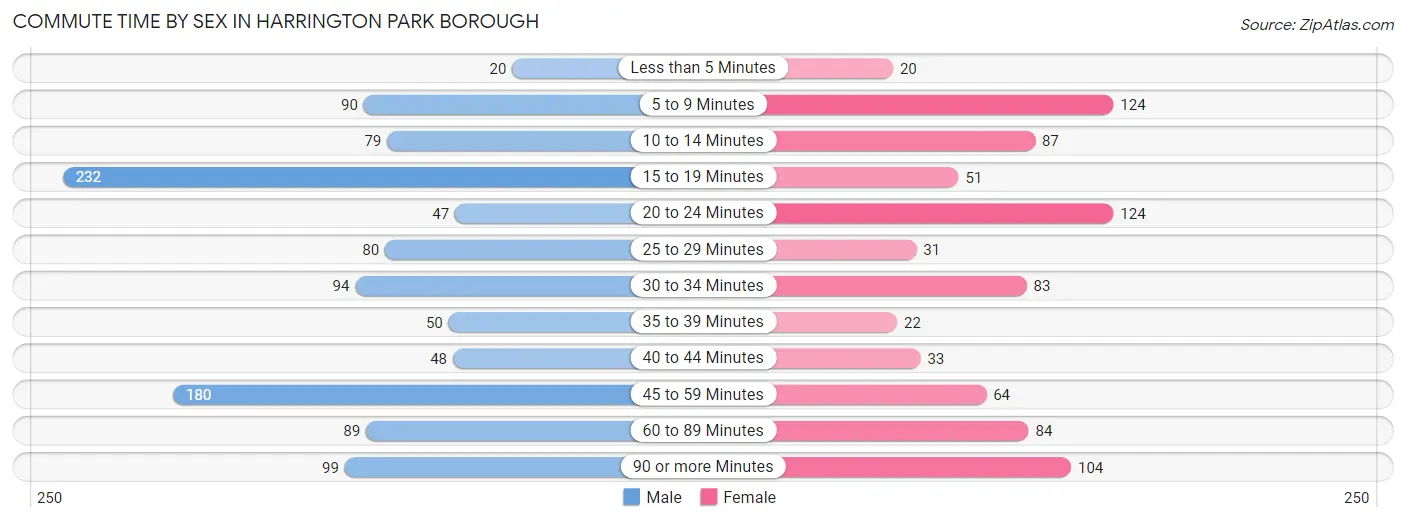
| Commute Time | Male | Female |
| Less than 5 Minutes | 20 (1.8%) | 20 (2.4%) |
| 5 to 9 Minutes | 90 (8.1%) | 124 (15.0%) |
| 10 to 14 Minutes | 79 (7.1%) | 87 (10.5%) |
| 15 to 19 Minutes | 232 (20.9%) | 51 (6.2%) |
| 20 to 24 Minutes | 47 (4.2%) | 124 (15.0%) |
| 25 to 29 Minutes | 80 (7.2%) | 31 (3.7%) |
| 30 to 34 Minutes | 94 (8.5%) | 83 (10.0%) |
| 35 to 39 Minutes | 50 (4.5%) | 22 (2.7%) |
| 40 to 44 Minutes | 48 (4.3%) | 33 (4.0%) |
| 45 to 59 Minutes | 180 (16.3%) | 64 (7.7%) |
| 60 to 89 Minutes | 89 (8.0%) | 84 (10.2%) |
| 90 or more Minutes | 99 (8.9%) | 104 (12.6%) |
Time of Departure to Work by Sex in Harrington Park borough
The most frequent times of departure to work in Harrington Park borough are 7:00 AM to 7:29 AM (202, 18.2%) for males and 8:00 AM to 8:29 AM (301, 36.4%) for females.
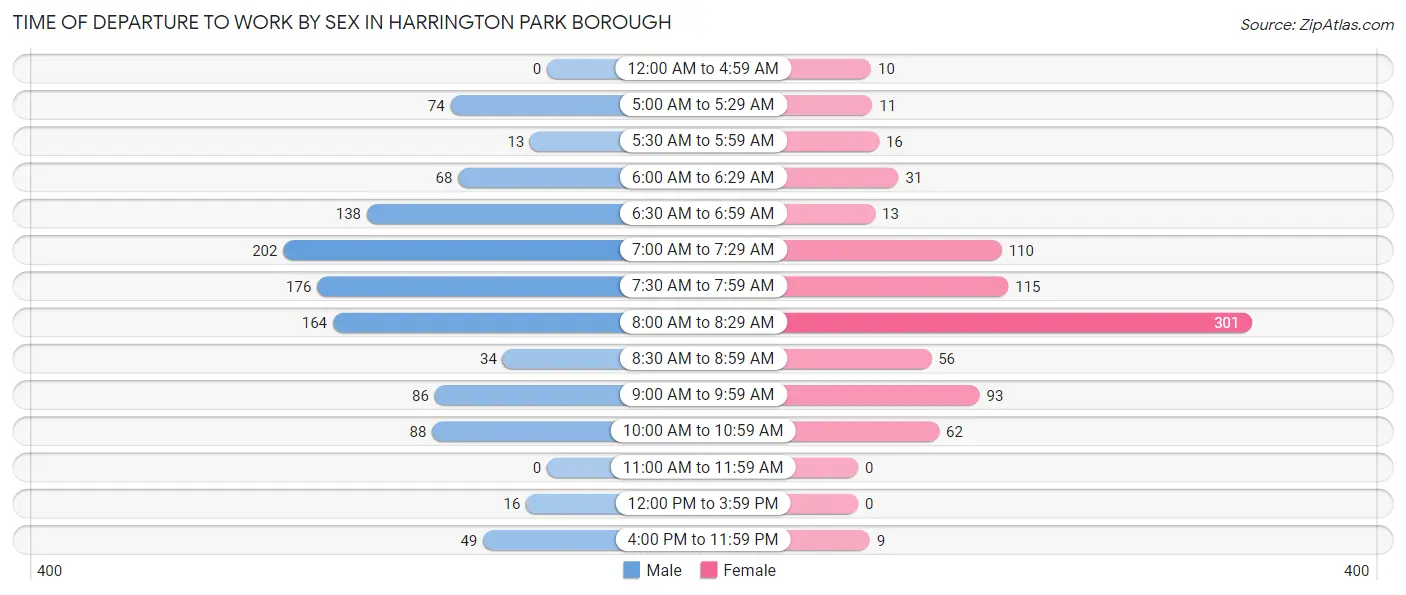
| Time of Departure | Male | Female |
| 12:00 AM to 4:59 AM | 0 (0.0%) | 10 (1.2%) |
| 5:00 AM to 5:29 AM | 74 (6.7%) | 11 (1.3%) |
| 5:30 AM to 5:59 AM | 13 (1.2%) | 16 (1.9%) |
| 6:00 AM to 6:29 AM | 68 (6.1%) | 31 (3.7%) |
| 6:30 AM to 6:59 AM | 138 (12.4%) | 13 (1.6%) |
| 7:00 AM to 7:29 AM | 202 (18.2%) | 110 (13.3%) |
| 7:30 AM to 7:59 AM | 176 (15.9%) | 115 (13.9%) |
| 8:00 AM to 8:29 AM | 164 (14.8%) | 301 (36.4%) |
| 8:30 AM to 8:59 AM | 34 (3.1%) | 56 (6.8%) |
| 9:00 AM to 9:59 AM | 86 (7.8%) | 93 (11.3%) |
| 10:00 AM to 10:59 AM | 88 (7.9%) | 62 (7.5%) |
| 11:00 AM to 11:59 AM | 0 (0.0%) | 0 (0.0%) |
| 12:00 PM to 3:59 PM | 16 (1.4%) | 0 (0.0%) |
| 4:00 PM to 11:59 PM | 49 (4.4%) | 9 (1.1%) |
| Total | 1,108 (100.0%) | 827 (100.0%) |
Housing Occupancy in Harrington Park borough
Occupancy by Ownership in Harrington Park borough
Of the total 1,737 dwellings in Harrington Park borough, owner-occupied units account for 1,696 (97.6%), while renter-occupied units make up 41 (2.4%).
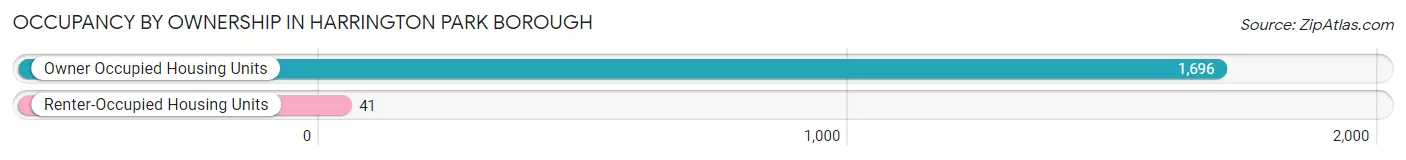
| Occupancy | # Housing Units | % Housing Units |
| Owner Occupied Housing Units | 1,696 | 97.6% |
| Renter-Occupied Housing Units | 41 | 2.4% |
| Total Occupied Housing Units | 1,737 | 100.0% |
Occupancy by Household Size in Harrington Park borough
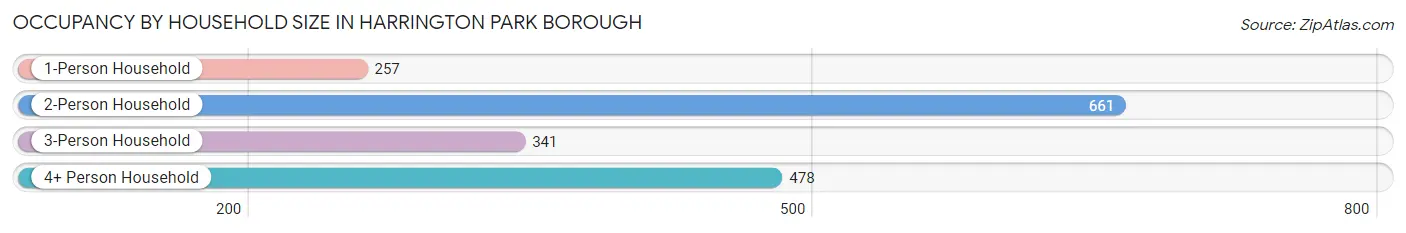
| Household Size | # Housing Units | % Housing Units |
| 1-Person Household | 257 | 14.8% |
| 2-Person Household | 661 | 38.1% |
| 3-Person Household | 341 | 19.6% |
| 4+ Person Household | 478 | 27.5% |
| Total Housing Units | 1,737 | 100.0% |
Occupancy by Ownership by Household Size in Harrington Park borough
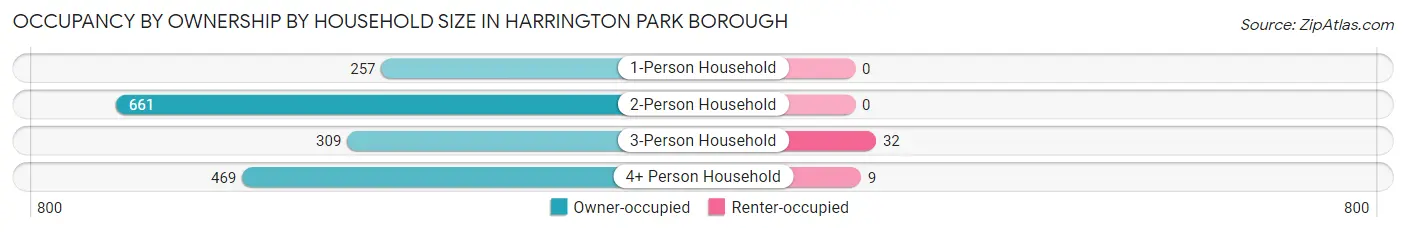
| Household Size | Owner-occupied | Renter-occupied |
| 1-Person Household | 257 (100.0%) | 0 (0.0%) |
| 2-Person Household | 661 (100.0%) | 0 (0.0%) |
| 3-Person Household | 309 (90.6%) | 32 (9.4%) |
| 4+ Person Household | 469 (98.1%) | 9 (1.9%) |
| Total Housing Units | 1,696 (97.6%) | 41 (2.4%) |
Occupancy by Educational Attainment in Harrington Park borough
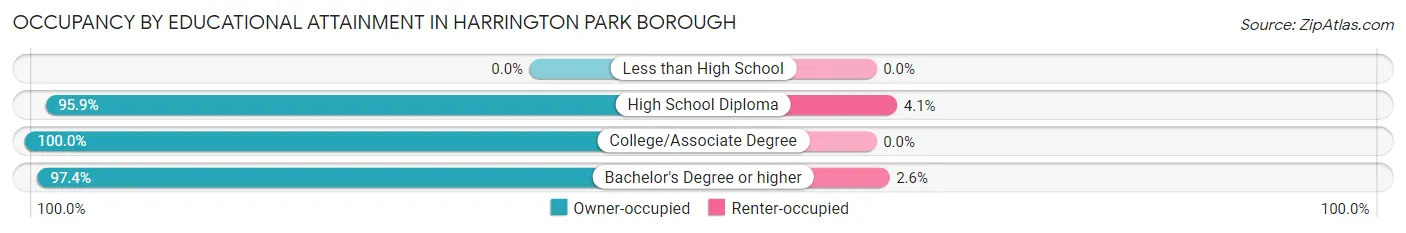
| Household Size | Owner-occupied | Renter-occupied |
| Less than High School | 0 (0.0%) | 0 (0.0%) |
| High School Diploma | 234 (95.9%) | 10 (4.1%) |
| College/Associate Degree | 293 (100.0%) | 0 (0.0%) |
| Bachelor's Degree or higher | 1,169 (97.4%) | 31 (2.6%) |
Occupancy by Age of Householder in Harrington Park borough
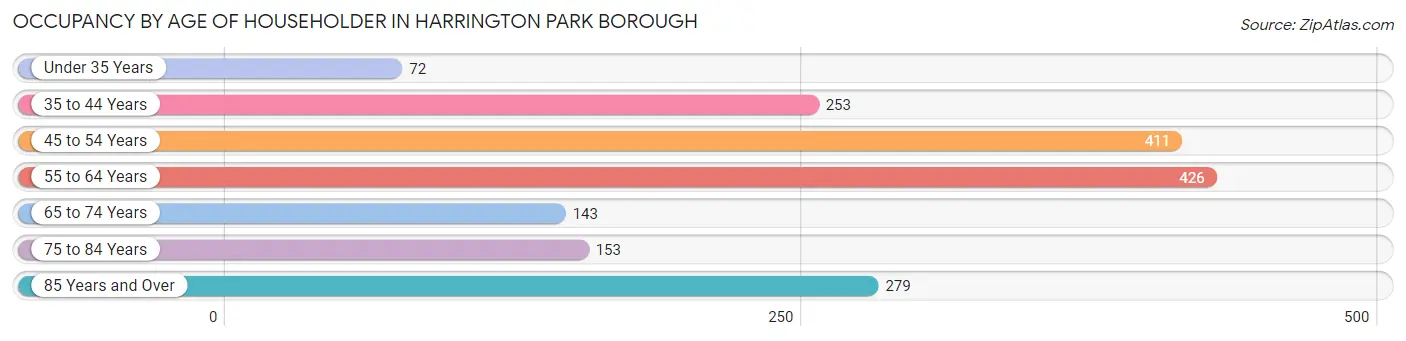
| Age Bracket | # Households | % Households |
| Under 35 Years | 72 | 4.2% |
| 35 to 44 Years | 253 | 14.6% |
| 45 to 54 Years | 411 | 23.7% |
| 55 to 64 Years | 426 | 24.5% |
| 65 to 74 Years | 143 | 8.2% |
| 75 to 84 Years | 153 | 8.8% |
| 85 Years and Over | 279 | 16.1% |
| Total | 1,737 | 100.0% |
Housing Finances in Harrington Park borough
Median Income by Occupancy in Harrington Park borough
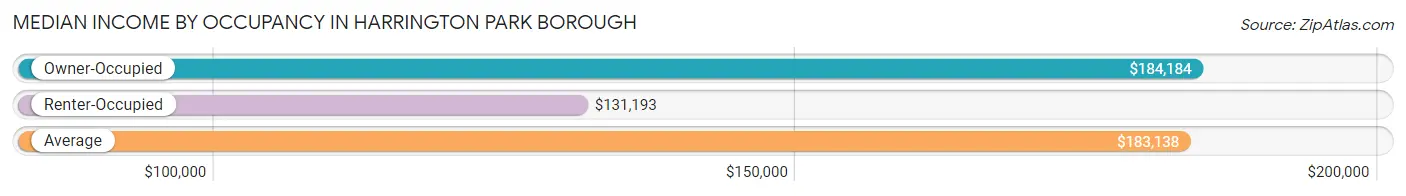
| Occupancy Type | # Households | Median Income |
| Owner-Occupied | 1,696 (97.6%) | $184,184 |
| Renter-Occupied | 41 (2.4%) | $131,193 |
| Average | 1,737 (100.0%) | $183,138 |
Occupancy by Householder Income Bracket in Harrington Park borough
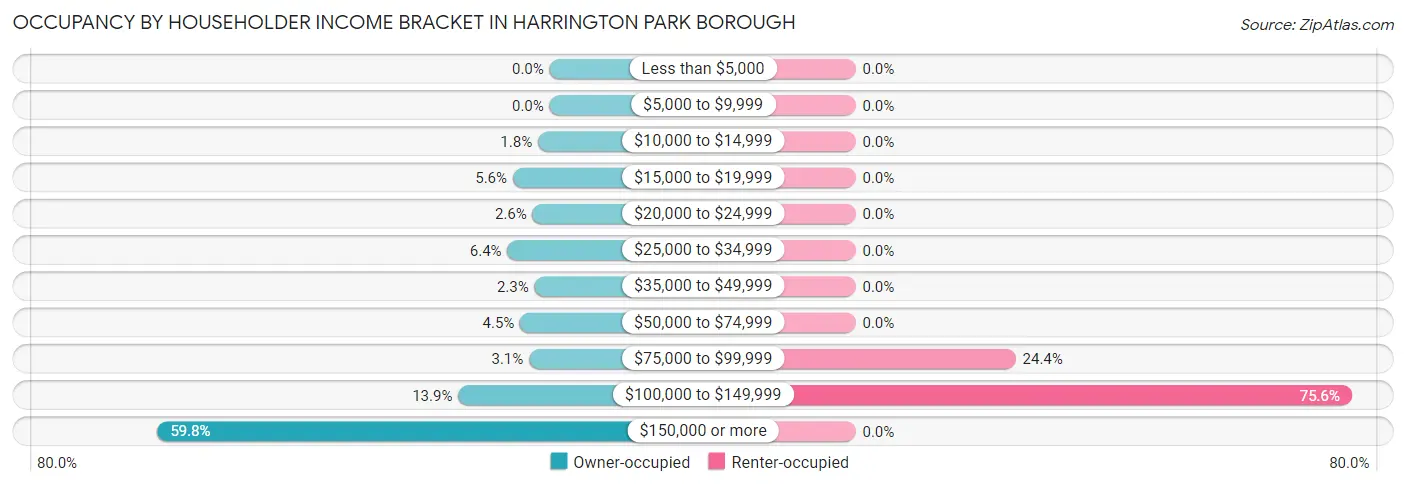
| Income Bracket | Owner-occupied | Renter-occupied |
| Less than $5,000 | 0 (0.0%) | 0 (0.0%) |
| $5,000 to $9,999 | 0 (0.0%) | 0 (0.0%) |
| $10,000 to $14,999 | 30 (1.8%) | 0 (0.0%) |
| $15,000 to $19,999 | 95 (5.6%) | 0 (0.0%) |
| $20,000 to $24,999 | 44 (2.6%) | 0 (0.0%) |
| $25,000 to $34,999 | 109 (6.4%) | 0 (0.0%) |
| $35,000 to $49,999 | 39 (2.3%) | 0 (0.0%) |
| $50,000 to $74,999 | 76 (4.5%) | 0 (0.0%) |
| $75,000 to $99,999 | 53 (3.1%) | 10 (24.4%) |
| $100,000 to $149,999 | 236 (13.9%) | 31 (75.6%) |
| $150,000 or more | 1,014 (59.8%) | 0 (0.0%) |
| Total | 1,696 (100.0%) | 41 (100.0%) |
Monthly Housing Cost Tiers in Harrington Park borough
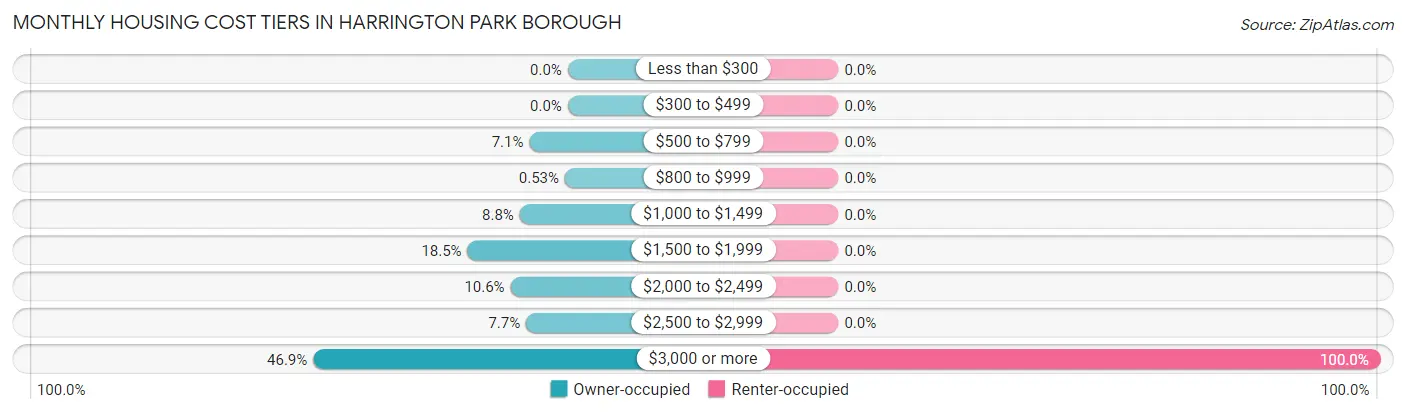
| Monthly Cost | Owner-occupied | Renter-occupied |
| Less than $300 | 0 (0.0%) | 0 (0.0%) |
| $300 to $499 | 0 (0.0%) | 0 (0.0%) |
| $500 to $799 | 120 (7.1%) | 0 (0.0%) |
| $800 to $999 | 9 (0.5%) | 0 (0.0%) |
| $1,000 to $1,499 | 150 (8.8%) | 0 (0.0%) |
| $1,500 to $1,999 | 313 (18.5%) | 0 (0.0%) |
| $2,000 to $2,499 | 179 (10.5%) | 0 (0.0%) |
| $2,500 to $2,999 | 130 (7.7%) | 0 (0.0%) |
| $3,000 or more | 795 (46.9%) | 41 (100.0%) |
| Total | 1,696 (100.0%) | 41 (100.0%) |
Physical Housing Characteristics in Harrington Park borough
Housing Structures in Harrington Park borough
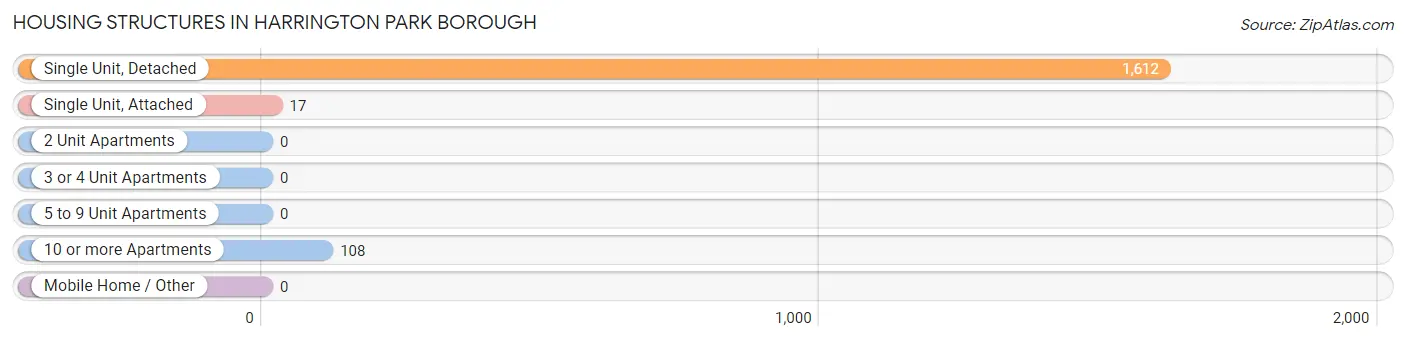
| Structure Type | # Housing Units | % Housing Units |
| Single Unit, Detached | 1,612 | 92.8% |
| Single Unit, Attached | 17 | 1.0% |
| 2 Unit Apartments | 0 | 0.0% |
| 3 or 4 Unit Apartments | 0 | 0.0% |
| 5 to 9 Unit Apartments | 0 | 0.0% |
| 10 or more Apartments | 108 | 6.2% |
| Mobile Home / Other | 0 | 0.0% |
| Total | 1,737 | 100.0% |
Housing Structures by Occupancy in Harrington Park borough
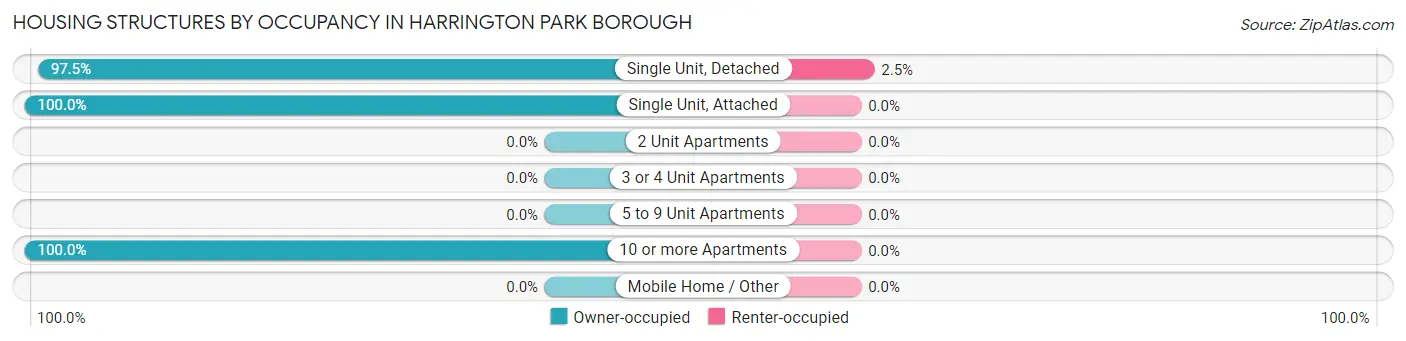
| Structure Type | Owner-occupied | Renter-occupied |
| Single Unit, Detached | 1,571 (97.5%) | 41 (2.5%) |
| Single Unit, Attached | 17 (100.0%) | 0 (0.0%) |
| 2 Unit Apartments | 0 (0.0%) | 0 (0.0%) |
| 3 or 4 Unit Apartments | 0 (0.0%) | 0 (0.0%) |
| 5 to 9 Unit Apartments | 0 (0.0%) | 0 (0.0%) |
| 10 or more Apartments | 108 (100.0%) | 0 (0.0%) |
| Mobile Home / Other | 0 (0.0%) | 0 (0.0%) |
| Total | 1,696 (97.6%) | 41 (2.4%) |
Housing Structures by Number of Rooms in Harrington Park borough
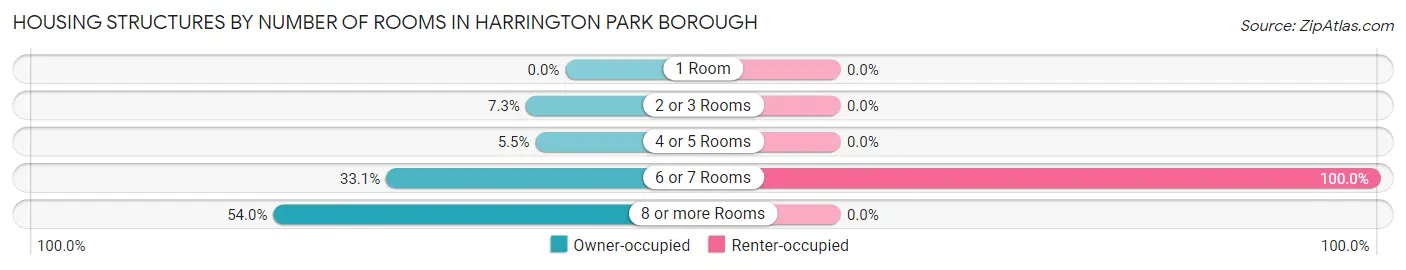
| Number of Rooms | Owner-occupied | Renter-occupied |
| 1 Room | 0 (0.0%) | 0 (0.0%) |
| 2 or 3 Rooms | 124 (7.3%) | 0 (0.0%) |
| 4 or 5 Rooms | 94 (5.5%) | 0 (0.0%) |
| 6 or 7 Rooms | 562 (33.1%) | 41 (100.0%) |
| 8 or more Rooms | 916 (54.0%) | 0 (0.0%) |
| Total | 1,696 (100.0%) | 41 (100.0%) |
Housing Structure by Heating Type in Harrington Park borough
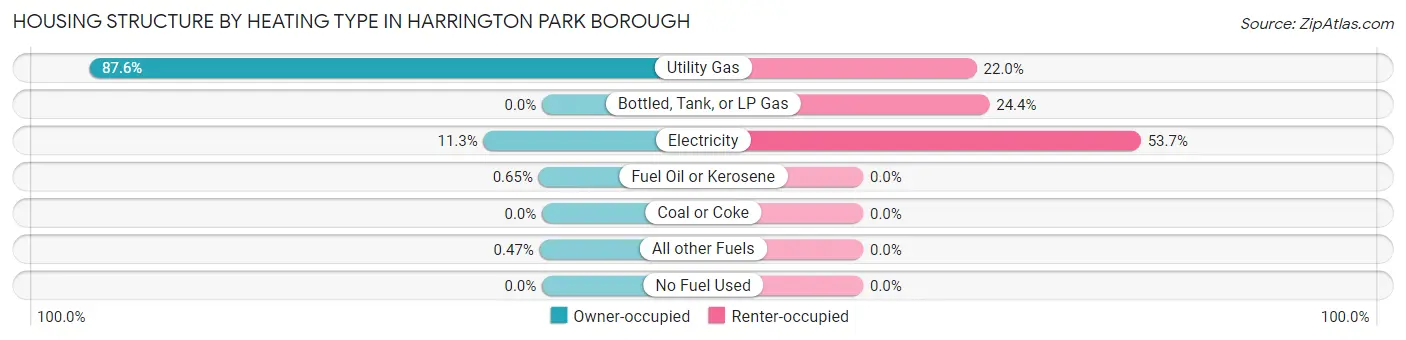
| Heating Type | Owner-occupied | Renter-occupied |
| Utility Gas | 1,485 (87.6%) | 9 (22.0%) |
| Bottled, Tank, or LP Gas | 0 (0.0%) | 10 (24.4%) |
| Electricity | 192 (11.3%) | 22 (53.7%) |
| Fuel Oil or Kerosene | 11 (0.6%) | 0 (0.0%) |
| Coal or Coke | 0 (0.0%) | 0 (0.0%) |
| All other Fuels | 8 (0.5%) | 0 (0.0%) |
| No Fuel Used | 0 (0.0%) | 0 (0.0%) |
| Total | 1,696 (100.0%) | 41 (100.0%) |
Household Vehicle Usage in Harrington Park borough
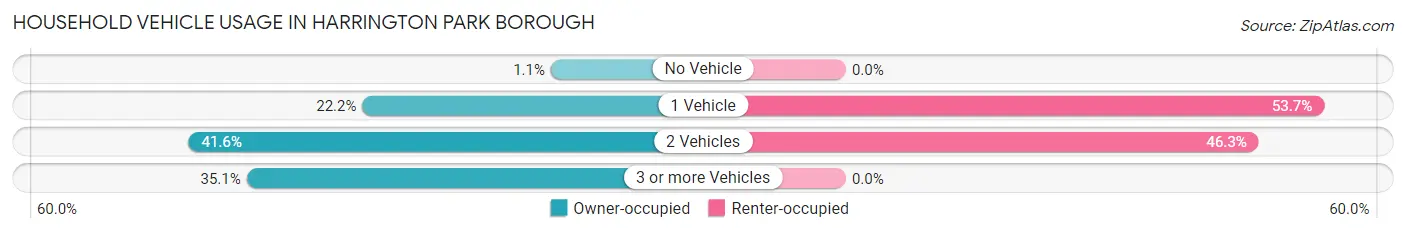
| Vehicles per Household | Owner-occupied | Renter-occupied |
| No Vehicle | 18 (1.1%) | 0 (0.0%) |
| 1 Vehicle | 376 (22.2%) | 22 (53.7%) |
| 2 Vehicles | 706 (41.6%) | 19 (46.3%) |
| 3 or more Vehicles | 596 (35.1%) | 0 (0.0%) |
| Total | 1,696 (100.0%) | 41 (100.0%) |
Real Estate & Mortgages in Harrington Park borough
Real Estate and Mortgage Overview in Harrington Park borough
| Characteristic | Without Mortgage | With Mortgage |
| Housing Units | 708 | 988 |
| Median Property Value | $558,200 | $779,000 |
| Median Household Income | $128,245 | $723 |
| Monthly Housing Costs | $1,501 | $795 |
| Real Estate Taxes | $10,001 | $0 |
Property Value by Mortgage Status in Harrington Park borough
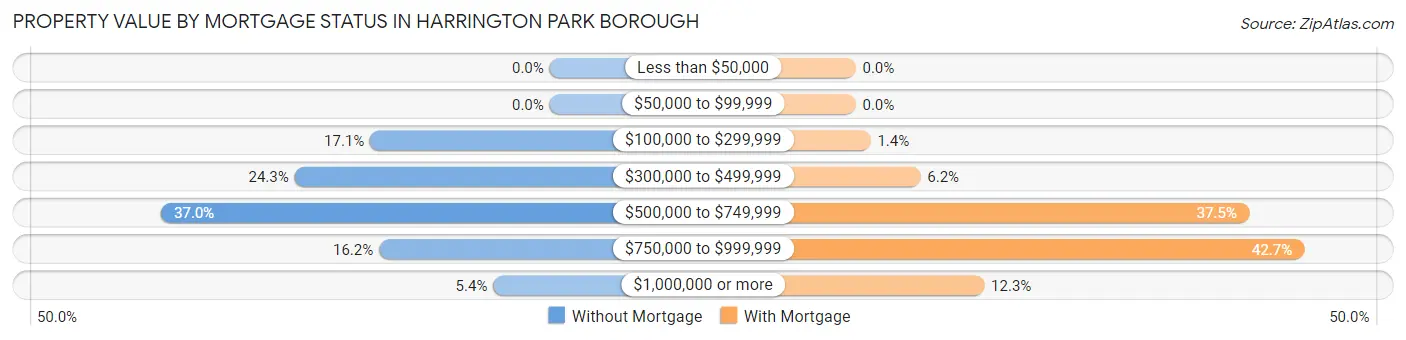
| Property Value | Without Mortgage | With Mortgage |
| Less than $50,000 | 0 (0.0%) | 0 (0.0%) |
| $50,000 to $99,999 | 0 (0.0%) | 0 (0.0%) |
| $100,000 to $299,999 | 121 (17.1%) | 14 (1.4%) |
| $300,000 to $499,999 | 172 (24.3%) | 61 (6.2%) |
| $500,000 to $749,999 | 262 (37.0%) | 370 (37.4%) |
| $750,000 to $999,999 | 115 (16.2%) | 422 (42.7%) |
| $1,000,000 or more | 38 (5.4%) | 121 (12.2%) |
| Total | 708 (100.0%) | 988 (100.0%) |
Household Income by Mortgage Status in Harrington Park borough
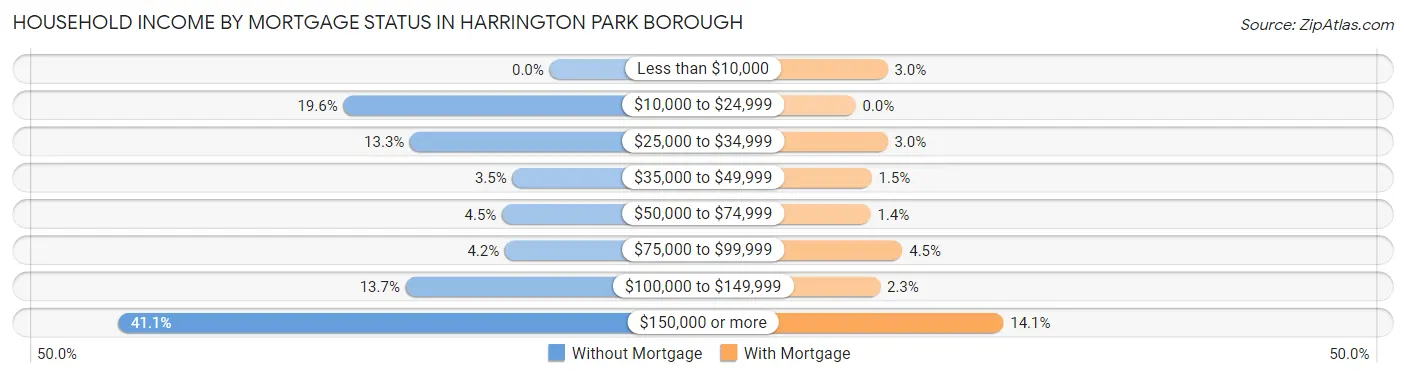
| Household Income | Without Mortgage | With Mortgage |
| Less than $10,000 | 0 (0.0%) | 30 (3.0%) |
| $10,000 to $24,999 | 139 (19.6%) | 0 (0.0%) |
| $25,000 to $34,999 | 94 (13.3%) | 30 (3.0%) |
| $35,000 to $49,999 | 25 (3.5%) | 15 (1.5%) |
| $50,000 to $74,999 | 32 (4.5%) | 14 (1.4%) |
| $75,000 to $99,999 | 30 (4.2%) | 44 (4.4%) |
| $100,000 to $149,999 | 97 (13.7%) | 23 (2.3%) |
| $150,000 or more | 291 (41.1%) | 139 (14.1%) |
| Total | 708 (100.0%) | 988 (100.0%) |
Property Value to Household Income Ratio in Harrington Park borough
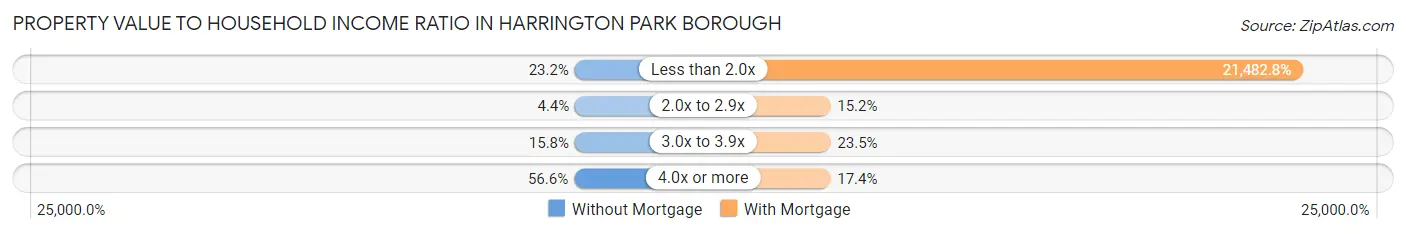
| Value-to-Income Ratio | Without Mortgage | With Mortgage |
| Less than 2.0x | 164 (23.2%) | 212,250 (21,482.8%) |
| 2.0x to 2.9x | 31 (4.4%) | 150 (15.2%) |
| 3.0x to 3.9x | 112 (15.8%) | 232 (23.5%) |
| 4.0x or more | 401 (56.6%) | 172 (17.4%) |
| Total | 708 (100.0%) | 988 (100.0%) |
Real Estate Taxes by Mortgage Status in Harrington Park borough
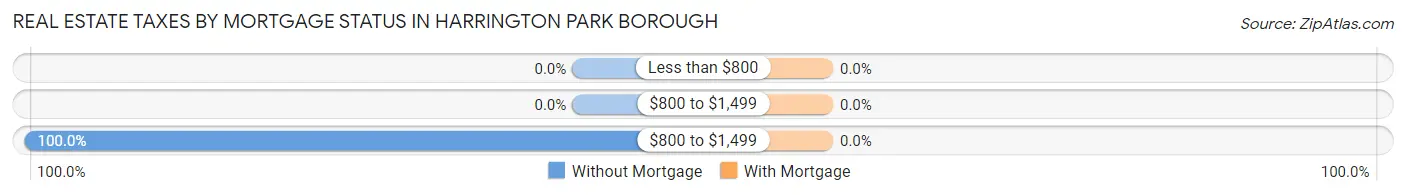
| Property Taxes | Without Mortgage | With Mortgage |
| Less than $800 | 0 (0.0%) | 0 (0.0%) |
| $800 to $1,499 | 0 (0.0%) | 0 (0.0%) |
| $800 to $1,499 | 708 (100.0%) | 0 (0.0%) |
| Total | 708 (100.0%) | 988 (100.0%) |
Health & Disability in Harrington Park borough
Health Insurance Coverage by Age in Harrington Park borough
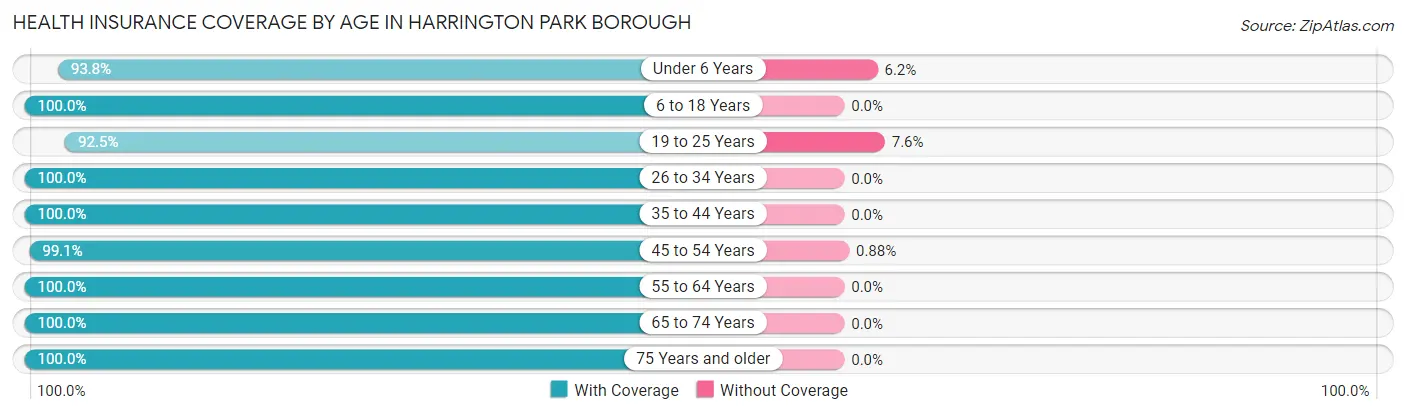
| Age Bracket | With Coverage | Without Coverage |
| Under 6 Years | 363 (93.8%) | 24 (6.2%) |
| 6 to 18 Years | 841 (100.0%) | 0 (0.0%) |
| 19 to 25 Years | 257 (92.4%) | 21 (7.5%) |
| 26 to 34 Years | 212 (100.0%) | 0 (0.0%) |
| 35 to 44 Years | 525 (100.0%) | 0 (0.0%) |
| 45 to 54 Years | 792 (99.1%) | 7 (0.9%) |
| 55 to 64 Years | 854 (100.0%) | 0 (0.0%) |
| 65 to 74 Years | 297 (100.0%) | 0 (0.0%) |
| 75 Years and older | 633 (100.0%) | 0 (0.0%) |
| Total | 4,774 (98.9%) | 52 (1.1%) |
Health Insurance Coverage by Citizenship Status in Harrington Park borough
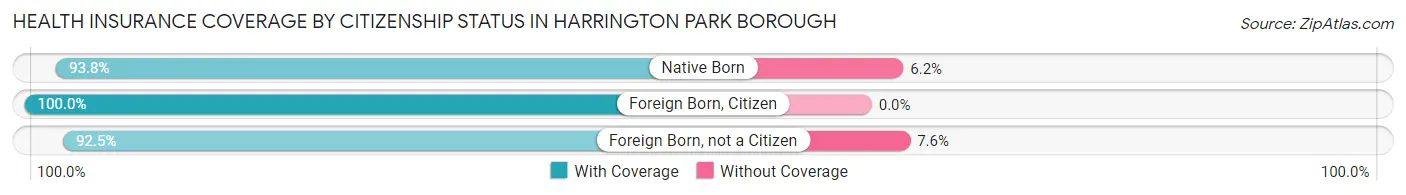
| Citizenship Status | With Coverage | Without Coverage |
| Native Born | 363 (93.8%) | 24 (6.2%) |
| Foreign Born, Citizen | 841 (100.0%) | 0 (0.0%) |
| Foreign Born, not a Citizen | 257 (92.4%) | 21 (7.5%) |
Health Insurance Coverage by Household Income in Harrington Park borough
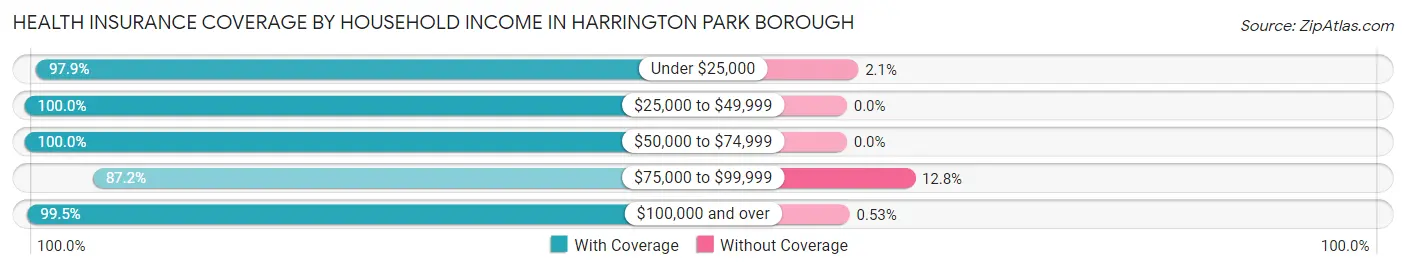
| Household Income | With Coverage | Without Coverage |
| Under $25,000 | 320 (97.9%) | 7 (2.1%) |
| $25,000 to $49,999 | 193 (100.0%) | 0 (0.0%) |
| $50,000 to $74,999 | 175 (100.0%) | 0 (0.0%) |
| $75,000 to $99,999 | 164 (87.2%) | 24 (12.8%) |
| $100,000 and over | 3,917 (99.5%) | 21 (0.5%) |
Public vs Private Health Insurance Coverage by Age in Harrington Park borough
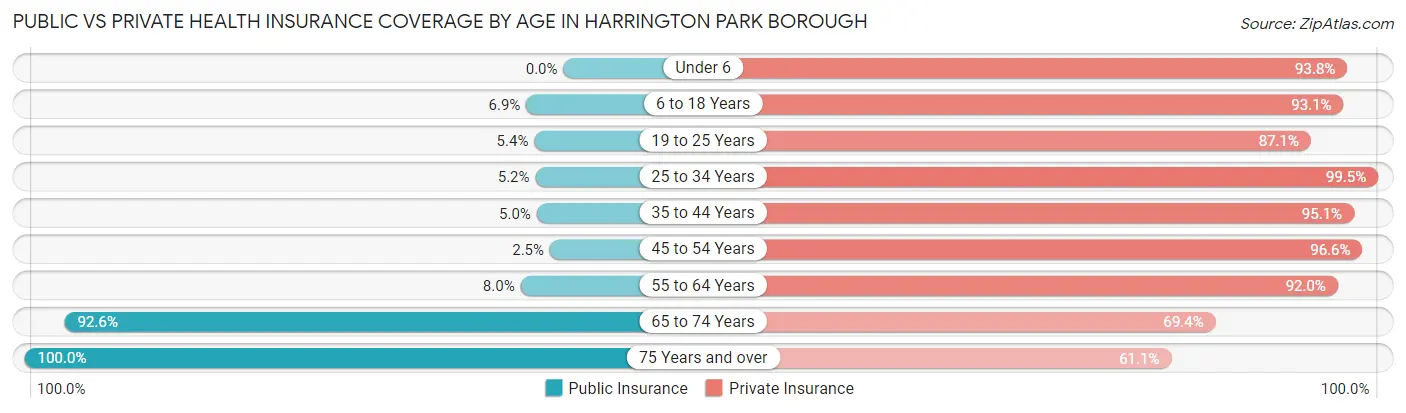
| Age Bracket | Public Insurance | Private Insurance |
| Under 6 | 0 (0.0%) | 363 (93.8%) |
| 6 to 18 Years | 58 (6.9%) | 783 (93.1%) |
| 19 to 25 Years | 15 (5.4%) | 242 (87.1%) |
| 25 to 34 Years | 11 (5.2%) | 211 (99.5%) |
| 35 to 44 Years | 26 (5.0%) | 499 (95.1%) |
| 45 to 54 Years | 20 (2.5%) | 772 (96.6%) |
| 55 to 64 Years | 68 (8.0%) | 786 (92.0%) |
| 65 to 74 Years | 275 (92.6%) | 206 (69.4%) |
| 75 Years and over | 633 (100.0%) | 387 (61.1%) |
| Total | 1,106 (22.9%) | 4,249 (88.0%) |
Disability Status by Sex by Age in Harrington Park borough
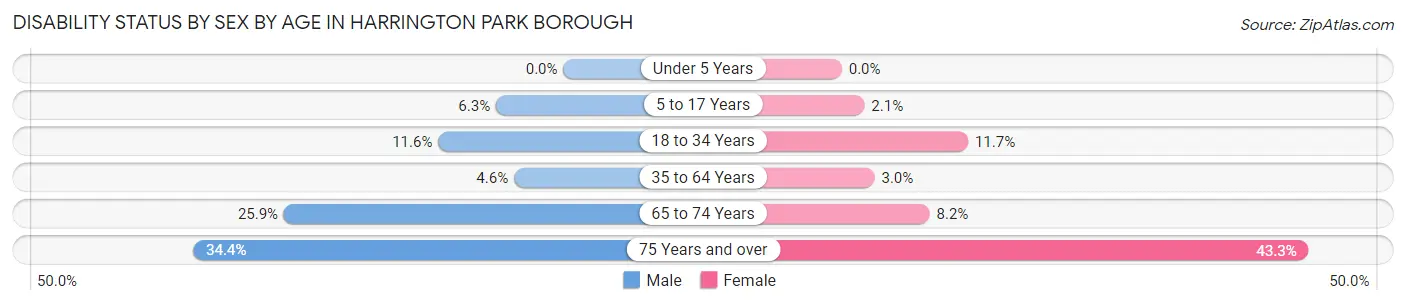
| Age Bracket | Male | Female |
| Under 5 Years | 0 (0.0%) | 0 (0.0%) |
| 5 to 17 Years | 24 (6.2%) | 10 (2.1%) |
| 18 to 34 Years | 36 (11.6%) | 26 (11.7%) |
| 35 to 64 Years | 50 (4.6%) | 33 (3.0%) |
| 65 to 74 Years | 42 (25.9%) | 11 (8.2%) |
| 75 Years and over | 89 (34.4%) | 162 (43.3%) |
Disability Class by Sex by Age in Harrington Park borough
Disability Class: Hearing Difficulty
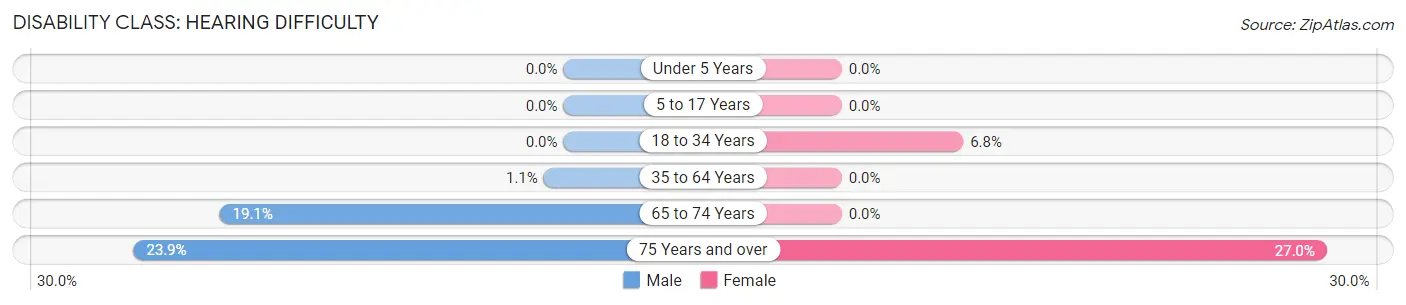
| Age Bracket | Male | Female |
| Under 5 Years | 0 (0.0%) | 0 (0.0%) |
| 5 to 17 Years | 0 (0.0%) | 0 (0.0%) |
| 18 to 34 Years | 0 (0.0%) | 15 (6.8%) |
| 35 to 64 Years | 12 (1.1%) | 0 (0.0%) |
| 65 to 74 Years | 31 (19.1%) | 0 (0.0%) |
| 75 Years and over | 62 (23.9%) | 101 (27.0%) |
Disability Class: Vision Difficulty
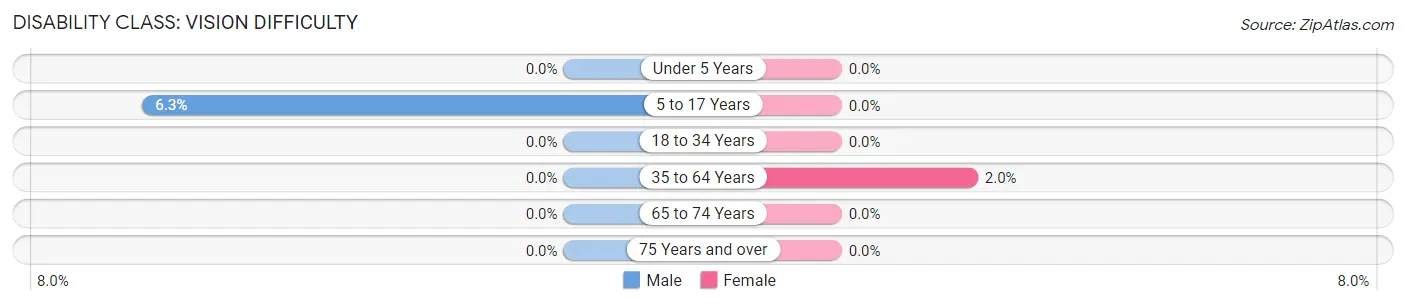
| Age Bracket | Male | Female |
| Under 5 Years | 0 (0.0%) | 0 (0.0%) |
| 5 to 17 Years | 24 (6.2%) | 0 (0.0%) |
| 18 to 34 Years | 0 (0.0%) | 0 (0.0%) |
| 35 to 64 Years | 0 (0.0%) | 22 (2.0%) |
| 65 to 74 Years | 0 (0.0%) | 0 (0.0%) |
| 75 Years and over | 0 (0.0%) | 0 (0.0%) |
Disability Class: Cognitive Difficulty
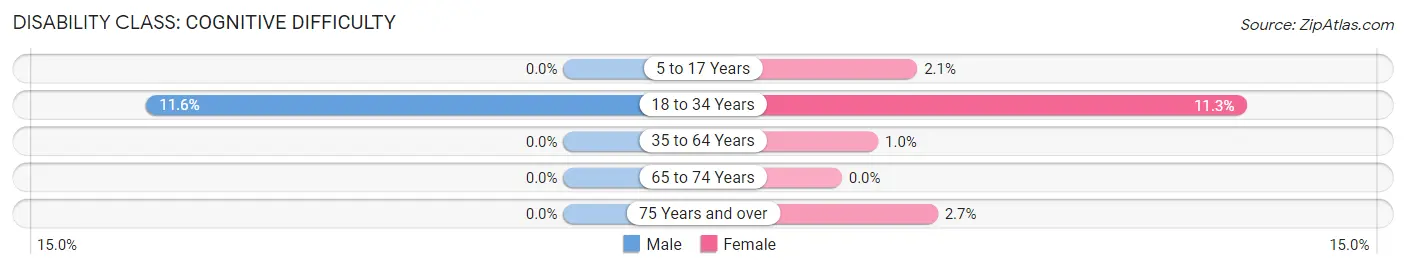
| Age Bracket | Male | Female |
| 5 to 17 Years | 0 (0.0%) | 10 (2.1%) |
| 18 to 34 Years | 36 (11.6%) | 25 (11.3%) |
| 35 to 64 Years | 0 (0.0%) | 11 (1.0%) |
| 65 to 74 Years | 0 (0.0%) | 0 (0.0%) |
| 75 Years and over | 0 (0.0%) | 10 (2.7%) |
Disability Class: Ambulatory Difficulty
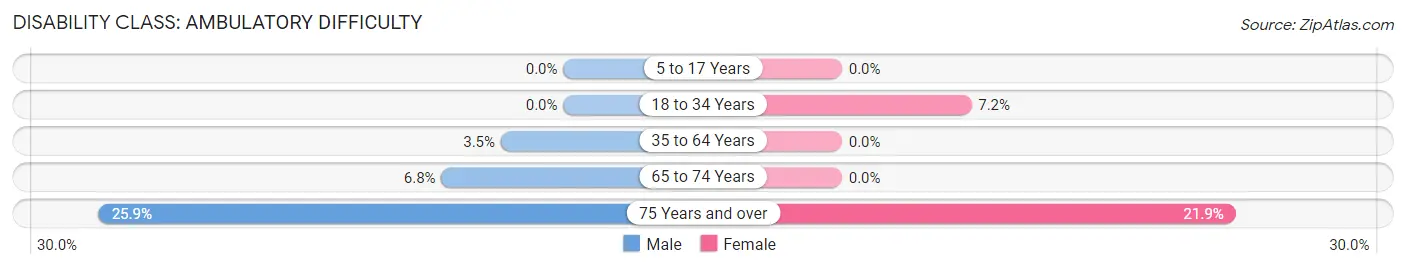
| Age Bracket | Male | Female |
| 5 to 17 Years | 0 (0.0%) | 0 (0.0%) |
| 18 to 34 Years | 0 (0.0%) | 16 (7.2%) |
| 35 to 64 Years | 38 (3.5%) | 0 (0.0%) |
| 65 to 74 Years | 11 (6.8%) | 0 (0.0%) |
| 75 Years and over | 67 (25.9%) | 82 (21.9%) |
Disability Class: Self-Care Difficulty
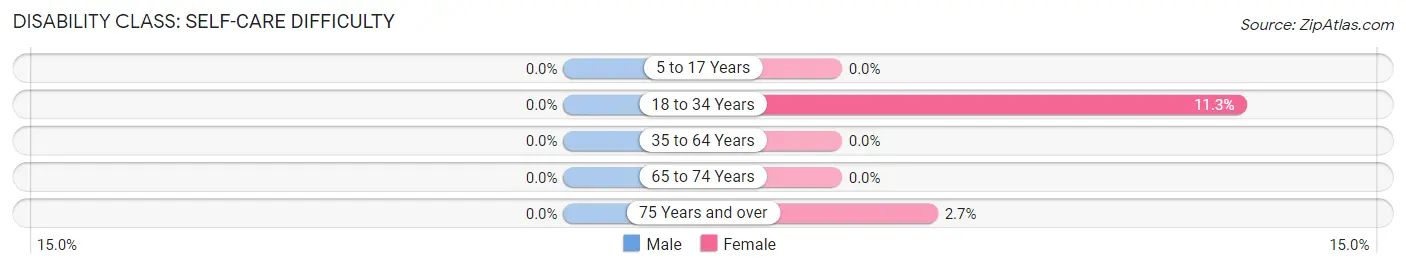
| Age Bracket | Male | Female |
| 5 to 17 Years | 0 (0.0%) | 0 (0.0%) |
| 18 to 34 Years | 0 (0.0%) | 25 (11.3%) |
| 35 to 64 Years | 0 (0.0%) | 0 (0.0%) |
| 65 to 74 Years | 0 (0.0%) | 0 (0.0%) |
| 75 Years and over | 0 (0.0%) | 10 (2.7%) |
Technology Access in Harrington Park borough
Computing Device Access in Harrington Park borough
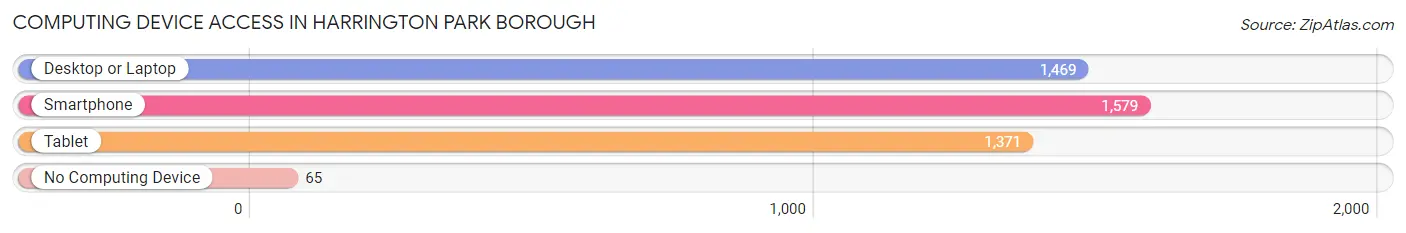
| Device Type | # Households | % Households |
| Desktop or Laptop | 1,469 | 84.6% |
| Smartphone | 1,579 | 90.9% |
| Tablet | 1,371 | 78.9% |
| No Computing Device | 65 | 3.7% |
| Total | 1,737 | 100.0% |
Internet Access in Harrington Park borough
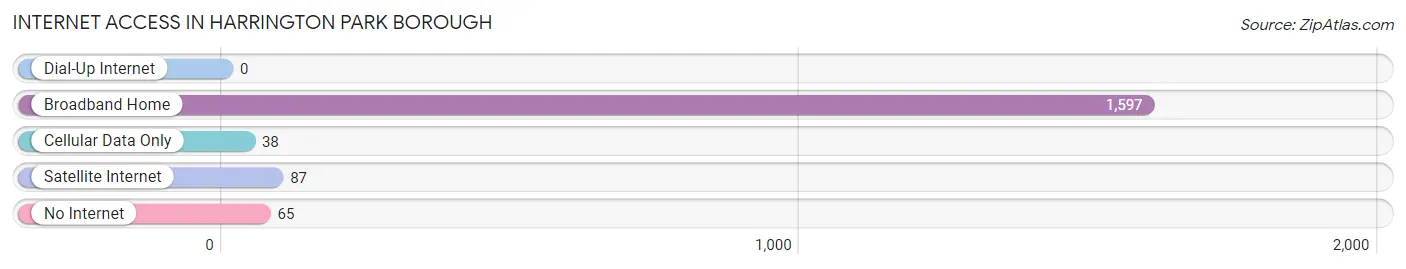
| Internet Type | # Households | % Households |
| Dial-Up Internet | 0 | 0.0% |
| Broadband Home | 1,597 | 91.9% |
| Cellular Data Only | 38 | 2.2% |
| Satellite Internet | 87 | 5.0% |
| No Internet | 65 | 3.7% |
| Total | 1,737 | 100.0% |
Harrington Park borough Summary
Harrington Park is a borough in Bergen County, New Jersey, United States. As of the 2010 United States Census, the borough's population was 4,664, reflecting an increase of 441 (+10.4%) from the 4,223 counted in the 2000 Census, which had in turn increased by 545 (+14.9%) from the 3,678 counted in the 1990 Census.
History
Harrington Park was incorporated as a borough by an act of the New Jersey Legislature on April 8, 1904, from portions of Harrington Township. The borough was named for the Harrington family, who were early settlers in the area.
Geography
Harrington Park is located at 40 57 25 North 74 02 45 West 40 956944 74 045833
According to the United States Census Bureau, the borough had a total area of 2.837 square miles (7.355 km2), including 2.835 square miles (7.350 km2) of land and 0.002 square miles (0.005 km2) of water (0.07%).
The borough is located in the northeastern part of Bergen County, bordered by the townships of Washington and Northvale to the north, Norwood to the east, Closter to the south, and Old Tappan to the west.
Demographics
As of the 2010 United States Census, there were 4,664 people, 1,619 households, and 1,323.8 families residing in the borough. The population density was 1,644.2 per square mile (634.3/km2). There were 1,664 housing units at an average density of 586.3 per square mile (226.5/km2). The racial makeup of the borough was 81.90% (3,817) White, 0.45% (21) Black or African American, 0.08% (4) Native American, 14.45% (674) Asian, 0.02% (1) Pacific Islander, 1.90% (88) from other races, and 1.20% (56) from two or more races. Hispanic or Latino of any race were 6.90% (322) of the population.
There were 1,619 households, out of which 37.2% had children under the age of 18 living with them, 68.2% were married couples living together, 7.2% had a female householder with no husband present, and 21.3% were non-families. 17.7% of all households were made up of individuals, and 8.2% had someone living alone who was 65 years of age or older. The average household size was 2.86 and the average family size was 3.26.
In the borough, the population was spread out, with 25.7% under the age of 18, 5.2% from 18 to 24, 22.2% from 25 to 44, 31.2% from 45 to 64, and 15.7% who were 65 years of age or older. The median age was 42.4 years. For every 100 females there were 93.3 males. For every 100 females ages 18 and older there were 90.2 males.
The Census Bureau's 2006-2010 American Community Survey showed that (in 2010 inflation-adjusted dollars) median household income was $128,917 (with a margin of error of +/- $14,945) and the median family income was $142,813 (+/- $14,945). Males had a median income of $100,000 (+/- $14,945) versus $68,750 (+/- $14,945) for females. The per capita income for the borough was $58,945 (+/- $14,945). About 0.7% of families and 1.3% of the population were below the poverty line, including 0.0% of those under age 18 and 0.0% of those age 65 or over.
Economy
Harrington Park is a residential community with no major industry or commercial activity. The borough's economy is largely based on the service industry, with many residents commuting to nearby towns and cities for work.
The borough is home to several small businesses, including a few restaurants, a bakery, a florist, a hair salon, and a few retail stores. There are also several professional offices located in the borough, including a law firm, an accounting firm, and a real estate office.
The borough is also home to a few small parks, including Harrington Park Lake, which is a popular spot for fishing and boating. The lake is also home to a variety of wildlife, including ducks, geese, and other waterfowl.
Conclusion
Harrington Park is a small borough located in Bergen County, New Jersey. It is a residential community with no major industry or commercial activity, and its economy is largely based on the service industry. The borough is home to several small businesses, including restaurants, a bakery, a florist, a hair salon, and a few retail stores. There are also several professional offices located in the borough, including a law firm, an accounting firm, and a real estate office. The borough is also home to a few small parks, including Harrington Park Lake, which is a popular spot for fishing and boating. The population of Harrington Park was 4,664 as of the 2010 United States Census, reflecting an increase of 441 (+10.4%) from the 4,223 counted in the 2000 Census.
Common Questions
What is Per Capita Income in Harrington Park borough?
Per Capita income in Harrington Park borough is $89,088.
What is the Median Family Income in Harrington Park borough?
Median Family Income in Harrington Park borough is $195,250.
What is the Median Household income in Harrington Park borough?
Median Household Income in Harrington Park borough is $183,138.
What is Income or Wage Gap in Harrington Park borough?
Income or Wage Gap in Harrington Park borough is 48.4%.
Women in Harrington Park borough earn 51.6 cents for every dollar earned by a man.
What is Inequality or Gini Index in Harrington Park borough?
Inequality or Gini Index in Harrington Park borough is 0.47.
What is the Total Population of Harrington Park borough?
Total Population of Harrington Park borough is 4,826.
What is the Total Male Population of Harrington Park borough?
Total Male Population of Harrington Park borough is 2,330.
What is the Total Female Population of Harrington Park borough?
Total Female Population of Harrington Park borough is 2,496.
What is the Ratio of Males per 100 Females in Harrington Park borough?
There are 93.35 Males per 100 Females in Harrington Park borough.
What is the Ratio of Females per 100 Males in Harrington Park borough?
There are 107.12 Females per 100 Males in Harrington Park borough.
What is the Median Population Age in Harrington Park borough?
Median Population Age in Harrington Park borough is 46.9 Years.
What is the Average Family Size in Harrington Park borough
Average Family Size in Harrington Park borough is 3.1 People.
What is the Average Household Size in Harrington Park borough
Average Household Size in Harrington Park borough is 2.8 People.
How Large is the Labor Force in Harrington Park borough?
There are 2,417 People in the Labor Forcein in Harrington Park borough.
What is the Percentage of People in the Labor Force in Harrington Park borough?
63.5% of People are in the Labor Force in Harrington Park borough.
What is the Unemployment Rate in Harrington Park borough?
Unemployment Rate in Harrington Park borough is 2.6%.