Cities with the Highest Percentage of Asian Population in Minnesota
RELATED REPORTS & OPTIONS
Asian
Minnesota
Compare Cities
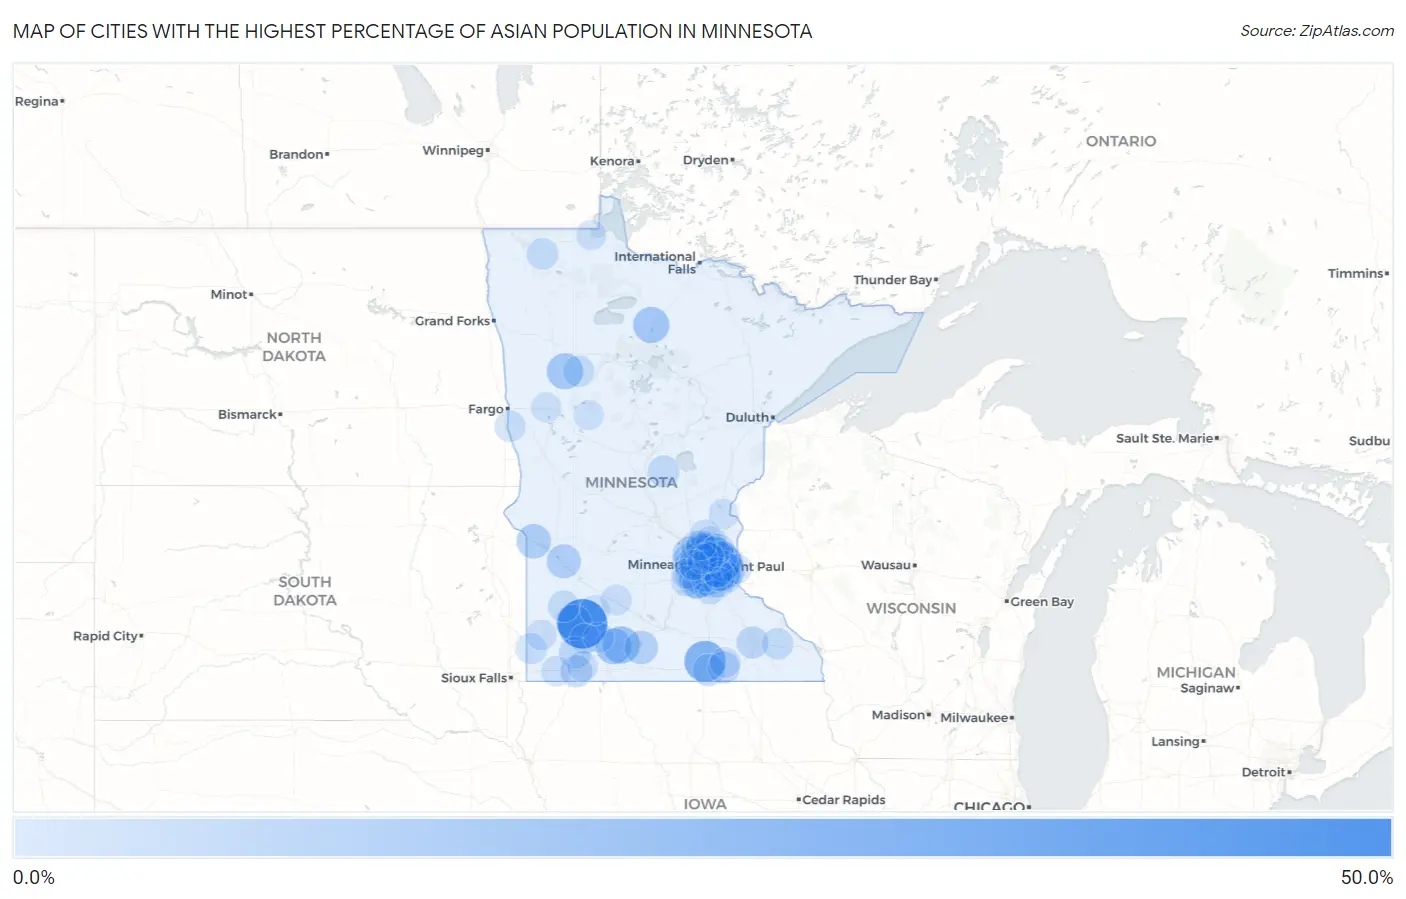
Map of Cities with the Highest Percentage of Asian Population in Minnesota
0.0%
50.0%
Cities with the Highest Percentage of Asian Population in Minnesota
| City | Asian | vs State | vs National | |
| 1. | Walnut Grove | 42.5% | 5.0%(+37.5)#1 | 5.8%(+36.7)#120 |
| 2. | Clarks Grove | 25.3% | 5.0%(+20.3)#2 | 5.8%(+19.6)#372 |
| 3. | Maplewood | 20.1% | 5.0%(+15.1)#3 | 5.8%(+14.4)#526 |
| 4. | North St Paul | 19.6% | 5.0%(+14.5)#4 | 5.8%(+13.8)#550 |
| 5. | Brooklyn Park | 19.4% | 5.0%(+14.3)#5 | 5.8%(+13.6)#562 |
| 6. | St Paul | 18.4% | 5.0%(+13.4)#6 | 5.8%(+12.6)#614 |
| 7. | Butterfield | 17.8% | 5.0%(+12.8)#7 | 5.8%(+12.1)#643 |
| 8. | Northome | 15.7% | 5.0%(+10.7)#8 | 5.8%(+9.97)#786 |
| 9. | Midway | 15.6% | 5.0%(+10.6)#9 | 5.8%(+9.85)#792 |
| 10. | Mountain Lake | 15.1% | 5.0%(+10.0)#10 | 5.8%(+9.28)#832 |
| 11. | Tracy | 14.4% | 5.0%(+9.33)#11 | 5.8%(+8.58)#869 |
| 12. | Brooklyn Center | 13.9% | 5.0%(+8.87)#12 | 5.8%(+8.12)#911 |
| 13. | Little Canada | 13.6% | 5.0%(+8.61)#13 | 5.8%(+7.86)#939 |
| 14. | Eden Prairie | 13.6% | 5.0%(+8.54)#14 | 5.8%(+7.80)#945 |
| 15. | Lauderdale | 13.4% | 5.0%(+8.38)#15 | 5.8%(+7.63)#969 |
| 16. | Oakdale | 12.7% | 5.0%(+7.64)#16 | 5.8%(+6.90)#1,036 |
| 17. | Falcon Heights | 12.7% | 5.0%(+7.63)#17 | 5.8%(+6.88)#1,039 |
| 18. | Odessa | 12.4% | 5.0%(+7.35)#18 | 5.8%(+6.60)#1,072 |
| 19. | Woodbury | 12.2% | 5.0%(+7.21)#19 | 5.8%(+6.46)#1,091 |
| 20. | Shakopee | 12.2% | 5.0%(+7.19)#20 | 5.8%(+6.44)#1,097 |
| 21. | Watson | 11.5% | 5.0%(+6.49)#21 | 5.8%(+5.75)#1,191 |
| 22. | Corcoran | 11.4% | 5.0%(+6.40)#22 | 5.8%(+5.65)#1,207 |
| 23. | Newport | 11.4% | 5.0%(+6.34)#23 | 5.8%(+5.59)#1,217 |
| 24. | Medina | 11.3% | 5.0%(+6.32)#24 | 5.8%(+5.57)#1,221 |
| 25. | Pickwick | 10.6% | 5.0%(+5.54)#25 | 5.8%(+4.79)#1,327 |
| 26. | Plymouth | 10.5% | 5.0%(+5.51)#26 | 5.8%(+4.76)#1,332 |
| 27. | Mounds View | 10.4% | 5.0%(+5.37)#27 | 5.8%(+4.62)#1,353 |
| 28. | Lewisville | 10.3% | 5.0%(+5.23)#28 | 5.8%(+4.48)#1,375 |
| 29. | Spring Lake Park | 9.9% | 5.0%(+4.84)#29 | 5.8%(+4.09)#1,441 |
| 30. | Shoreview | 9.8% | 5.0%(+4.76)#30 | 5.8%(+4.02)#1,455 |
| 31. | Blaine | 9.2% | 5.0%(+4.19)#31 | 5.8%(+3.44)#1,555 |
| 32. | Eagan | 8.9% | 5.0%(+3.85)#32 | 5.8%(+3.10)#1,630 |
| 33. | Hayward | 8.3% | 5.0%(+3.31)#33 | 5.8%(+2.56)#1,735 |
| 34. | Vadnais Heights | 8.2% | 5.0%(+3.15)#34 | 5.8%(+2.41)#1,767 |
| 35. | Roseville | 8.2% | 5.0%(+3.13)#35 | 5.8%(+2.38)#1,772 |
| 36. | Austin | 8.1% | 5.0%(+3.06)#36 | 5.8%(+2.31)#1,792 |
| 37. | Rochester | 7.8% | 5.0%(+2.77)#37 | 5.8%(+2.02)#1,858 |
| 38. | Fulda | 7.8% | 5.0%(+2.75)#38 | 5.8%(+2.00)#1,866 |
| 39. | Worthington | 7.7% | 5.0%(+2.66)#39 | 5.8%(+1.92)#1,889 |
| 40. | North Oaks | 7.6% | 5.0%(+2.62)#40 | 5.8%(+1.87)#1,899 |
| 41. | Savage | 7.5% | 5.0%(+2.44)#41 | 5.8%(+1.69)#1,943 |
| 42. | St Paul Park | 7.2% | 5.0%(+2.18)#42 | 5.8%(+1.43)#2,018 |
| 43. | Harding | 7.2% | 5.0%(+2.17)#43 | 5.8%(+1.42)#2,021 |
| 44. | Edina | 6.9% | 5.0%(+1.88)#44 | 5.8%(+1.13)#2,127 |
| 45. | Maple Grove | 6.9% | 5.0%(+1.85)#45 | 5.8%(+1.11)#2,137 |
| 46. | Chanhassen | 6.6% | 5.0%(+1.61)#46 | 5.8%(+0.865)#2,221 |
| 47. | New Brighton | 6.6% | 5.0%(+1.55)#47 | 5.8%(+0.804)#2,238 |
| 48. | Marshall | 6.6% | 5.0%(+1.55)#48 | 5.8%(+0.800)#2,239 |
| 49. | Minnetonka | 6.5% | 5.0%(+1.46)#49 | 5.8%(+0.708)#2,274 |
| 50. | Roy Lake | 6.5% | 5.0%(+1.43)#50 | 5.8%(+0.679)#2,281 |
| 51. | St Anthony City Hennepin And Ramsey Counties | 6.4% | 5.0%(+1.39)#51 | 5.8%(+0.646)#2,297 |
| 52. | Greenbush | 6.4% | 5.0%(+1.33)#52 | 5.8%(+0.579)#2,322 |
| 53. | St Charles | 6.3% | 5.0%(+1.26)#53 | 5.8%(+0.510)#2,353 |
| 54. | Orono | 6.2% | 5.0%(+1.13)#54 | 5.8%(+0.381)#2,402 |
| 55. | Burnsville | 6.1% | 5.0%(+1.10)#55 | 5.8%(+0.356)#2,415 |
| 56. | Richfield | 6.1% | 5.0%(+1.10)#56 | 5.8%(+0.354)#2,418 |
| 57. | Apple Valley | 6.1% | 5.0%(+1.08)#57 | 5.8%(+0.336)#2,423 |
| 58. | Lakeville | 6.0% | 5.0%(+0.938)#58 | 5.8%(+0.190)#2,485 |
| 59. | Bloomington | 5.8% | 5.0%(+0.794)#59 | 5.8%(+0.045)#2,557 |
| 60. | Cottage Grove | 5.8% | 5.0%(+0.763)#60 | 5.8%(+0.015)#2,569 |
| 61. | Columbia Heights | 5.8% | 5.0%(+0.745)#61 | 5.8%(-0.003)#2,577 |
| 62. | Coon Rapids | 5.7% | 5.0%(+0.689)#62 | 5.8%(-0.060)#2,602 |
| 63. | Ihlen | 5.6% | 5.0%(+0.610)#63 | 5.8%(-0.139)#2,644 |
| 64. | Franklin | 5.4% | 5.0%(+0.346)#64 | 5.8%(-0.402)#2,785 |
| 65. | Champlin | 5.4% | 5.0%(+0.334)#65 | 5.8%(-0.415)#2,794 |
| 66. | Landfall | 5.3% | 5.0%(+0.323)#66 | 5.8%(-0.425)#2,805 |
| 67. | Comstock | 5.3% | 5.0%(+0.309)#67 | 5.8%(-0.439)#2,820 |
| 68. | Hopkins | 5.2% | 5.0%(+0.223)#68 | 5.8%(-0.525)#2,858 |
| 69. | Minneapolis | 5.2% | 5.0%(+0.177)#69 | 5.8%(-0.572)#2,884 |
| 70. | Arden Hills | 5.2% | 5.0%(+0.147)#70 | 5.8%(-0.602)#2,905 |
| 71. | Dayton | 5.2% | 5.0%(+0.127)#71 | 5.8%(-0.621)#2,918 |
| 72. | St Louis Park | 5.1% | 5.0%(+0.073)#72 | 5.8%(-0.676)#2,939 |
| 73. | Oak Grove | 5.0% | 5.0%(+0.023)#73 | 5.8%(-0.726)#2,966 |
| 74. | Ham Lake | 4.9% | 5.0%(-0.106)#74 | 5.8%(-0.854)#3,034 |
| 75. | Holland | 4.7% | 5.0%(-0.331)#75 | 5.8%(-1.08)#3,166 |
| 76. | Westbrook | 4.7% | 5.0%(-0.337)#76 | 5.8%(-1.09)#3,171 |
| 77. | White Bear Lake | 4.6% | 5.0%(-0.439)#77 | 5.8%(-1.19)#3,238 |
| 78. | Fridley | 4.6% | 5.0%(-0.453)#78 | 5.8%(-1.20)#3,246 |
| 79. | Brewster | 4.5% | 5.0%(-0.547)#79 | 5.8%(-1.29)#3,322 |
| 80. | Carver | 4.4% | 5.0%(-0.604)#80 | 5.8%(-1.35)#3,364 |
| 81. | Lansing | 4.4% | 5.0%(-0.622)#81 | 5.8%(-1.37)#3,372 |
| 82. | Adrian | 4.4% | 5.0%(-0.640)#82 | 5.8%(-1.39)#3,383 |
| 83. | Lino Lakes | 4.4% | 5.0%(-0.657)#83 | 5.8%(-1.41)#3,396 |
| 84. | Lake St Croix Beach | 4.3% | 5.0%(-0.684)#84 | 5.8%(-1.43)#3,411 |
| 85. | Rosemount | 4.3% | 5.0%(-0.700)#85 | 5.8%(-1.45)#3,420 |
| 86. | Jeffers | 4.3% | 5.0%(-0.703)#86 | 5.8%(-1.45)#3,424 |
| 87. | Victoria | 4.3% | 5.0%(-0.718)#87 | 5.8%(-1.47)#3,440 |
| 88. | Circle Pines | 4.3% | 5.0%(-0.721)#88 | 5.8%(-1.47)#3,444 |
| 89. | Prior Lake | 4.3% | 5.0%(-0.739)#89 | 5.8%(-1.49)#3,460 |
| 90. | Inver Grove Heights | 4.3% | 5.0%(-0.766)#90 | 5.8%(-1.51)#3,490 |
| 91. | Warroad | 4.2% | 5.0%(-0.785)#91 | 5.8%(-1.53)#3,505 |
| 92. | Sunfish Lake | 4.2% | 5.0%(-0.865)#92 | 5.8%(-1.61)#3,569 |
| 93. | Harris | 4.1% | 5.0%(-0.912)#93 | 5.8%(-1.66)#3,601 |
| 94. | Wolf Lake | 4.1% | 5.0%(-0.915)#94 | 5.8%(-1.66)#3,606 |
| 95. | Hilltop | 4.1% | 5.0%(-0.945)#95 | 5.8%(-1.69)#3,628 |
| 96. | Crystal | 4.1% | 5.0%(-0.955)#96 | 5.8%(-1.70)#3,634 |
| 97. | Anoka | 4.0% | 5.0%(-0.995)#97 | 5.8%(-1.74)#3,666 |
| 98. | Wabasso | 4.0% | 5.0%(-1.00)#98 | 5.8%(-1.75)#3,672 |
| 99. | Lake Park | 4.0% | 5.0%(-1.04)#99 | 5.8%(-1.79)#3,705 |
| 100. | Wayzata | 4.0% | 5.0%(-1.04)#100 | 5.8%(-1.79)#3,706 |
Common Questions
What are the Top 10 Cities with the Highest Percentage of Asian Population in Minnesota?
Top 10 Cities with the Highest Percentage of Asian Population in Minnesota are:
#1
42.5%
#2
25.3%
#3
20.1%
#4
19.6%
#5
19.4%
#6
18.4%
#7
17.8%
#8
15.7%
#9
15.6%
#10
15.1%
What city has the Highest Percentage of Asian Population in Minnesota?
Walnut Grove has the Highest Percentage of Asian Population in Minnesota with 42.5%.
What is the Percentage of Asian Population in the State of Minnesota?
Percentage of Asian Population in Minnesota is 5.0%.
What is the Percentage of Asian Population in the United States?
Percentage of Asian Population in the United States is 5.8%.