Cities with the Highest Percentage of Asian Population in Pennsylvania
RELATED REPORTS & OPTIONS
Asian
Pennsylvania
Compare Cities
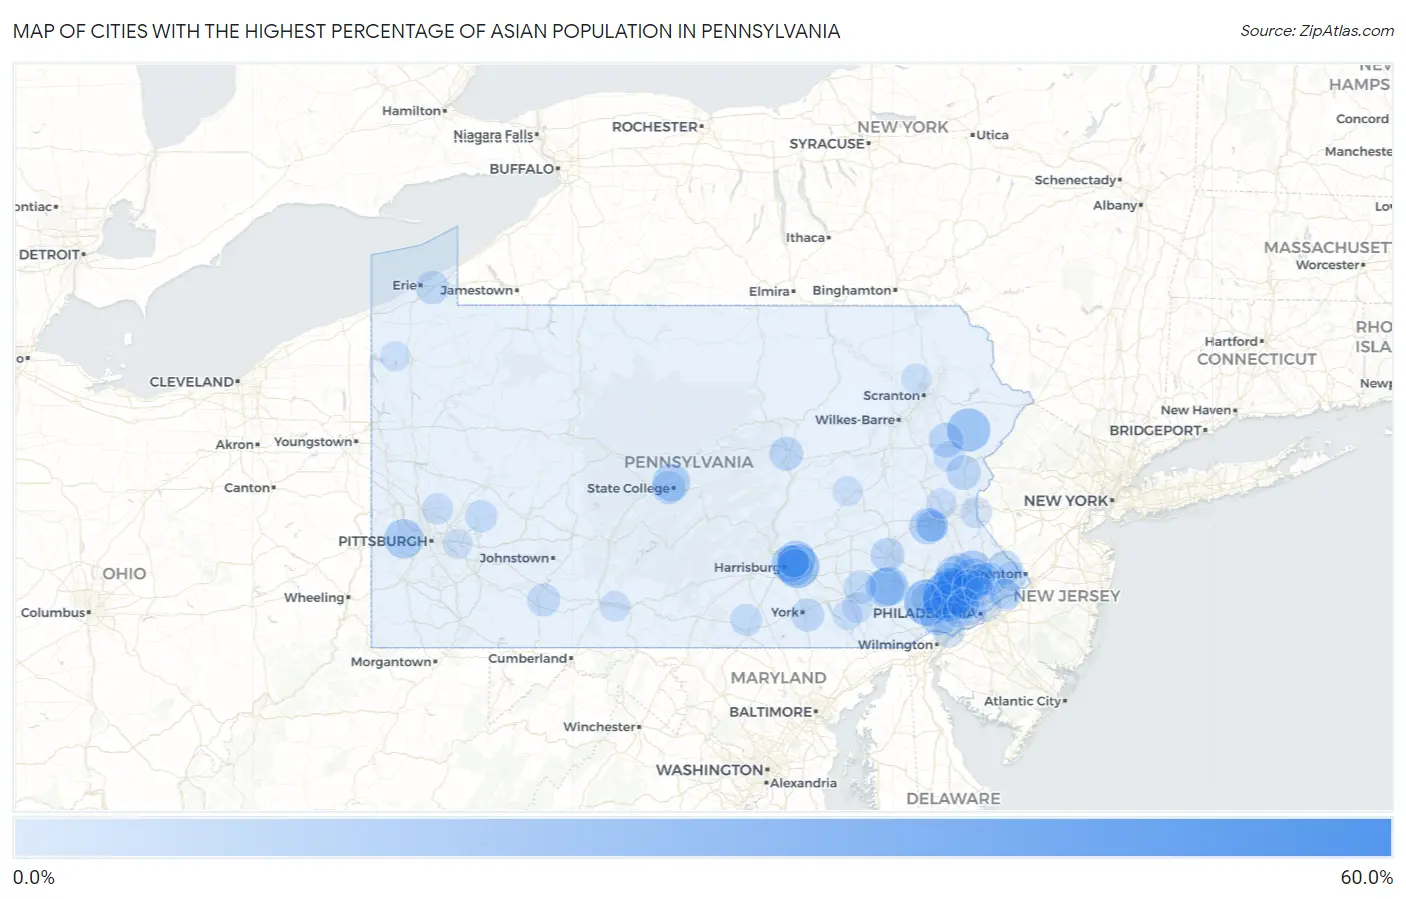
Map of Cities with the Highest Percentage of Asian Population in Pennsylvania
0.0%
60.0%
Cities with the Highest Percentage of Asian Population in Pennsylvania
| City | Asian | vs State | vs National | |
| 1. | Millbourne Borough | 58.4% | 3.6%(+54.7)#1 | 5.8%(+52.6)#39 |
| 2. | Morgan Hill | 35.0% | 3.6%(+31.4)#2 | 5.8%(+29.3)#194 |
| 3. | Frazer | 34.4% | 3.6%(+30.7)#3 | 5.8%(+28.6)#205 |
| 4. | Chesterbrook | 31.8% | 3.6%(+28.2)#4 | 5.8%(+26.0)#239 |
| 5. | Exton | 27.9% | 3.6%(+24.3)#5 | 5.8%(+22.1)#308 |
| 6. | Hatfield Borough | 26.2% | 3.6%(+22.6)#6 | 5.8%(+20.4)#349 |
| 7. | Rutherford | 24.3% | 3.6%(+20.6)#7 | 5.8%(+18.5)#403 |
| 8. | Mountainhome | 23.5% | 3.6%(+19.9)#8 | 5.8%(+17.8)#417 |
| 9. | King Of Prussia | 23.5% | 3.6%(+19.8)#9 | 5.8%(+17.7)#418 |
| 10. | Spring House | 20.0% | 3.6%(+16.4)#10 | 5.8%(+14.3)#532 |
| 11. | Enlow | 18.6% | 3.6%(+14.9)#11 | 5.8%(+12.8)#603 |
| 12. | Audubon | 18.3% | 3.6%(+14.7)#12 | 5.8%(+12.6)#617 |
| 13. | Paoli | 18.3% | 3.6%(+14.7)#13 | 5.8%(+12.6)#619 |
| 14. | Montgomeryville | 18.2% | 3.6%(+14.6)#14 | 5.8%(+12.4)#620 |
| 15. | Goodville | 17.8% | 3.6%(+14.2)#15 | 5.8%(+12.0)#649 |
| 16. | Paxtonia | 17.7% | 3.6%(+14.1)#16 | 5.8%(+11.9)#653 |
| 17. | Churchtown | 17.7% | 3.6%(+14.1)#17 | 5.8%(+11.9)#654 |
| 18. | Cheyney University | 17.1% | 3.6%(+13.5)#18 | 5.8%(+11.3)#694 |
| 19. | Toftrees | 16.0% | 3.6%(+12.4)#19 | 5.8%(+10.3)#762 |
| 20. | Lansdale Borough | 15.8% | 3.6%(+12.2)#20 | 5.8%(+10.0)#778 |
| 21. | Progress | 15.8% | 3.6%(+12.1)#21 | 5.8%(+9.99)#783 |
| 22. | Lawnton | 15.1% | 3.6%(+11.5)#22 | 5.8%(+9.37)#827 |
| 23. | Breinigsville | 14.5% | 3.6%(+10.9)#23 | 5.8%(+8.73)#858 |
| 24. | Franklin Park Borough | 14.4% | 3.6%(+10.8)#24 | 5.8%(+8.63)#866 |
| 25. | Aspinwall Borough | 13.9% | 3.6%(+10.3)#25 | 5.8%(+8.14)#909 |
| 26. | Whitehall Borough | 13.4% | 3.6%(+9.80)#26 | 5.8%(+7.67)#963 |
| 27. | Skippack | 13.2% | 3.6%(+9.51)#27 | 5.8%(+7.38)#1,001 |
| 28. | Pocono Pines | 12.7% | 3.6%(+9.05)#28 | 5.8%(+6.92)#1,033 |
| 29. | Malvern Borough | 12.6% | 3.6%(+8.96)#29 | 5.8%(+6.83)#1,047 |
| 30. | Rutledge Borough | 12.2% | 3.6%(+8.58)#30 | 5.8%(+6.45)#1,094 |
| 31. | Dilworthtown | 12.2% | 3.6%(+8.53)#31 | 5.8%(+6.40)#1,102 |
| 32. | Saylorsburg | 12.1% | 3.6%(+8.43)#32 | 5.8%(+6.30)#1,112 |
| 33. | Berwyn | 11.8% | 3.6%(+8.19)#33 | 5.8%(+6.07)#1,142 |
| 34. | Penn Wynne | 11.8% | 3.6%(+8.19)#34 | 5.8%(+6.06)#1,143 |
| 35. | Colony Park | 11.6% | 3.6%(+7.95)#35 | 5.8%(+5.82)#1,172 |
| 36. | Newtown Grant | 11.5% | 3.6%(+7.88)#36 | 5.8%(+5.75)#1,190 |
| 37. | West Milton | 11.4% | 3.6%(+7.77)#37 | 5.8%(+5.64)#1,208 |
| 38. | Trooper | 11.2% | 3.6%(+7.58)#38 | 5.8%(+5.45)#1,235 |
| 39. | Park Forest Village | 11.2% | 3.6%(+7.56)#39 | 5.8%(+5.43)#1,242 |
| 40. | Penn State Erie Behrend | 11.1% | 3.6%(+7.44)#40 | 5.8%(+5.31)#1,254 |
| 41. | Kulpsville | 10.8% | 3.6%(+7.15)#41 | 5.8%(+5.02)#1,295 |
| 42. | Rosemont | 10.7% | 3.6%(+7.08)#42 | 5.8%(+4.95)#1,305 |
| 43. | Queens Gate | 10.6% | 3.6%(+6.98)#43 | 5.8%(+4.85)#1,324 |
| 44. | Trexlertown | 10.6% | 3.6%(+6.91)#44 | 5.8%(+4.78)#1,328 |
| 45. | Paxtang Borough | 10.5% | 3.6%(+6.83)#45 | 5.8%(+4.70)#1,338 |
| 46. | Friedens | 10.4% | 3.6%(+6.77)#46 | 5.8%(+4.64)#1,349 |
| 47. | St. Davids | 10.4% | 3.6%(+6.71)#47 | 5.8%(+4.58)#1,356 |
| 48. | Brownstown | 10.1% | 3.6%(+6.49)#48 | 5.8%(+4.36)#1,386 |
| 49. | State College Borough | 10.1% | 3.6%(+6.44)#49 | 5.8%(+4.31)#1,396 |
| 50. | Warminster Heights | 10.0% | 3.6%(+6.40)#50 | 5.8%(+4.27)#1,408 |
| 51. | Broomall | 9.7% | 3.6%(+6.07)#51 | 5.8%(+3.94)#1,467 |
| 52. | Evansburg | 9.7% | 3.6%(+6.07)#52 | 5.8%(+3.94)#1,468 |
| 53. | Boothwyn | 9.6% | 3.6%(+5.98)#53 | 5.8%(+3.85)#1,489 |
| 54. | Villanova | 9.6% | 3.6%(+5.94)#54 | 5.8%(+3.81)#1,497 |
| 55. | Eagle | 9.5% | 3.6%(+5.83)#55 | 5.8%(+3.70)#1,508 |
| 56. | Eagleville Cdp Montgomery County | 9.5% | 3.6%(+5.81)#56 | 5.8%(+3.68)#1,512 |
| 57. | Colonial Park | 9.4% | 3.6%(+5.75)#57 | 5.8%(+3.62)#1,526 |
| 58. | Horsham | 9.3% | 3.6%(+5.70)#58 | 5.8%(+3.58)#1,531 |
| 59. | Cornwells Heights | 9.3% | 3.6%(+5.69)#59 | 5.8%(+3.56)#1,536 |
| 60. | Georgetown Cdp Lancaster County | 9.3% | 3.6%(+5.67)#60 | 5.8%(+3.54)#1,538 |
| 61. | Maple Glen | 9.3% | 3.6%(+5.64)#61 | 5.8%(+3.51)#1,545 |
| 62. | Blawnox Borough | 9.3% | 3.6%(+5.63)#62 | 5.8%(+3.50)#1,546 |
| 63. | West Reading Borough | 9.3% | 3.6%(+5.62)#63 | 5.8%(+3.49)#1,547 |
| 64. | Hopewell Borough | 9.2% | 3.6%(+5.51)#64 | 5.8%(+3.38)#1,568 |
| 65. | Clarks Green Borough | 9.1% | 3.6%(+5.45)#65 | 5.8%(+3.32)#1,579 |
| 66. | North Vandergrift | 9.1% | 3.6%(+5.45)#66 | 5.8%(+3.32)#1,582 |
| 67. | Table Rock | 9.0% | 3.6%(+5.36)#67 | 5.8%(+3.23)#1,603 |
| 68. | Plymouth Meeting | 8.6% | 3.6%(+4.96)#68 | 5.8%(+2.83)#1,678 |
| 69. | Raubsville | 8.6% | 3.6%(+4.96)#69 | 5.8%(+2.83)#1,679 |
| 70. | Ancient Oaks | 8.6% | 3.6%(+4.95)#70 | 5.8%(+2.82)#1,680 |
| 71. | Haverford College | 8.3% | 3.6%(+4.63)#71 | 5.8%(+2.50)#1,748 |
| 72. | Baldwin Borough | 8.2% | 3.6%(+4.56)#72 | 5.8%(+2.43)#1,761 |
| 73. | Blue Bell | 8.2% | 3.6%(+4.56)#73 | 5.8%(+2.43)#1,764 |
| 74. | Sinking Spring Borough | 8.1% | 3.6%(+4.50)#74 | 5.8%(+2.37)#1,779 |
| 75. | Bakerstown | 7.9% | 3.6%(+4.30)#75 | 5.8%(+2.17)#1,825 |
| 76. | Matamoras Borough | 7.9% | 3.6%(+4.29)#76 | 5.8%(+2.16)#1,829 |
| 77. | Bryn Mawr | 7.9% | 3.6%(+4.25)#77 | 5.8%(+2.12)#1,836 |
| 78. | Narberth Borough | 7.7% | 3.6%(+4.06)#78 | 5.8%(+1.93)#1,882 |
| 79. | Swarthmore Borough | 7.7% | 3.6%(+4.03)#79 | 5.8%(+1.90)#1,892 |
| 80. | Lionville | 7.7% | 3.6%(+4.02)#80 | 5.8%(+1.89)#1,895 |
| 81. | Sierra View | 7.6% | 3.6%(+3.98)#81 | 5.8%(+1.85)#1,909 |
| 82. | Philadelphia | 7.6% | 3.6%(+3.95)#82 | 5.8%(+1.83)#1,911 |
| 83. | Wormleysburg Borough | 7.5% | 3.6%(+3.87)#83 | 5.8%(+1.74)#1,931 |
| 84. | Penn Farms | 7.5% | 3.6%(+3.84)#84 | 5.8%(+1.71)#1,939 |
| 85. | Lampeter | 7.4% | 3.6%(+3.73)#85 | 5.8%(+1.60)#1,975 |
| 86. | East Lansdowne Borough | 7.3% | 3.6%(+3.68)#86 | 5.8%(+1.55)#1,984 |
| 87. | Downingtown Borough | 7.3% | 3.6%(+3.68)#87 | 5.8%(+1.55)#1,985 |
| 88. | Arcadia University | 7.3% | 3.6%(+3.65)#88 | 5.8%(+1.52)#1,992 |
| 89. | Earlston | 7.2% | 3.6%(+3.57)#89 | 5.8%(+1.44)#2,016 |
| 90. | Cementon | 7.2% | 3.6%(+3.54)#90 | 5.8%(+1.41)#2,028 |
| 91. | Conestoga | 7.0% | 3.6%(+3.36)#91 | 5.8%(+1.23)#2,086 |
| 92. | Glenburn | 6.9% | 3.6%(+3.28)#92 | 5.8%(+1.15)#2,121 |
| 93. | Fox Chapel Borough | 6.9% | 3.6%(+3.26)#93 | 5.8%(+1.13)#2,126 |
| 94. | Fountain Springs | 6.9% | 3.6%(+3.25)#94 | 5.8%(+1.12)#2,129 |
| 95. | Eddington | 6.8% | 3.6%(+3.14)#95 | 5.8%(+1.01)#2,173 |
| 96. | Bala Cynwyd | 6.8% | 3.6%(+3.11)#96 | 5.8%(+0.979)#2,178 |
| 97. | Monroeville | 6.7% | 3.6%(+3.09)#97 | 5.8%(+0.960)#2,183 |
| 98. | Fort Washington | 6.6% | 3.6%(+2.96)#98 | 5.8%(+0.834)#2,231 |
| 99. | Woodbourne | 6.6% | 3.6%(+2.93)#99 | 5.8%(+0.798)#2,240 |
| 100. | Harmonsburg | 6.6% | 3.6%(+2.91)#100 | 5.8%(+0.785)#2,243 |
Common Questions
What are the Top 10 Cities with the Highest Percentage of Asian Population in Pennsylvania?
Top 10 Cities with the Highest Percentage of Asian Population in Pennsylvania are:
#1
31.8%
#2
27.9%
#3
24.3%
#4
23.5%
#5
23.5%
#6
20.0%
#7
18.6%
#8
18.3%
#9
18.3%
#10
18.2%
What city has the Highest Percentage of Asian Population in Pennsylvania?
Chesterbrook has the Highest Percentage of Asian Population in Pennsylvania with 31.8%.
What is the Percentage of Asian Population in the State of Pennsylvania?
Percentage of Asian Population in Pennsylvania is 3.6%.
What is the Percentage of Asian Population in the United States?
Percentage of Asian Population in the United States is 5.8%.