Cities with the Highest Percentage of Asian Population in Virginia
RELATED REPORTS & OPTIONS
Asian
Virginia
Compare Cities
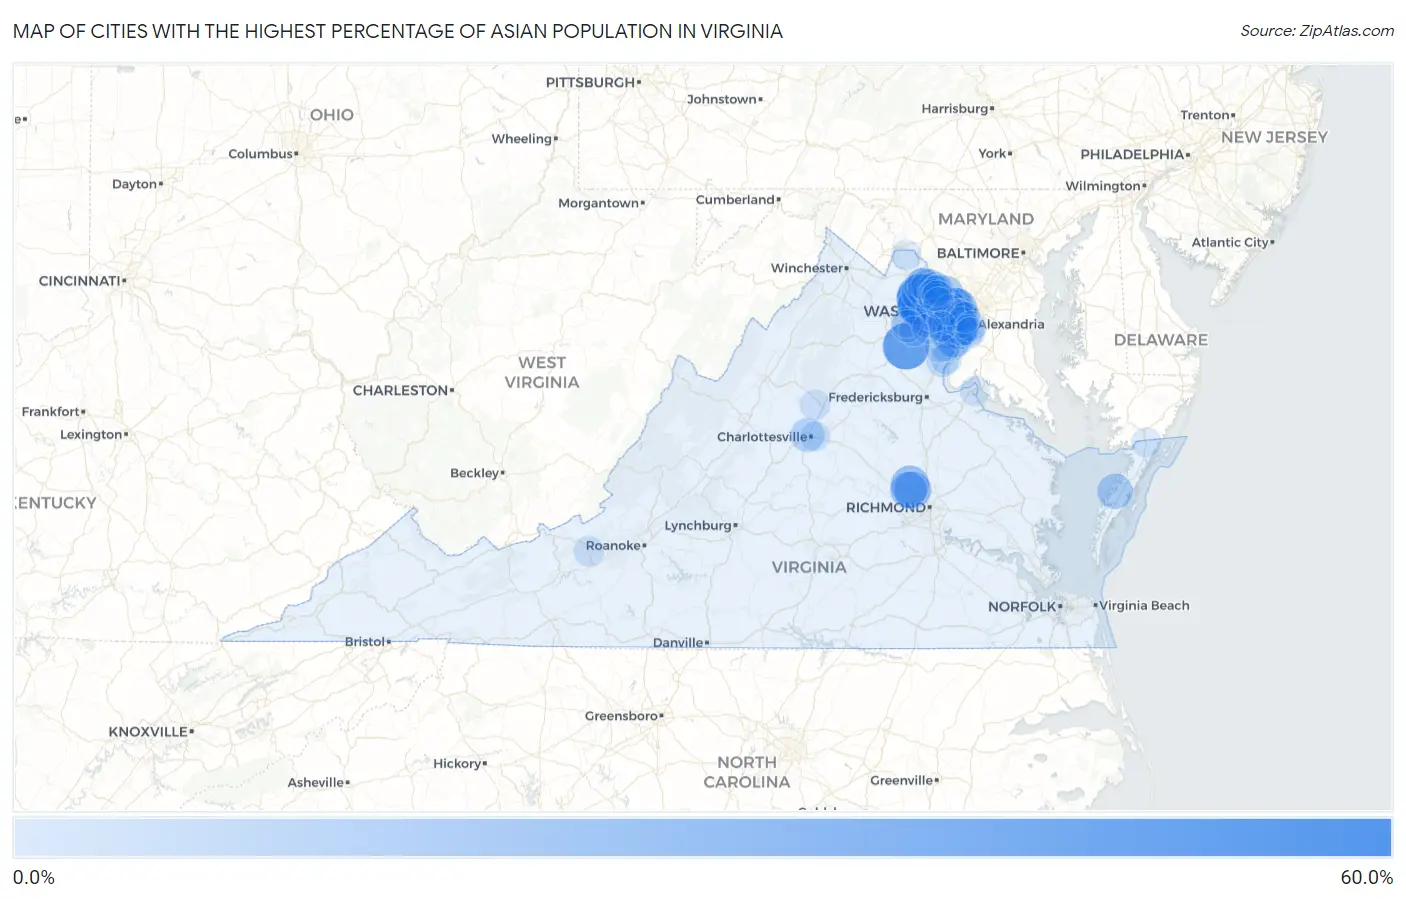
Map of Cities with the Highest Percentage of Asian Population in Virginia
0.0%
60.0%
Cities with the Highest Percentage of Asian Population in Virginia
| City | Asian | vs State | vs National | |
| 1. | Sully Square | 58.1% | 6.9%(+51.2)#1 | 5.8%(+52.3)#40 |
| 2. | Loudoun Valley Estates | 55.9% | 6.9%(+49.0)#2 | 5.8%(+50.1)#45 |
| 3. | Navy | 50.6% | 6.9%(+43.7)#3 | 5.8%(+44.8)#75 |
| 4. | Catlett | 48.9% | 6.9%(+42.1)#4 | 5.8%(+43.2)#81 |
| 5. | Goose Creek | 41.4% | 6.9%(+34.5)#5 | 5.8%(+35.6)#132 |
| 6. | Brambleton | 40.8% | 6.9%(+33.9)#6 | 5.8%(+35.0)#134 |
| 7. | Chantilly | 40.2% | 6.9%(+33.4)#7 | 5.8%(+34.5)#140 |
| 8. | Union Mill | 39.1% | 6.9%(+32.3)#8 | 5.8%(+33.4)#151 |
| 9. | Moorefield | 38.9% | 6.9%(+32.0)#9 | 5.8%(+33.1)#154 |
| 10. | Fair Lakes | 38.9% | 6.9%(+32.0)#10 | 5.8%(+33.1)#155 |
| 11. | Oak Grove | 38.6% | 6.9%(+31.8)#11 | 5.8%(+32.9)#158 |
| 12. | Floris | 38.3% | 6.9%(+31.5)#12 | 5.8%(+32.6)#162 |
| 13. | North Springfield | 38.3% | 6.9%(+31.4)#13 | 5.8%(+32.5)#164 |
| 14. | Arcola | 37.8% | 6.9%(+30.9)#14 | 5.8%(+32.0)#172 |
| 15. | Mcnair | 37.2% | 6.9%(+30.3)#15 | 5.8%(+31.4)#177 |
| 16. | Pimmit Hills | 36.0% | 6.9%(+29.2)#16 | 5.8%(+30.3)#186 |
| 17. | South Riding | 34.6% | 6.9%(+27.8)#17 | 5.8%(+28.9)#203 |
| 18. | Merrifield | 32.8% | 6.9%(+25.9)#18 | 5.8%(+27.0)#229 |
| 19. | Springfield | 30.3% | 6.9%(+23.5)#19 | 5.8%(+24.5)#266 |
| 20. | Woodburn | 30.1% | 6.9%(+23.2)#20 | 5.8%(+24.3)#272 |
| 21. | Wyndham | 30.0% | 6.9%(+23.1)#21 | 5.8%(+24.2)#275 |
| 22. | Tysons | 29.9% | 6.9%(+23.1)#22 | 5.8%(+24.1)#277 |
| 23. | Centreville | 29.3% | 6.9%(+22.5)#23 | 5.8%(+23.5)#290 |
| 24. | Fair Oaks | 27.6% | 6.9%(+20.7)#24 | 5.8%(+21.8)#315 |
| 25. | Innsbrook | 27.5% | 6.9%(+20.7)#25 | 5.8%(+21.7)#319 |
| 26. | Stone Ridge | 27.4% | 6.9%(+20.5)#26 | 5.8%(+21.6)#323 |
| 27. | Short Pump | 26.3% | 6.9%(+19.5)#27 | 5.8%(+20.5)#342 |
| 28. | Broadlands | 26.3% | 6.9%(+19.5)#28 | 5.8%(+20.5)#343 |
| 29. | Ravensworth | 26.2% | 6.9%(+19.3)#29 | 5.8%(+20.4)#350 |
| 30. | Laurel Hill | 25.3% | 6.9%(+18.4)#30 | 5.8%(+19.5)#374 |
| 31. | Great Falls Crossing | 24.9% | 6.9%(+18.0)#31 | 5.8%(+19.1)#385 |
| 32. | Great Falls | 24.7% | 6.9%(+17.9)#32 | 5.8%(+18.9)#388 |
| 33. | Greenbriar | 24.6% | 6.9%(+17.8)#33 | 5.8%(+18.8)#391 |
| 34. | Belmont | 24.4% | 6.9%(+17.6)#34 | 5.8%(+18.6)#396 |
| 35. | Dunn Loring | 23.9% | 6.9%(+17.1)#35 | 5.8%(+18.1)#412 |
| 36. | Oakton | 23.7% | 6.9%(+16.8)#36 | 5.8%(+17.9)#416 |
| 37. | Annandale | 23.4% | 6.9%(+16.6)#37 | 5.8%(+17.7)#419 |
| 38. | South Run | 22.8% | 6.9%(+15.9)#38 | 5.8%(+17.0)#431 |
| 39. | Bobtown | 22.4% | 6.9%(+15.6)#39 | 5.8%(+16.7)#446 |
| 40. | Idylwood | 22.3% | 6.9%(+15.5)#40 | 5.8%(+16.6)#451 |
| 41. | Franklin Farm | 22.3% | 6.9%(+15.4)#41 | 5.8%(+16.5)#454 |
| 42. | Dulles Town Center | 21.4% | 6.9%(+14.5)#42 | 5.8%(+15.6)#477 |
| 43. | Lorton | 21.1% | 6.9%(+14.2)#43 | 5.8%(+15.3)#488 |
| 44. | Ashburn | 21.0% | 6.9%(+14.2)#44 | 5.8%(+15.3)#490 |
| 45. | University Center | 20.9% | 6.9%(+14.1)#45 | 5.8%(+15.1)#495 |
| 46. | Kings Park West | 20.9% | 6.9%(+14.0)#46 | 5.8%(+15.1)#499 |
| 47. | Mclean | 20.3% | 6.9%(+13.4)#47 | 5.8%(+14.5)#518 |
| 48. | Kings Park | 20.2% | 6.9%(+13.4)#48 | 5.8%(+14.5)#519 |
| 49. | Franconia | 20.0% | 6.9%(+13.2)#49 | 5.8%(+14.3)#531 |
| 50. | Braddock | 19.8% | 6.9%(+12.9)#50 | 5.8%(+14.0)#541 |
| 51. | University Of Virginia | 19.3% | 6.9%(+12.5)#51 | 5.8%(+13.6)#564 |
| 52. | Cascades | 19.2% | 6.9%(+12.3)#52 | 5.8%(+13.4)#575 |
| 53. | Wolf Trap | 18.6% | 6.9%(+11.7)#53 | 5.8%(+12.8)#605 |
| 54. | Long Branch | 17.6% | 6.9%(+10.7)#54 | 5.8%(+11.8)#663 |
| 55. | Fairfax | 17.4% | 6.9%(+10.6)#55 | 5.8%(+11.7)#674 |
| 56. | Burke Centre | 17.3% | 6.9%(+10.5)#56 | 5.8%(+11.6)#683 |
| 57. | Seven Corners | 17.3% | 6.9%(+10.4)#57 | 5.8%(+11.5)#686 |
| 58. | Burke | 16.6% | 6.9%(+9.78)#58 | 5.8%(+10.9)#726 |
| 59. | Mantua | 16.1% | 6.9%(+9.28)#59 | 5.8%(+10.4)#754 |
| 60. | Herndon | 16.0% | 6.9%(+9.14)#60 | 5.8%(+10.2)#765 |
| 61. | Gainesville | 15.7% | 6.9%(+8.89)#61 | 5.8%(+9.97)#785 |
| 62. | West Springfield | 15.7% | 6.9%(+8.87)#62 | 5.8%(+9.96)#788 |
| 63. | Newington Forest | 15.6% | 6.9%(+8.72)#63 | 5.8%(+9.80)#794 |
| 64. | Lansdowne | 15.6% | 6.9%(+8.70)#64 | 5.8%(+9.78)#795 |
| 65. | Kincora | 15.5% | 6.9%(+8.60)#65 | 5.8%(+9.68)#804 |
| 66. | Newington | 15.4% | 6.9%(+8.50)#66 | 5.8%(+9.58)#810 |
| 67. | West Falls Church | 15.2% | 6.9%(+8.39)#67 | 5.8%(+9.47)#816 |
| 68. | Sterling | 15.2% | 6.9%(+8.39)#68 | 5.8%(+9.47)#817 |
| 69. | George Mason | 14.6% | 6.9%(+7.71)#69 | 5.8%(+8.79)#856 |
| 70. | Triangle | 14.1% | 6.9%(+7.21)#70 | 5.8%(+8.29)#894 |
| 71. | Sugarland Run | 14.0% | 6.9%(+7.12)#71 | 5.8%(+8.20)#899 |
| 72. | Lake Barcroft | 13.9% | 6.9%(+7.08)#72 | 5.8%(+8.16)#902 |
| 73. | Lowes Island | 13.8% | 6.9%(+6.99)#73 | 5.8%(+8.07)#917 |
| 74. | Hutchison | 13.8% | 6.9%(+6.94)#74 | 5.8%(+8.02)#921 |
| 75. | Kingstowne | 13.7% | 6.9%(+6.85)#75 | 5.8%(+7.93)#932 |
| 76. | Lincolnia | 13.4% | 6.9%(+6.54)#76 | 5.8%(+7.62)#971 |
| 77. | Vienna | 13.3% | 6.9%(+6.49)#77 | 5.8%(+7.57)#977 |
| 78. | Groveton | 13.2% | 6.9%(+6.35)#78 | 5.8%(+7.43)#997 |
| 79. | Dranesville | 12.9% | 6.9%(+6.08)#79 | 5.8%(+7.16)#1,018 |
| 80. | Cherry Hill | 12.8% | 6.9%(+5.98)#80 | 5.8%(+7.06)#1,024 |
| 81. | One Loudoun | 12.8% | 6.9%(+5.96)#81 | 5.8%(+7.04)#1,025 |
| 82. | Bailey S Crossroads | 12.7% | 6.9%(+5.85)#82 | 5.8%(+6.93)#1,031 |
| 83. | Rose Hill Cdp Fairfax County | 12.2% | 6.9%(+5.39)#83 | 5.8%(+6.47)#1,087 |
| 84. | Difficult Run | 12.0% | 6.9%(+5.11)#84 | 5.8%(+6.19)#1,125 |
| 85. | Potomac Mills | 12.0% | 6.9%(+5.10)#85 | 5.8%(+6.18)#1,129 |
| 86. | Leesylvania | 11.8% | 6.9%(+4.96)#86 | 5.8%(+6.04)#1,148 |
| 87. | Blacksburg | 11.7% | 6.9%(+4.81)#87 | 5.8%(+5.90)#1,163 |
| 88. | Reston | 11.7% | 6.9%(+4.80)#88 | 5.8%(+5.88)#1,166 |
| 89. | Haymarket | 11.5% | 6.9%(+4.66)#89 | 5.8%(+5.74)#1,192 |
| 90. | Twin Lakes | 11.5% | 6.9%(+4.65)#90 | 5.8%(+5.73)#1,193 |
| 91. | Fairfax Station | 11.4% | 6.9%(+4.54)#91 | 5.8%(+5.62)#1,211 |
| 92. | Dale City | 11.3% | 6.9%(+4.49)#92 | 5.8%(+5.57)#1,220 |
| 93. | Huntington | 11.2% | 6.9%(+4.34)#93 | 5.8%(+5.42)#1,243 |
| 94. | Hybla Valley | 11.1% | 6.9%(+4.21)#94 | 5.8%(+5.29)#1,257 |
| 95. | Manassas Park | 11.0% | 6.9%(+4.18)#95 | 5.8%(+5.27)#1,261 |
| 96. | Pantops | 10.7% | 6.9%(+3.89)#96 | 5.8%(+4.97)#1,301 |
| 97. | Lovettsville | 10.7% | 6.9%(+3.84)#97 | 5.8%(+4.92)#1,310 |
| 98. | New Church | 10.7% | 6.9%(+3.82)#98 | 5.8%(+4.91)#1,313 |
| 99. | Dahlgren Center | 10.7% | 6.9%(+3.80)#99 | 5.8%(+4.88)#1,321 |
| 100. | Linton Hall | 10.6% | 6.9%(+3.72)#100 | 5.8%(+4.80)#1,326 |
Common Questions
What are the Top 10 Cities with the Highest Percentage of Asian Population in Virginia?
Top 10 Cities with the Highest Percentage of Asian Population in Virginia are:
#1
55.9%
#2
48.9%
#3
40.8%
#4
40.2%
#5
38.9%
#6
38.6%
#7
38.3%
#8
38.3%
#9
37.8%
#10
37.2%
What city has the Highest Percentage of Asian Population in Virginia?
Loudoun Valley Estates has the Highest Percentage of Asian Population in Virginia with 55.9%.
What is the Percentage of Asian Population in the State of Virginia?
Percentage of Asian Population in Virginia is 6.9%.
What is the Percentage of Asian Population in the United States?
Percentage of Asian Population in the United States is 5.8%.