Norwood borough, NJ Map & Demographics
Norwood borough Overview
$63,518
PER CAPITA INCOME
$179,500
AVG FAMILY INCOME
$156,630
AVG HOUSEHOLD INCOME
42.7%
WAGE / INCOME GAP [ % ]
57.3¢/ $1
WAGE / INCOME GAP [ $ ]
0.44
INEQUALITY / GINI INDEX
5,657
TOTAL POPULATION
2,609
MALE POPULATION
3,048
FEMALE POPULATION
85.60
MALES / 100 FEMALES
116.83
FEMALES / 100 MALES
48.1
MEDIAN AGE
3.4
AVG FAMILY SIZE
2.8
AVG HOUSEHOLD SIZE
2,806
LABOR FORCE [ PEOPLE ]
60.5%
PERCENT IN LABOR FORCE
2.5%
UNEMPLOYMENT RATE
Income in Norwood borough
Income Overview in Norwood borough
Per Capita Income in Norwood borough is $63,518, while median incomes of families and households are $179,500 and $156,630 respectively.
| Characteristic | Number | Measure |
| Per Capita Income | 5,657 | $63,518 |
| Median Family Income | 1,440 | $179,500 |
| Mean Family Income | 1,440 | $218,518 |
| Median Household Income | 1,964 | $156,630 |
| Mean Household Income | 1,964 | $177,425 |
| Income Deficit | 1,440 | $0 |
| Wage / Income Gap (%) | 5,657 | 42.75% |
| Wage / Income Gap ($) | 5,657 | 57.25¢ per $1 |
| Gini / Inequality Index | 5,657 | 0.44 |
Earnings by Sex in Norwood borough
Average Earnings in Norwood borough are $69,609, $95,128 for men and $54,464 for women, a difference of 42.7%.
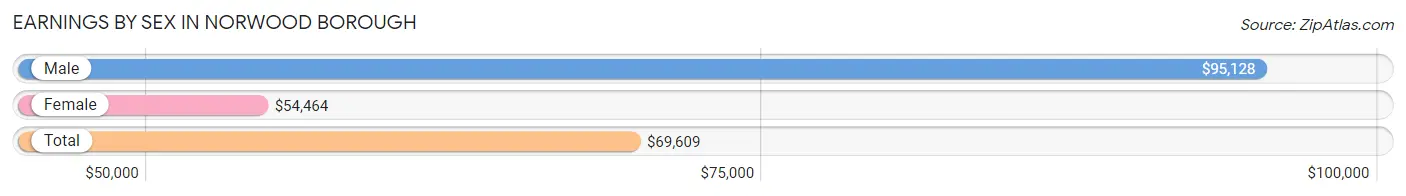
| Sex | Number | Average Earnings |
| Male | 1,570 (52.6%) | $95,128 |
| Female | 1,412 (47.3%) | $54,464 |
| Total | 2,982 (100.0%) | $69,609 |
Earnings by Sex by Income Bracket in Norwood borough
The most common earnings brackets in Norwood borough are $100,000+ for men (737 | 46.9%) and $100,000+ for women (301 | 21.3%).
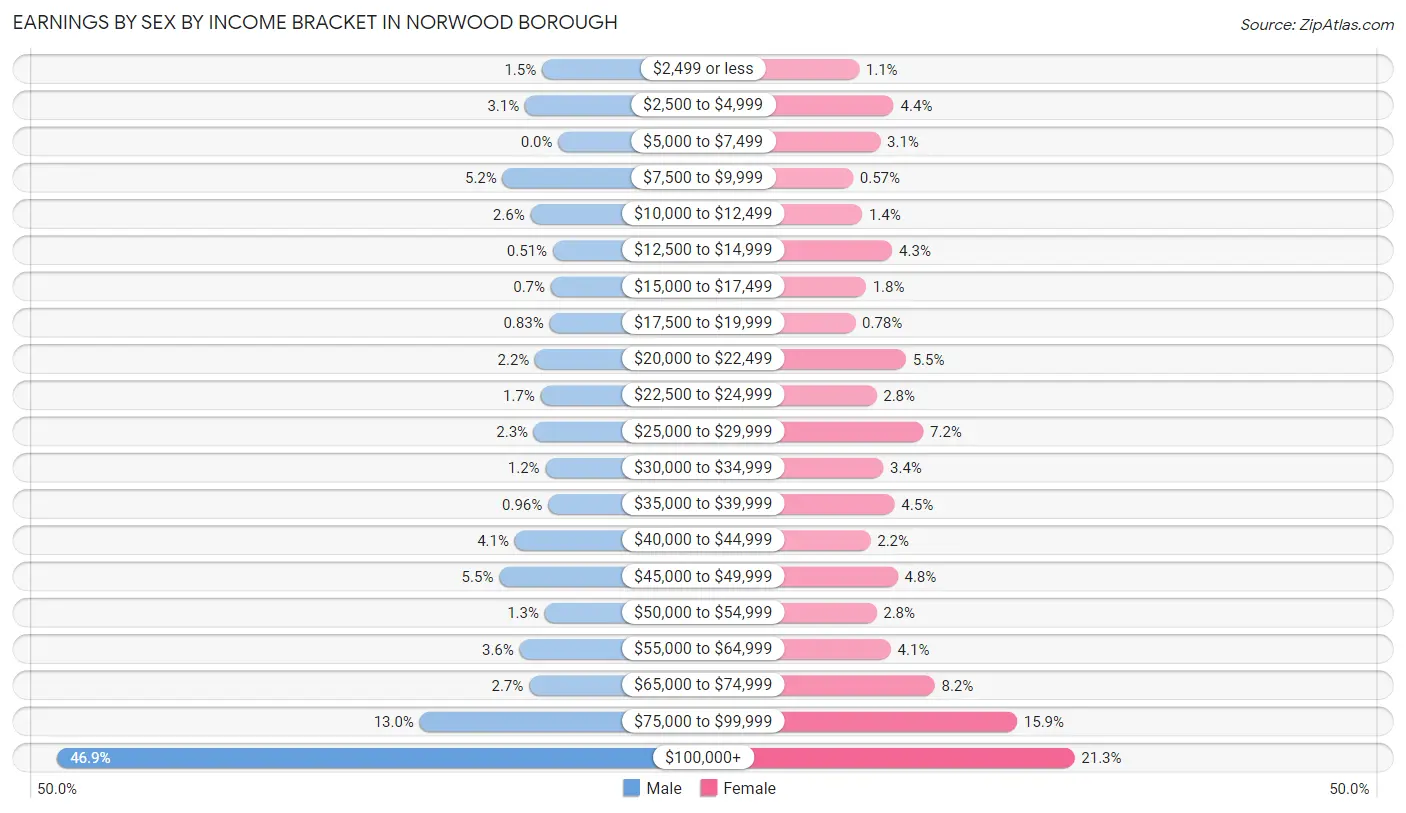
| Income | Male | Female |
| $2,499 or less | 24 (1.5%) | 16 (1.1%) |
| $2,500 to $4,999 | 49 (3.1%) | 62 (4.4%) |
| $5,000 to $7,499 | 0 (0.0%) | 44 (3.1%) |
| $7,500 to $9,999 | 82 (5.2%) | 8 (0.6%) |
| $10,000 to $12,499 | 41 (2.6%) | 20 (1.4%) |
| $12,500 to $14,999 | 8 (0.5%) | 60 (4.3%) |
| $15,000 to $17,499 | 11 (0.7%) | 25 (1.8%) |
| $17,500 to $19,999 | 13 (0.8%) | 11 (0.8%) |
| $20,000 to $22,499 | 34 (2.2%) | 78 (5.5%) |
| $22,500 to $24,999 | 26 (1.7%) | 39 (2.8%) |
| $25,000 to $29,999 | 36 (2.3%) | 101 (7.1%) |
| $30,000 to $34,999 | 19 (1.2%) | 48 (3.4%) |
| $35,000 to $39,999 | 15 (1.0%) | 63 (4.5%) |
| $40,000 to $44,999 | 64 (4.1%) | 31 (2.2%) |
| $45,000 to $49,999 | 87 (5.5%) | 67 (4.8%) |
| $50,000 to $54,999 | 20 (1.3%) | 39 (2.8%) |
| $55,000 to $64,999 | 57 (3.6%) | 58 (4.1%) |
| $65,000 to $74,999 | 43 (2.7%) | 116 (8.2%) |
| $75,000 to $99,999 | 204 (13.0%) | 225 (15.9%) |
| $100,000+ | 737 (46.9%) | 301 (21.3%) |
| Total | 1,570 (100.0%) | 1,412 (100.0%) |
Earnings by Sex by Educational Attainment in Norwood borough
Average earnings in Norwood borough are $115,134 for men and $60,000 for women, a difference of 47.9%. Men with an educational attainment of college or associate's degree enjoy the highest average annual earnings of $129,063, while those with high school diploma education earn the least with $46,885. Women with an educational attainment of graduate degree earn the most with the average annual earnings of $78,875, while those with high school diploma education have the smallest earnings of $65,212.
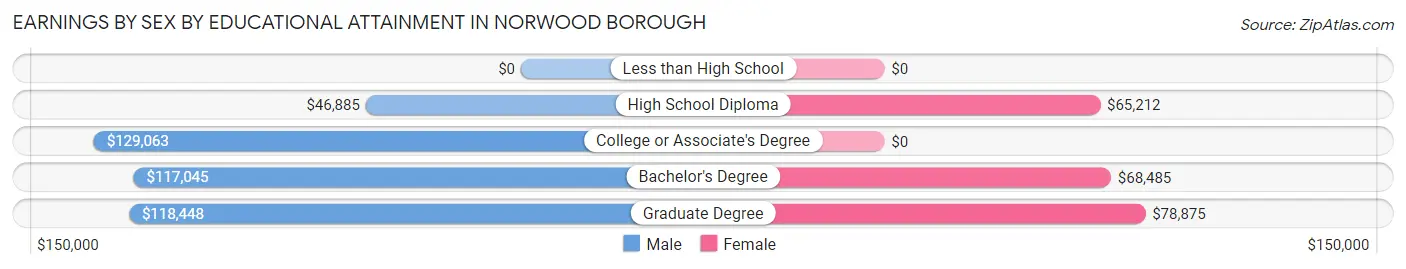
| Educational Attainment | Male Income | Female Income |
| Less than High School | - | - |
| High School Diploma | $46,885 | $65,212 |
| College or Associate's Degree | $129,063 | $0 |
| Bachelor's Degree | $117,045 | $68,485 |
| Graduate Degree | $118,448 | $78,875 |
| Total | $115,134 | $60,000 |
Family Income in Norwood borough
Family Income Brackets in Norwood borough
According to the Norwood borough family income data, there are 634 families falling into the $200,000+ income range, which is the most common income bracket and makes up 44.0% of all families.
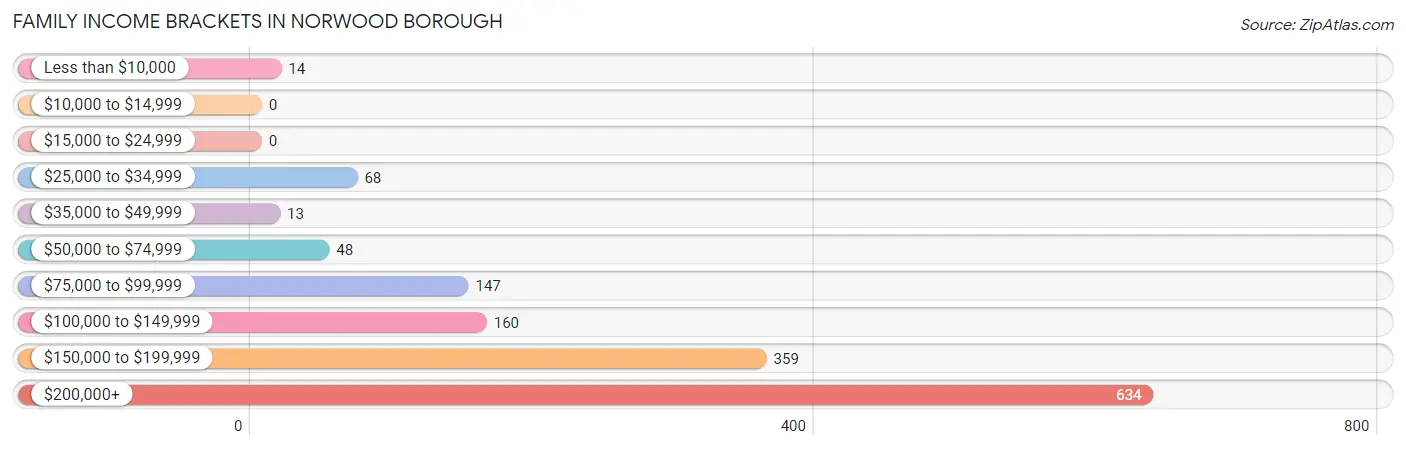
| Income Bracket | # Families | % Families |
| Less than $10,000 | 14 | 1.0% |
| $10,000 to $14,999 | 0 | 0.0% |
| $15,000 to $24,999 | 0 | 0.0% |
| $25,000 to $34,999 | 68 | 4.7% |
| $35,000 to $49,999 | 13 | 0.9% |
| $50,000 to $74,999 | 48 | 3.3% |
| $75,000 to $99,999 | 147 | 10.2% |
| $100,000 to $149,999 | 160 | 11.1% |
| $150,000 to $199,999 | 359 | 24.9% |
| $200,000+ | 634 | 44.0% |
Family Income by Famaliy Size in Norwood borough
6-person families (85 | 5.9%) account for the highest median family income in Norwood borough with $250,001 per family, while 2-person families (477 | 33.1%) have the highest median income of $77,098 per family member.
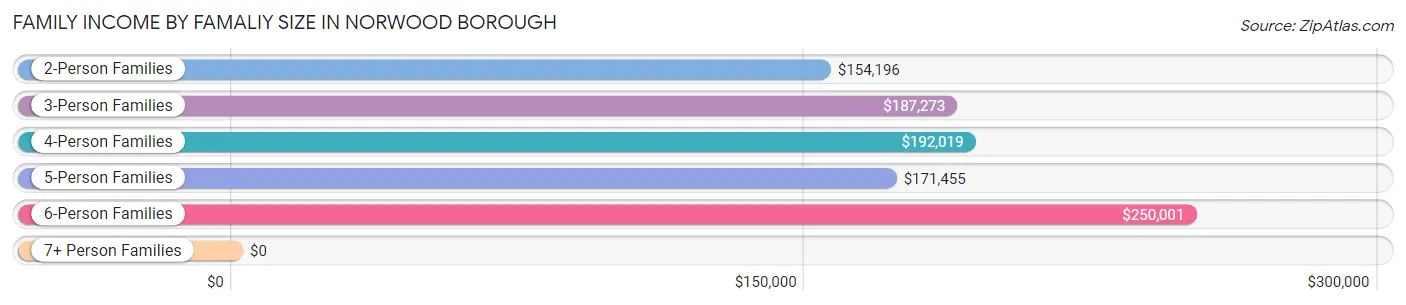
| Income Bracket | # Families | Median Income |
| 2-Person Families | 477 (33.1%) | $154,196 |
| 3-Person Families | 366 (25.4%) | $187,273 |
| 4-Person Families | 363 (25.2%) | $192,019 |
| 5-Person Families | 149 (10.3%) | $171,455 |
| 6-Person Families | 85 (5.9%) | $250,001 |
| 7+ Person Families | 0 (0.0%) | $0 |
| Total | 1,440 (100.0%) | $179,500 |
Family Income by Number of Earners in Norwood borough
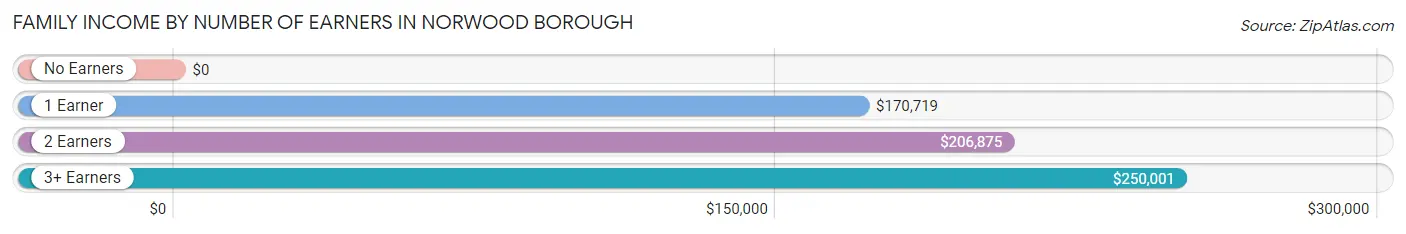
| Number of Earners | # Families | Median Income |
| No Earners | 169 (11.7%) | $0 |
| 1 Earner | 402 (27.9%) | $170,719 |
| 2 Earners | 630 (43.8%) | $206,875 |
| 3+ Earners | 239 (16.6%) | $250,001 |
| Total | 1,440 (100.0%) | $179,500 |
Household Income in Norwood borough
Household Income Brackets in Norwood borough
With 656 households falling in the category, the $200,000+ income range is the most frequent in Norwood borough, accounting for 33.4% of all households. In contrast, only 31 households (1.6%) fall into the $10,000 to $14,999 income bracket, making it the least populous group.
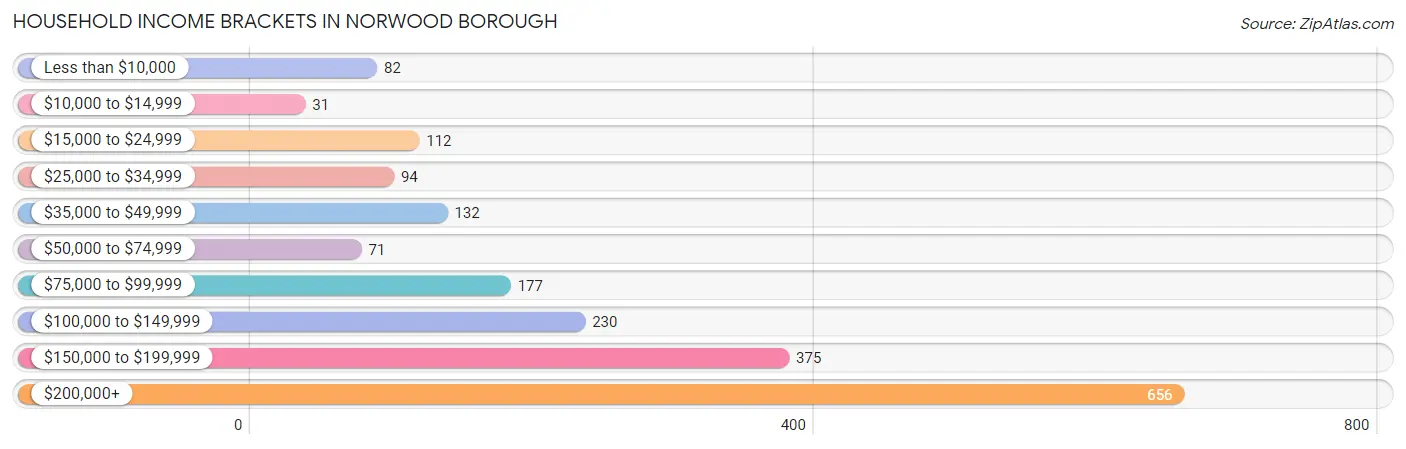
| Income Bracket | # Households | % Households |
| Less than $10,000 | 82 | 4.2% |
| $10,000 to $14,999 | 31 | 1.6% |
| $15,000 to $24,999 | 112 | 5.7% |
| $25,000 to $34,999 | 94 | 4.8% |
| $35,000 to $49,999 | 132 | 6.7% |
| $50,000 to $74,999 | 71 | 3.6% |
| $75,000 to $99,999 | 177 | 9.0% |
| $100,000 to $149,999 | 230 | 11.7% |
| $150,000 to $199,999 | 375 | 19.1% |
| $200,000+ | 656 | 33.4% |
Household Income by Householder Age in Norwood borough
The median household income in Norwood borough is $156,630, with the highest median household income of $172,604 found in the 45 to 64 years age bracket for the primary householder. A total of 973 households (49.5%) fall into this category. Meanwhile, the 15 to 24 years age bracket for the primary householder has the lowest median household income of $0, with 11 households (0.6%) in this group.
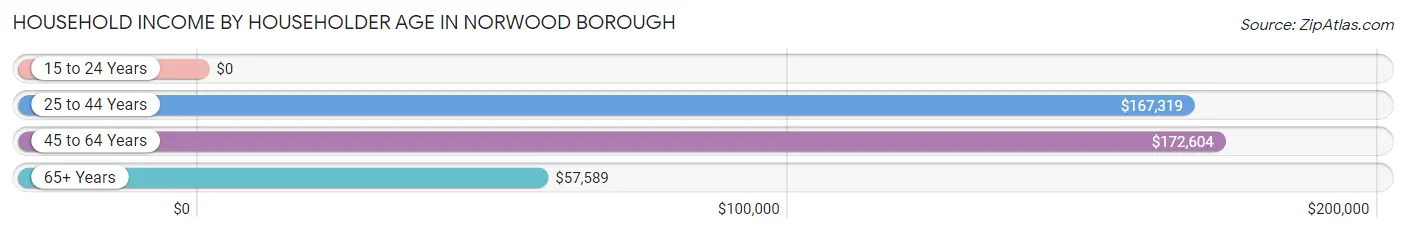
| Income Bracket | # Households | Median Income |
| 15 to 24 Years | 11 (0.6%) | $0 |
| 25 to 44 Years | 303 (15.4%) | $167,319 |
| 45 to 64 Years | 973 (49.5%) | $172,604 |
| 65+ Years | 677 (34.5%) | $57,589 |
| Total | 1,964 (100.0%) | $156,630 |
Poverty in Norwood borough
Income Below Poverty by Sex and Age in Norwood borough
With 2.6% poverty level for males and 3.5% for females among the residents of Norwood borough, 55 to 64 year old males and 75 year old and over females are the most vulnerable to poverty, with 48 males (9.5%) and 47 females (10.6%) in their respective age groups living below the poverty level.
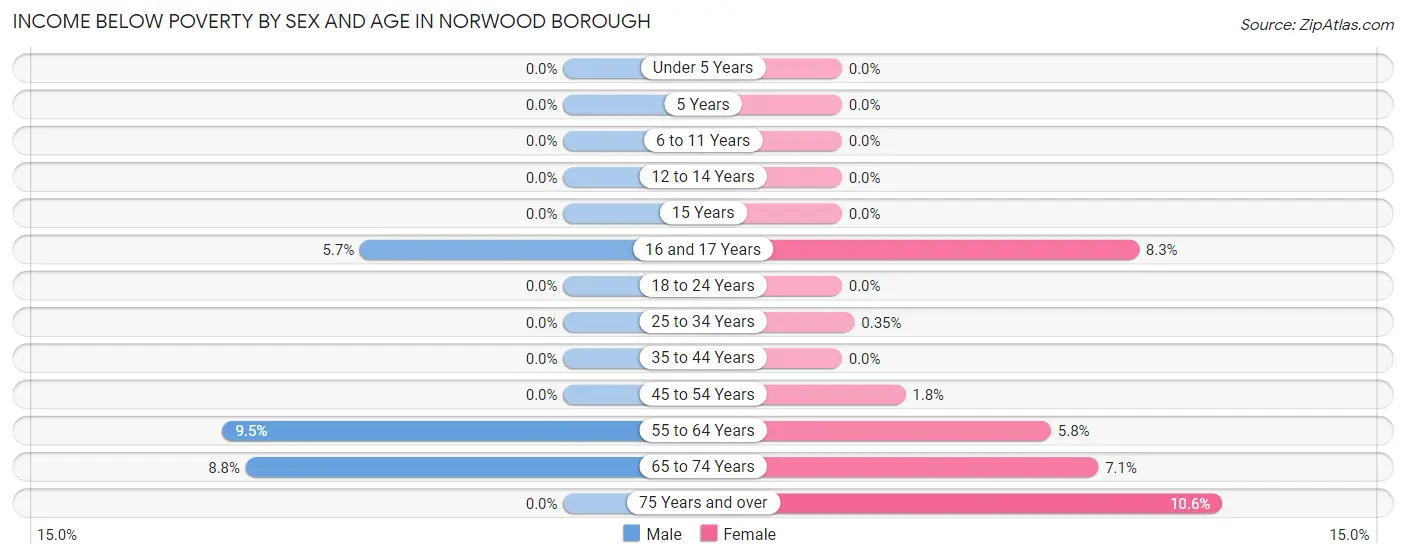
| Age Bracket | Male | Female |
| Under 5 Years | 0 (0.0%) | 0 (0.0%) |
| 5 Years | 0 (0.0%) | 0 (0.0%) |
| 6 to 11 Years | 0 (0.0%) | 0 (0.0%) |
| 12 to 14 Years | 0 (0.0%) | 0 (0.0%) |
| 15 Years | 0 (0.0%) | 0 (0.0%) |
| 16 and 17 Years | 3 (5.7%) | 11 (8.3%) |
| 18 to 24 Years | 0 (0.0%) | 0 (0.0%) |
| 25 to 34 Years | 0 (0.0%) | 1 (0.4%) |
| 35 to 44 Years | 0 (0.0%) | 0 (0.0%) |
| 45 to 54 Years | 0 (0.0%) | 9 (1.8%) |
| 55 to 64 Years | 48 (9.5%) | 21 (5.8%) |
| 65 to 74 Years | 16 (8.8%) | 13 (7.1%) |
| 75 Years and over | 0 (0.0%) | 47 (10.6%) |
| Total | 67 (2.6%) | 102 (3.5%) |
Income Above Poverty by Sex and Age in Norwood borough
According to the poverty statistics in Norwood borough, males aged under 5 years and females aged under 5 years are the age groups that are most secure financially, with 100.0% of males and 100.0% of females in these age groups living above the poverty line.
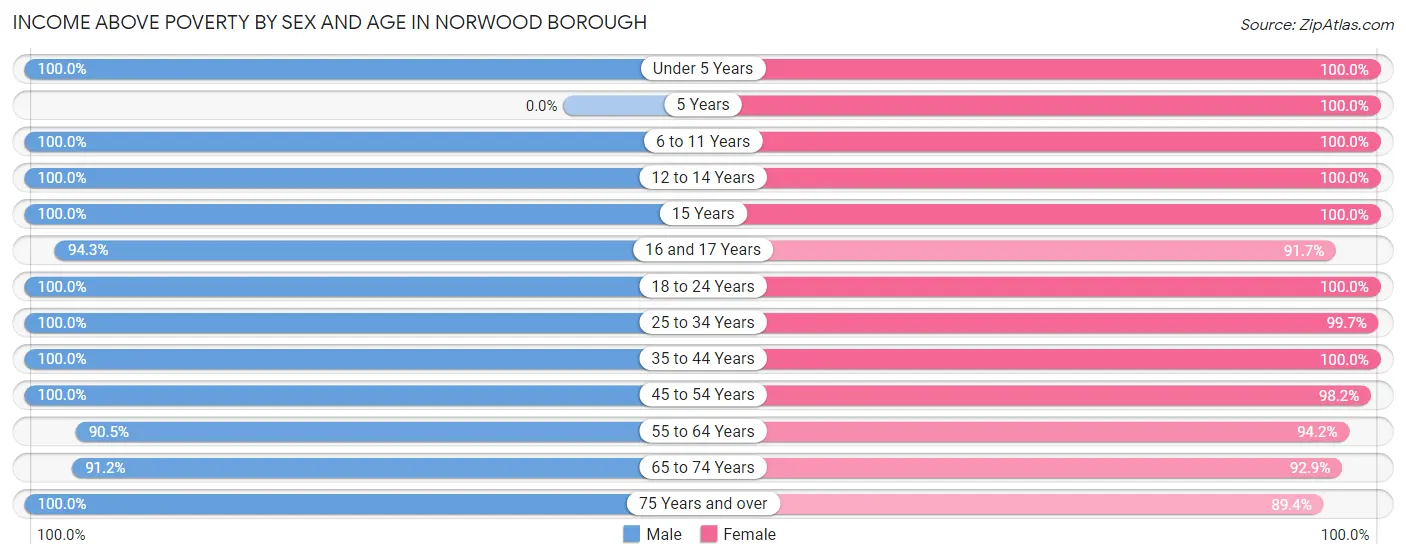
| Age Bracket | Male | Female |
| Under 5 Years | 116 (100.0%) | 34 (100.0%) |
| 5 Years | 0 (0.0%) | 34 (100.0%) |
| 6 to 11 Years | 221 (100.0%) | 195 (100.0%) |
| 12 to 14 Years | 78 (100.0%) | 229 (100.0%) |
| 15 Years | 52 (100.0%) | 60 (100.0%) |
| 16 and 17 Years | 50 (94.3%) | 122 (91.7%) |
| 18 to 24 Years | 255 (100.0%) | 240 (100.0%) |
| 25 to 34 Years | 207 (100.0%) | 284 (99.7%) |
| 35 to 44 Years | 213 (100.0%) | 238 (100.0%) |
| 45 to 54 Years | 377 (100.0%) | 500 (98.2%) |
| 55 to 64 Years | 458 (90.5%) | 340 (94.2%) |
| 65 to 74 Years | 165 (91.2%) | 169 (92.9%) |
| 75 Years and over | 284 (100.0%) | 397 (89.4%) |
| Total | 2,476 (97.4%) | 2,842 (96.5%) |
Income Below Poverty Among Married-Couple Families in Norwood borough
The poverty statistics for married-couple families in Norwood borough show that 0.4% or 5 of the total 1,295 families live below the poverty line. Families with 1 or 2 children have the highest poverty rate of 1.1%, comprising of 5 families. On the other hand, families with no children have the lowest poverty rate of 0.0%, which includes 0 families.
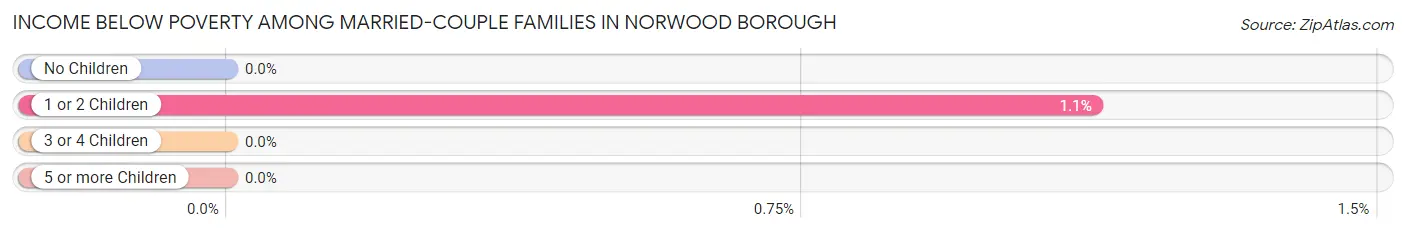
| Children | Above Poverty | Below Poverty |
| No Children | 704 (100.0%) | 0 (0.0%) |
| 1 or 2 Children | 437 (98.9%) | 5 (1.1%) |
| 3 or 4 Children | 149 (100.0%) | 0 (0.0%) |
| 5 or more Children | 0 (0.0%) | 0 (0.0%) |
| Total | 1,290 (99.6%) | 5 (0.4%) |
Income Below Poverty Among Single-Parent Households in Norwood borough
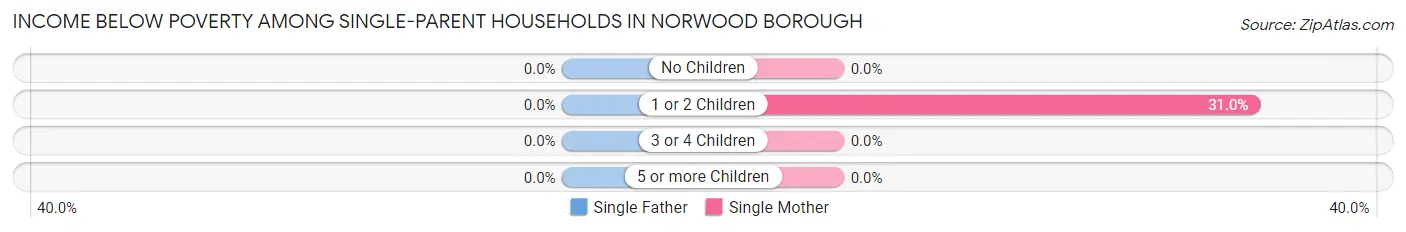
| Children | Single Father | Single Mother |
| No Children | 0 (0.0%) | 0 (0.0%) |
| 1 or 2 Children | 0 (0.0%) | 9 (31.0%) |
| 3 or 4 Children | 0 (0.0%) | 0 (0.0%) |
| 5 or more Children | 0 (0.0%) | 0 (0.0%) |
| Total | 0 (0.0%) | 9 (8.1%) |
Income Below Poverty Among Married-Couple vs Single-Parent Households in Norwood borough
The poverty data for Norwood borough shows that 5 of the married-couple family households (0.4%) and 9 of the single-parent households (6.2%) are living below the poverty level. Within the married-couple family households, those with 1 or 2 children have the highest poverty rate, with 5 households (1.1%) falling below the poverty line. Among the single-parent households, those with 1 or 2 children have the highest poverty rate, with 9 household (31.0%) living below poverty.
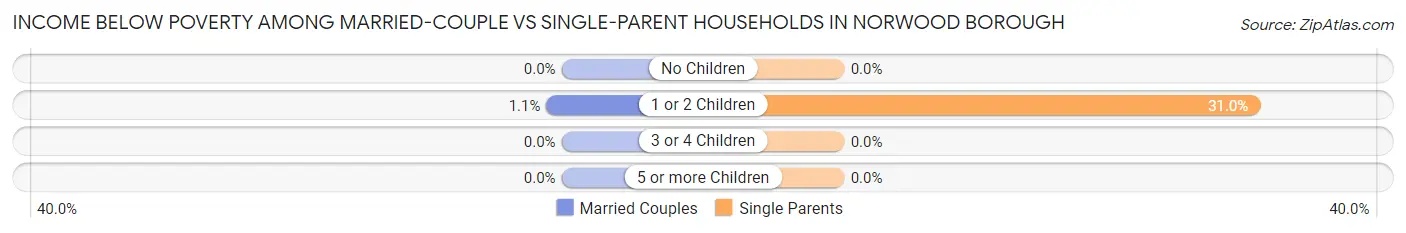
| Children | Married-Couple Families | Single-Parent Households |
| No Children | 0 (0.0%) | 0 (0.0%) |
| 1 or 2 Children | 5 (1.1%) | 9 (31.0%) |
| 3 or 4 Children | 0 (0.0%) | 0 (0.0%) |
| 5 or more Children | 0 (0.0%) | 0 (0.0%) |
| Total | 5 (0.4%) | 9 (6.2%) |
Race in Norwood borough
The most populous races in Norwood borough are White / Caucasian (3,461 | 61.2%), Asian (1,785 | 31.6%), and Hispanic or Latino (352 | 6.2%).
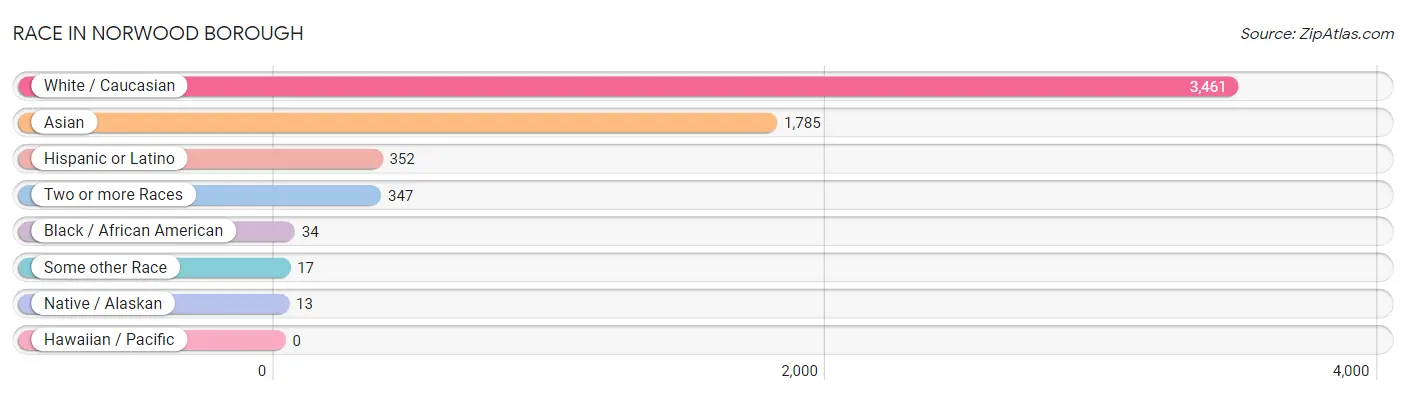
| Race | # Population | % Population |
| Asian | 1,785 | 31.6% |
| Black / African American | 34 | 0.6% |
| Hawaiian / Pacific | 0 | 0.0% |
| Hispanic or Latino | 352 | 6.2% |
| Native / Alaskan | 13 | 0.2% |
| White / Caucasian | 3,461 | 61.2% |
| Two or more Races | 347 | 6.1% |
| Some other Race | 17 | 0.3% |
| Total | 5,657 | 100.0% |
Ancestry in Norwood borough
The most populous ancestries reported in Norwood borough are Burmese (1,553 | 27.5%), Irish (946 | 16.7%), Italian (827 | 14.6%), German (578 | 10.2%), and Polish (227 | 4.0%), together accounting for 73.0% of all Norwood borough residents.
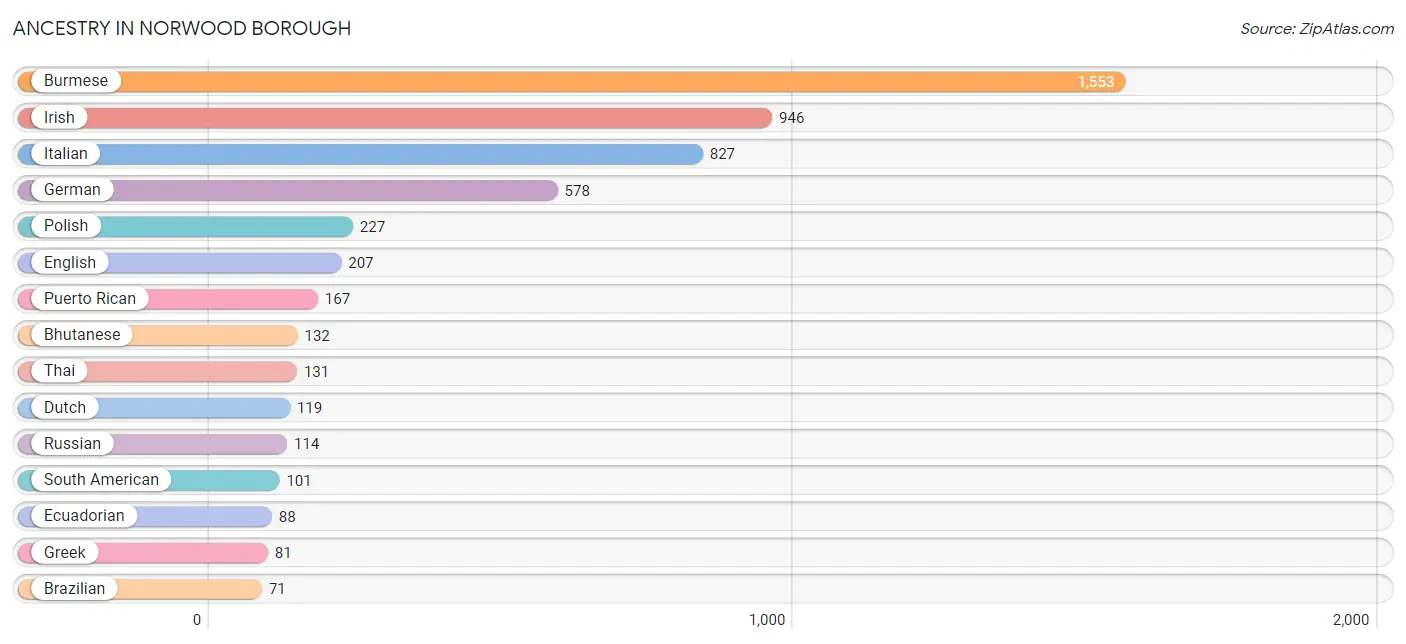
| Ancestry | # Population | % Population |
| Albanian | 65 | 1.1% |
| American | 66 | 1.2% |
| Arab | 66 | 1.2% |
| Austrian | 16 | 0.3% |
| Bhutanese | 132 | 2.3% |
| Brazilian | 71 | 1.3% |
| Burmese | 1,553 | 27.5% |
| Canadian | 38 | 0.7% |
| Central American | 11 | 0.2% |
| Choctaw | 1 | 0.0% |
| Colombian | 7 | 0.1% |
| Czechoslovakian | 20 | 0.4% |
| Danish | 11 | 0.2% |
| Dominican | 57 | 1.0% |
| Dutch | 119 | 2.1% |
| Eastern European | 47 | 0.8% |
| Ecuadorian | 88 | 1.6% |
| Egyptian | 34 | 0.6% |
| English | 207 | 3.7% |
| European | 20 | 0.4% |
| French | 32 | 0.6% |
| French Canadian | 31 | 0.5% |
| German | 578 | 10.2% |
| Greek | 81 | 1.4% |
| Haitian | 39 | 0.7% |
| Honduran | 11 | 0.2% |
| Hungarian | 14 | 0.3% |
| Indian (Asian) | 58 | 1.0% |
| Irish | 946 | 16.7% |
| Israeli | 9 | 0.2% |
| Italian | 827 | 14.6% |
| Jamaican | 5 | 0.1% |
| Korean | 25 | 0.4% |
| Lebanese | 9 | 0.2% |
| Maltese | 19 | 0.3% |
| Moroccan | 23 | 0.4% |
| Nigerian | 5 | 0.1% |
| Northern European | 39 | 0.7% |
| Norwegian | 24 | 0.4% |
| Peruvian | 6 | 0.1% |
| Polish | 227 | 4.0% |
| Puerto Rican | 167 | 2.9% |
| Russian | 114 | 2.0% |
| Scotch-Irish | 44 | 0.8% |
| Scottish | 32 | 0.6% |
| South American | 101 | 1.8% |
| Subsaharan African | 5 | 0.1% |
| Swedish | 19 | 0.3% |
| Swiss | 16 | 0.3% |
| Syrian | 9 | 0.2% |
| Thai | 131 | 2.3% |
| Ukrainian | 7 | 0.1% |
| Welsh | 16 | 0.3% |
| Yugoslavian | 7 | 0.1% | View All 54 Rows |
Immigrants in Norwood borough
The most numerous immigrant groups reported in Norwood borough came from Asia (1,372 | 24.2%), Eastern Asia (1,217 | 21.5%), Korea (1,163 | 20.6%), Europe (86 | 1.5%), and India (86 | 1.5%), together accounting for 69.4% of all Norwood borough residents.
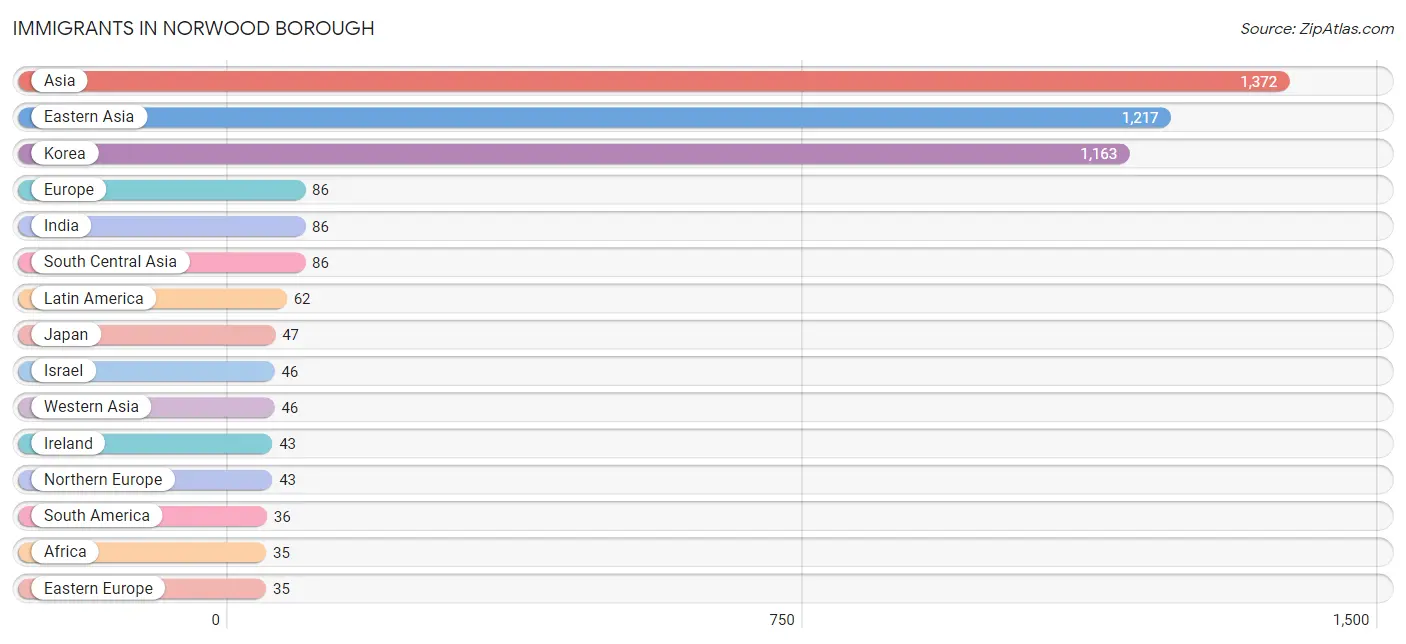
| Immigration Origin | # Population | % Population |
| Africa | 35 | 0.6% |
| Asia | 1,372 | 24.2% |
| Brazil | 26 | 0.5% |
| Canada | 12 | 0.2% |
| Caribbean | 26 | 0.5% |
| China | 7 | 0.1% |
| Colombia | 4 | 0.1% |
| Congo | 7 | 0.1% |
| Dominican Republic | 21 | 0.4% |
| Eastern Asia | 1,217 | 21.5% |
| Eastern Europe | 35 | 0.6% |
| Egypt | 9 | 0.2% |
| Europe | 86 | 1.5% |
| Greece | 8 | 0.1% |
| India | 86 | 1.5% |
| Ireland | 43 | 0.8% |
| Israel | 46 | 0.8% |
| Jamaica | 5 | 0.1% |
| Japan | 47 | 0.8% |
| Korea | 1,163 | 20.6% |
| Latin America | 62 | 1.1% |
| Middle Africa | 7 | 0.1% |
| Morocco | 11 | 0.2% |
| Nigeria | 5 | 0.1% |
| Northern Africa | 23 | 0.4% |
| Northern Europe | 43 | 0.8% |
| Peru | 6 | 0.1% |
| Philippines | 11 | 0.2% |
| Poland | 35 | 0.6% |
| Singapore | 12 | 0.2% |
| South America | 36 | 0.6% |
| South Central Asia | 86 | 1.5% |
| South Eastern Asia | 23 | 0.4% |
| Southern Europe | 8 | 0.1% |
| Western Africa | 5 | 0.1% |
| Western Asia | 46 | 0.8% | View All 36 Rows |
Sex and Age in Norwood borough
Sex and Age in Norwood borough
The most populous age groups in Norwood borough are 55 to 59 Years (323 | 12.4%) for men and 50 to 54 Years (352 | 11.6%) for women.
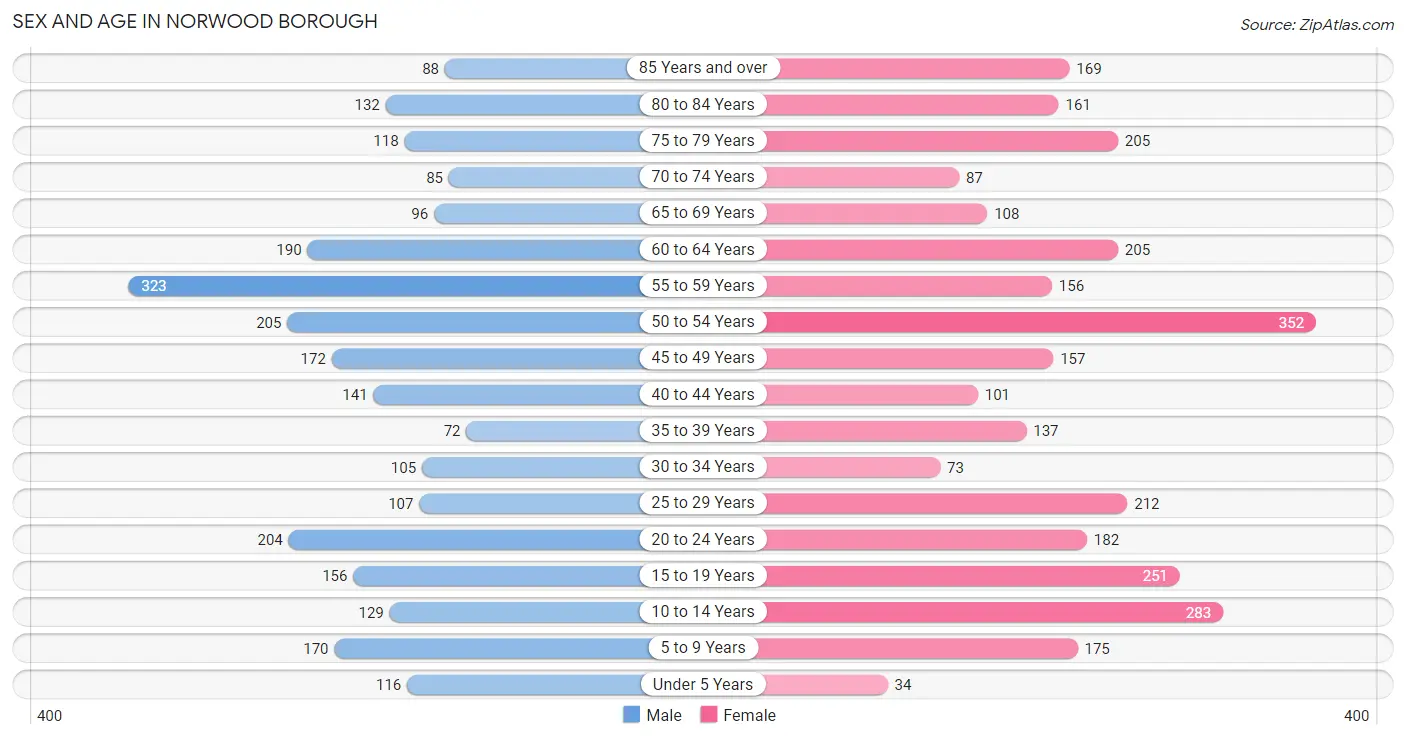
| Age Bracket | Male | Female |
| Under 5 Years | 116 (4.4%) | 34 (1.1%) |
| 5 to 9 Years | 170 (6.5%) | 175 (5.7%) |
| 10 to 14 Years | 129 (4.9%) | 283 (9.3%) |
| 15 to 19 Years | 156 (6.0%) | 251 (8.2%) |
| 20 to 24 Years | 204 (7.8%) | 182 (6.0%) |
| 25 to 29 Years | 107 (4.1%) | 212 (7.0%) |
| 30 to 34 Years | 105 (4.0%) | 73 (2.4%) |
| 35 to 39 Years | 72 (2.8%) | 137 (4.5%) |
| 40 to 44 Years | 141 (5.4%) | 101 (3.3%) |
| 45 to 49 Years | 172 (6.6%) | 157 (5.1%) |
| 50 to 54 Years | 205 (7.9%) | 352 (11.6%) |
| 55 to 59 Years | 323 (12.4%) | 156 (5.1%) |
| 60 to 64 Years | 190 (7.3%) | 205 (6.7%) |
| 65 to 69 Years | 96 (3.7%) | 108 (3.5%) |
| 70 to 74 Years | 85 (3.3%) | 87 (2.9%) |
| 75 to 79 Years | 118 (4.5%) | 205 (6.7%) |
| 80 to 84 Years | 132 (5.1%) | 161 (5.3%) |
| 85 Years and over | 88 (3.4%) | 169 (5.5%) |
| Total | 2,609 (100.0%) | 3,048 (100.0%) |
Families and Households in Norwood borough
Median Family Size in Norwood borough
The median family size in Norwood borough is 3.41 persons per family, with married-couple families (1,295 | 89.9%) accounting for the largest median family size of 3.49 persons per family. On the other hand, single male/father families (34 | 2.4%) represent the smallest median family size with 1.97 persons per family.
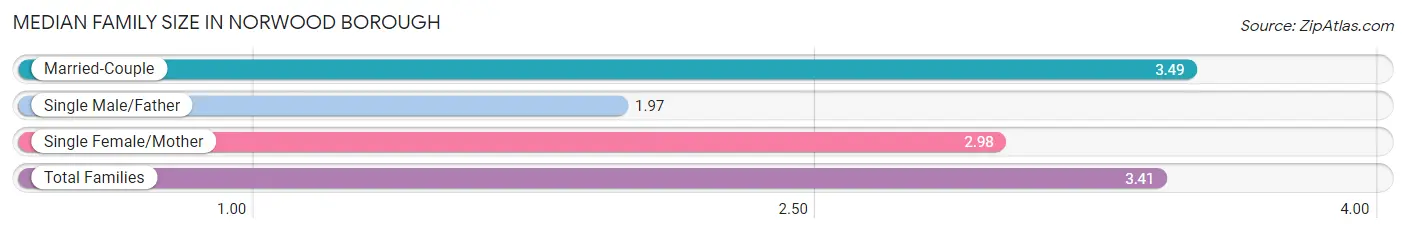
| Family Type | # Families | Family Size |
| Married-Couple | 1,295 (89.9%) | 3.49 |
| Single Male/Father | 34 (2.4%) | 1.97 |
| Single Female/Mother | 111 (7.7%) | 2.98 |
| Total Families | 1,440 (100.0%) | 3.41 |
Median Household Size in Norwood borough
The median household size in Norwood borough is 2.79 persons per household, with married-couple households (1,295 | 65.9%) accounting for the largest median household size of 3.49 persons per household. non-family households (524 | 26.7%) represent the smallest median household size with 1.07 persons per household.
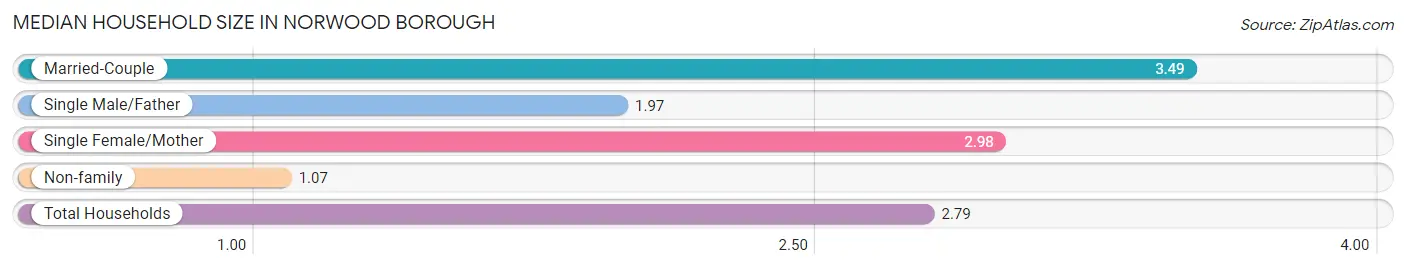
| Household Type | # Households | Household Size |
| Married-Couple | 1,295 (65.9%) | 3.49 |
| Single Male/Father | 34 (1.7%) | 1.97 |
| Single Female/Mother | 111 (5.7%) | 2.98 |
| Non-family | 524 (26.7%) | 1.07 |
| Total Households | 1,964 (100.0%) | 2.79 |
Household Size by Marriage Status in Norwood borough
Out of a total of 1,964 households in Norwood borough, 1,440 (73.3%) are family households, while 524 (26.7%) are nonfamily households. The most numerous type of family households are 2-person households, comprising 477, and the most common type of nonfamily households are 1-person households, comprising 490.
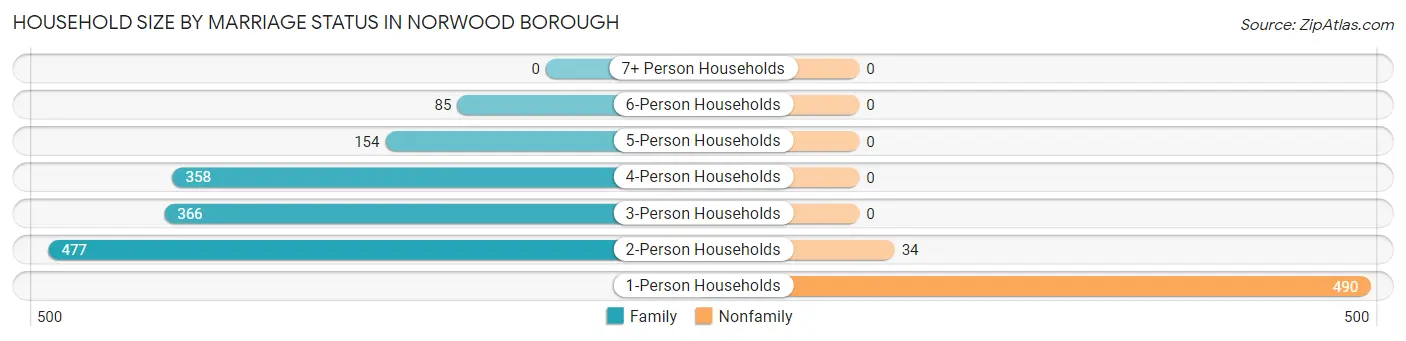
| Household Size | Family Households | Nonfamily Households |
| 1-Person Households | - | 490 (24.9%) |
| 2-Person Households | 477 (24.3%) | 34 (1.7%) |
| 3-Person Households | 366 (18.6%) | 0 (0.0%) |
| 4-Person Households | 358 (18.2%) | 0 (0.0%) |
| 5-Person Households | 154 (7.8%) | 0 (0.0%) |
| 6-Person Households | 85 (4.3%) | 0 (0.0%) |
| 7+ Person Households | 0 (0.0%) | 0 (0.0%) |
| Total | 1,440 (73.3%) | 524 (26.7%) |
Female Fertility in Norwood borough
Fertility by Age in Norwood borough
Average fertility rate in Norwood borough is 32.0 births per 1,000 women. Women in the age bracket of 35 to 50 years have the highest fertility rate with 63.0 births per 1,000 women. Women in the age bracket of 35 to 50 years acount for 75.7% of all women with births.
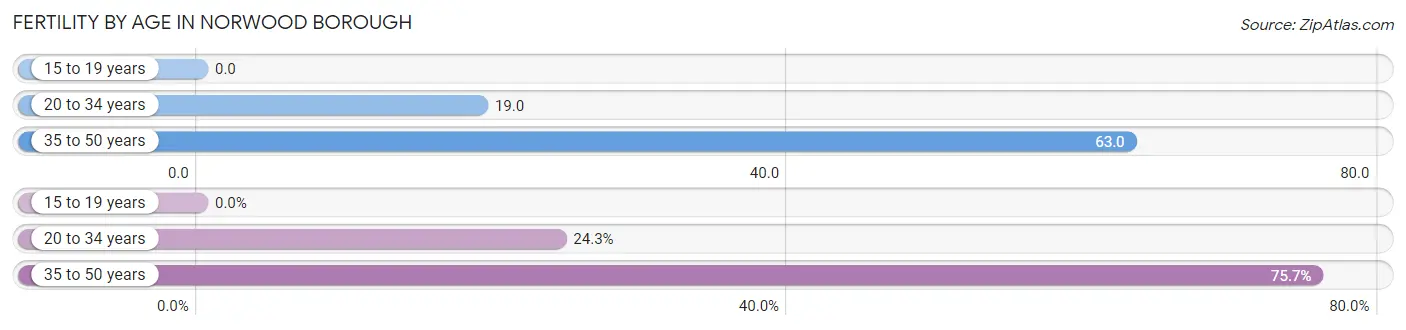
| Age Bracket | Women with Births | Births / 1,000 Women |
| 15 to 19 years | 0 (0.0%) | 0.0 |
| 20 to 34 years | 9 (24.3%) | 19.0 |
| 35 to 50 years | 28 (75.7%) | 63.0 |
| Total | 37 (100.0%) | 32.0 |
Fertility by Age by Marriage Status in Norwood borough
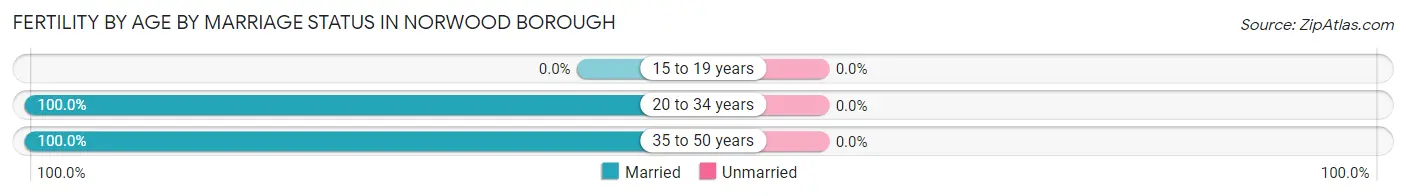
| Age Bracket | Married | Unmarried |
| 15 to 19 years | 0 (0.0%) | 0 (0.0%) |
| 20 to 34 years | 9 (100.0%) | 0 (0.0%) |
| 35 to 50 years | 28 (100.0%) | 0 (0.0%) |
| Total | 37 (100.0%) | 0 (0.0%) |
Fertility by Education in Norwood borough
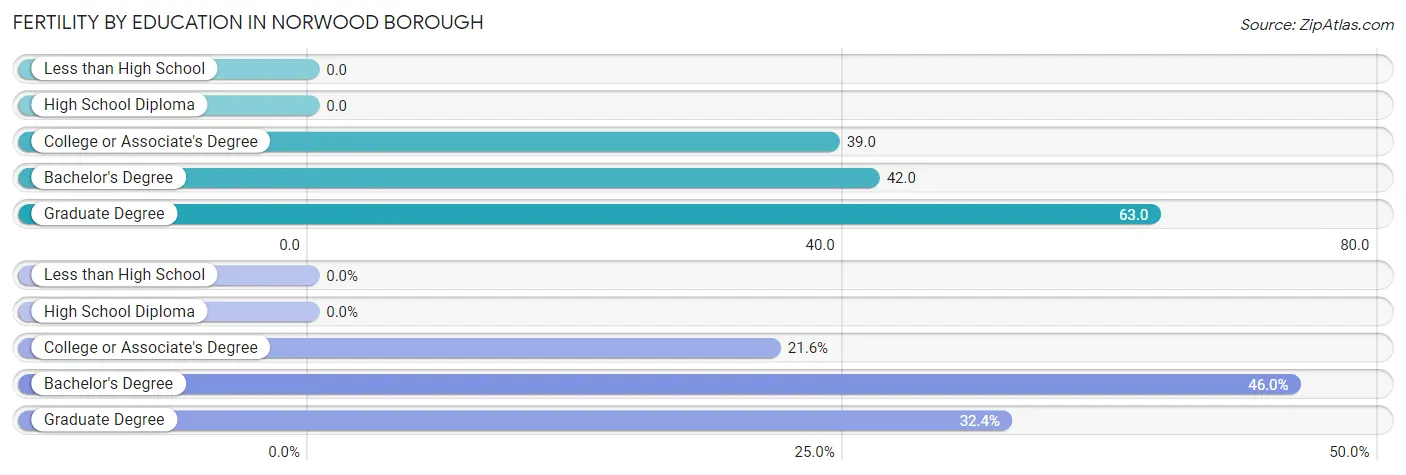
| Educational Attainment | Women with Births | Births / 1,000 Women |
| Less than High School | 0 (0.0%) | 0.0 |
| High School Diploma | 0 (0.0%) | 0.0 |
| College or Associate's Degree | 8 (21.6%) | 39.0 |
| Bachelor's Degree | 17 (46.0%) | 42.0 |
| Graduate Degree | 12 (32.4%) | 63.0 |
| Total | 37 (100.0%) | 32.0 |
Fertility by Education by Marriage Status in Norwood borough
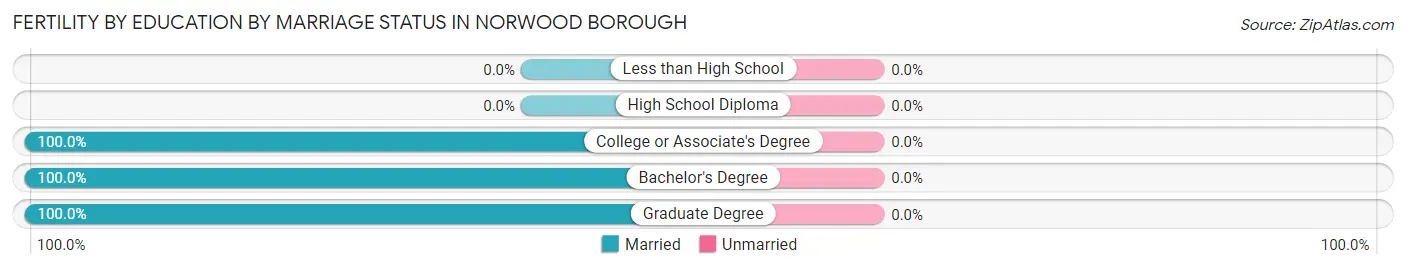
| Educational Attainment | Married | Unmarried |
| Less than High School | 0 (0.0%) | 0 (0.0%) |
| High School Diploma | 0 (0.0%) | 0 (0.0%) |
| College or Associate's Degree | 8 (100.0%) | 0 (0.0%) |
| Bachelor's Degree | 17 (100.0%) | 0 (0.0%) |
| Graduate Degree | 12 (100.0%) | 0 (0.0%) |
| Total | 37 (100.0%) | 0 (0.0%) |
Employment Characteristics in Norwood borough
Employment by Class of Employer in Norwood borough
Among the 2,706 employed individuals in Norwood borough, private company employees (1,752 | 64.7%), not-for-profit organizations (297 | 11.0%), and local government employees (209 | 7.7%) make up the most common classes of employment.
| Employer Class | # Employees | % Employees |
| Private Company Employees | 1,752 | 64.7% |
| Self-Employed (Incorporated) | 181 | 6.7% |
| Self-Employed (Not Incorporated) | 136 | 5.0% |
| Not-for-profit Organizations | 297 | 11.0% |
| Local Government Employees | 209 | 7.7% |
| State Government Employees | 21 | 0.8% |
| Federal Government Employees | 110 | 4.1% |
| Unpaid Family Workers | 0 | 0.0% |
| Total | 2,706 | 100.0% |
Employment Status by Age in Norwood borough
According to the labor force statistics for Norwood borough, out of the total population over 16 years of age (4,638), 60.5% or 2,806 individuals are in the labor force, with 2.5% or 70 of them unemployed. The age group with the highest labor force participation rate is 25 to 29 years, with 93.1% or 297 individuals in the labor force. Within the labor force, the 16 to 19 years age range has the highest percentage of unemployed individuals, with 37.8% or 34 of them being unemployed.
| Age Bracket | In Labor Force | Unemployed |
| 16 to 19 Years | 90 (30.5%) | 34 (37.8%) |
| 20 to 24 Years | 194 (50.3%) | 6 (3.1%) |
| 25 to 29 Years | 297 (93.1%) | 0 (0.0%) |
| 30 to 34 Years | 140 (78.7%) | 0 (0.0%) |
| 35 to 44 Years | 376 (83.4%) | 13 (3.5%) |
| 45 to 54 Years | 741 (83.6%) | 17 (2.3%) |
| 55 to 59 Years | 366 (76.4%) | 0 (0.0%) |
| 60 to 64 Years | 323 (81.8%) | 0 (0.0%) |
| 65 to 74 Years | 154 (41.0%) | 0 (0.0%) |
| 75 Years and over | 126 (14.4%) | 0 (0.0%) |
| Total | 2,806 (60.5%) | 70 (2.5%) |
Employment Status by Educational Attainment in Norwood borough
According to labor force statistics for Norwood borough, 82.8% of individuals (2,242) out of the total population between 25 and 64 years of age (2,708) are in the labor force, with 1.3% or 29 of them being unemployed. The group with the highest labor force participation rate are those with the educational attainment of college / associate degree, with 86.1% or 410 individuals in the labor force. Within the labor force, individuals with college / associate degree education have the highest percentage of unemployment, with 3.2% or 13 of them being unemployed.
| Educational Attainment | In Labor Force | Unemployed |
| Less than High School | 9 (22.0%) | 0 (0.0%) |
| High School Diploma | 337 (81.6%) | 6 (1.5%) |
| College / Associate Degree | 410 (86.1%) | 15 (3.2%) |
| Bachelor's Degree or higher | 1,486 (83.6%) | 14 (0.8%) |
| Total | 2,242 (82.8%) | 35 (1.3%) |
Employment Occupations by Sex in Norwood borough
Management, Business, Science and Arts Occupations
The most common Management, Business, Science and Arts occupations in Norwood borough are Management (651 | 23.8%), Community & Social Service (339 | 12.4%), Computers, Engineering & Science (262 | 9.6%), Health Diagnosing & Treating (215 | 7.9%), and Computers & Mathematics (189 | 6.9%).
Management, Business, Science and Arts Occupations by Sex
Within the Management, Business, Science and Arts occupations in Norwood borough, the most male-oriented occupations are Architecture & Engineering (72.1%), Arts, Media & Entertainment (66.3%), and Management (64.4%), while the most female-oriented occupations are Education, Arts & Media (100.0%), Health Technologists (82.1%), and Education Instruction & Library (81.6%).
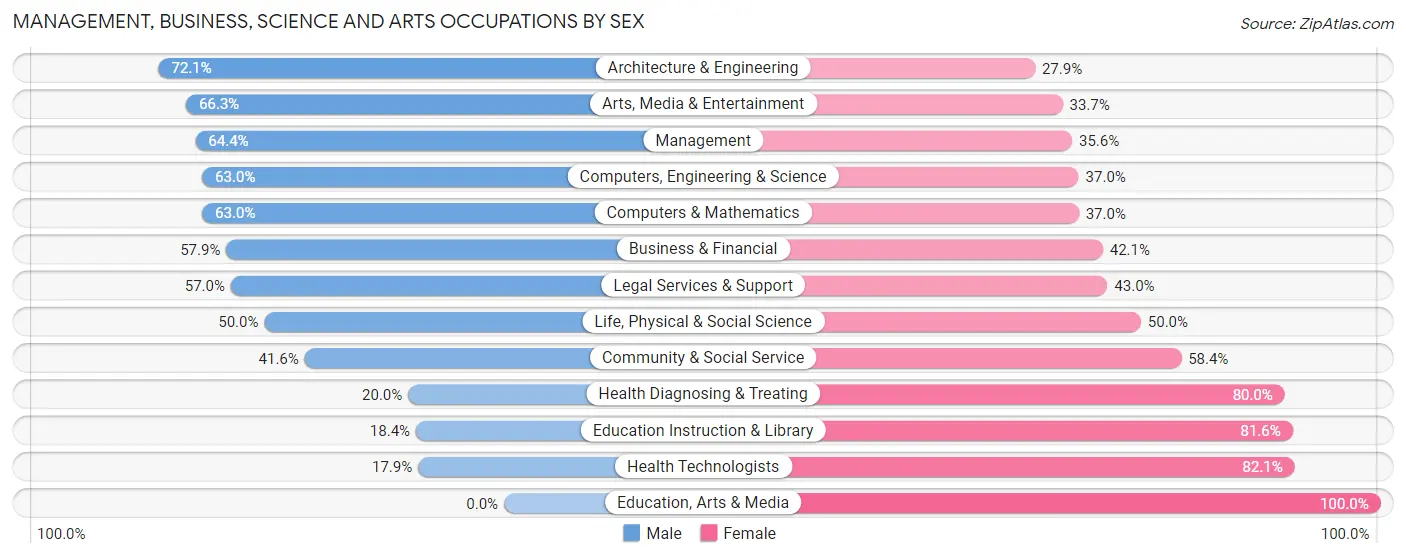
| Occupation | Male | Female |
| Management | 419 (64.4%) | 232 (35.6%) |
| Business & Financial | 73 (57.9%) | 53 (42.1%) |
| Computers, Engineering & Science | 165 (63.0%) | 97 (37.0%) |
| Computers & Mathematics | 119 (63.0%) | 70 (37.0%) |
| Architecture & Engineering | 31 (72.1%) | 12 (27.9%) |
| Life, Physical & Social Science | 15 (50.0%) | 15 (50.0%) |
| Community & Social Service | 141 (41.6%) | 198 (58.4%) |
| Education, Arts & Media | 0 (0.0%) | 8 (100.0%) |
| Legal Services & Support | 49 (57.0%) | 37 (43.0%) |
| Education Instruction & Library | 27 (18.4%) | 120 (81.6%) |
| Arts, Media & Entertainment | 65 (66.3%) | 33 (33.7%) |
| Health Diagnosing & Treating | 43 (20.0%) | 172 (80.0%) |
| Health Technologists | 33 (17.9%) | 151 (82.1%) |
| Total (Category) | 841 (52.8%) | 752 (47.2%) |
| Total (Overall) | 1,420 (51.9%) | 1,317 (48.1%) |
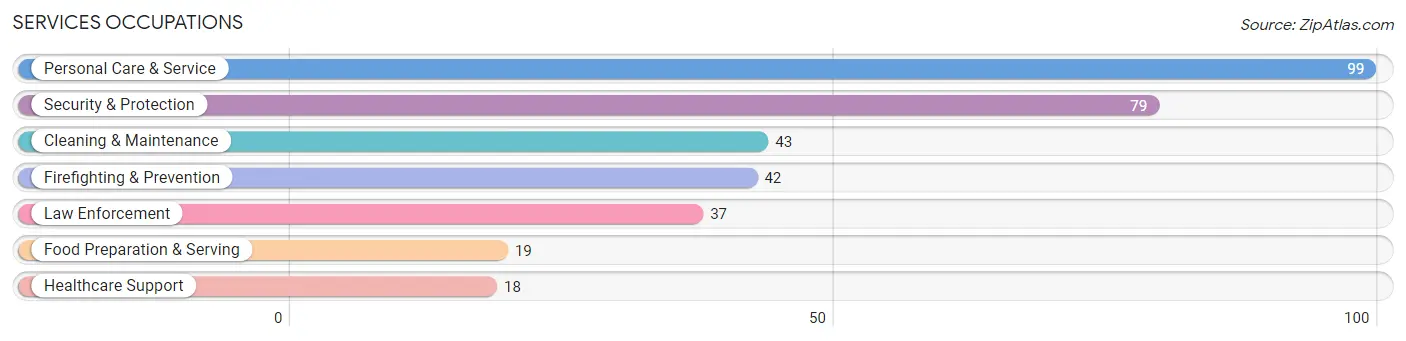
Services Occupations
The most common Services occupations in Norwood borough are Personal Care & Service (99 | 3.6%), Security & Protection (79 | 2.9%), Cleaning & Maintenance (43 | 1.6%), Firefighting & Prevention (42 | 1.5%), and Law Enforcement (37 | 1.3%).
Services Occupations by Sex
Within the Services occupations in Norwood borough, the most male-oriented occupations are Law Enforcement (100.0%), Security & Protection (84.8%), and Firefighting & Prevention (71.4%), while the most female-oriented occupations are Healthcare Support (100.0%), Food Preparation & Serving (100.0%), and Personal Care & Service (89.9%).
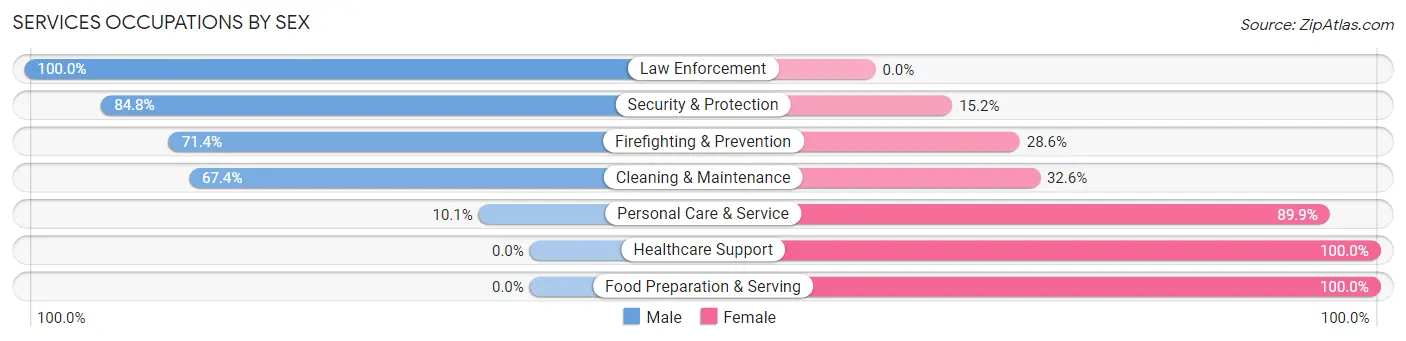
| Occupation | Male | Female |
| Healthcare Support | 0 (0.0%) | 18 (100.0%) |
| Security & Protection | 67 (84.8%) | 12 (15.2%) |
| Firefighting & Prevention | 30 (71.4%) | 12 (28.6%) |
| Law Enforcement | 37 (100.0%) | 0 (0.0%) |
| Food Preparation & Serving | 0 (0.0%) | 19 (100.0%) |
| Cleaning & Maintenance | 29 (67.4%) | 14 (32.6%) |
| Personal Care & Service | 10 (10.1%) | 89 (89.9%) |
| Total (Category) | 106 (41.1%) | 152 (58.9%) |
| Total (Overall) | 1,420 (51.9%) | 1,317 (48.1%) |
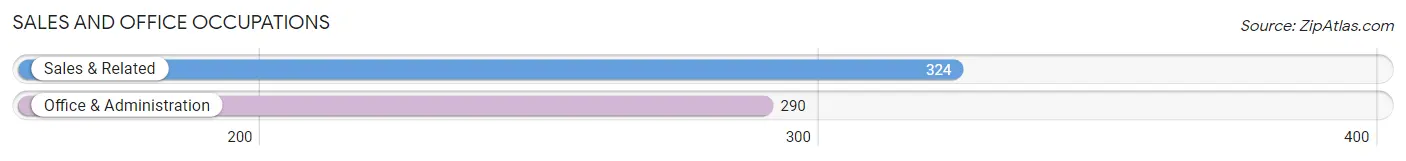
Sales and Office Occupations
The most common Sales and Office occupations in Norwood borough are Sales & Related (324 | 11.8%), and Office & Administration (290 | 10.6%).
Sales and Office Occupations by Sex
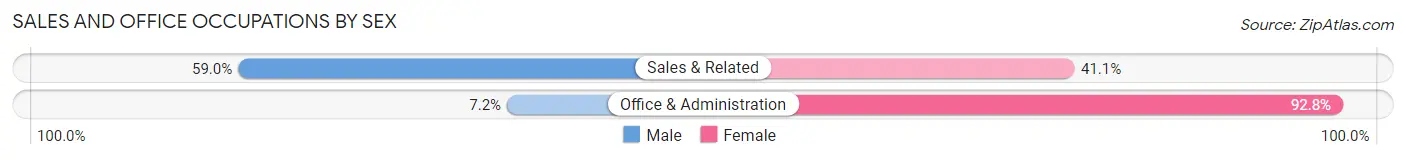
| Occupation | Male | Female |
| Sales & Related | 191 (59.0%) | 133 (41.0%) |
| Office & Administration | 21 (7.2%) | 269 (92.8%) |
| Total (Category) | 212 (34.5%) | 402 (65.5%) |
| Total (Overall) | 1,420 (51.9%) | 1,317 (48.1%) |
Natural Resources, Construction and Maintenance Occupations
The most common Natural Resources, Construction and Maintenance occupations in Norwood borough are Construction & Extraction (52 | 1.9%), and Installation, Maintenance & Repair (42 | 1.5%).
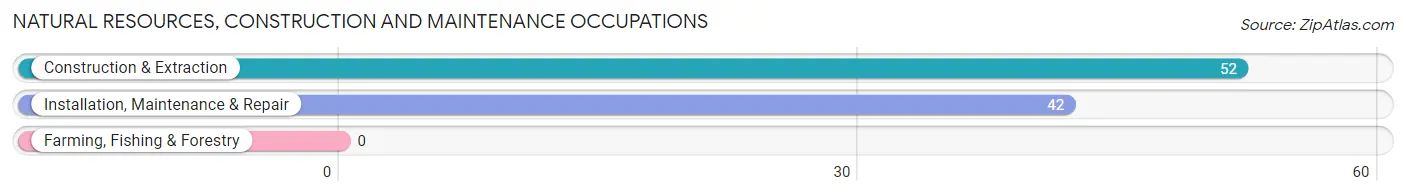
Natural Resources, Construction and Maintenance Occupations by Sex
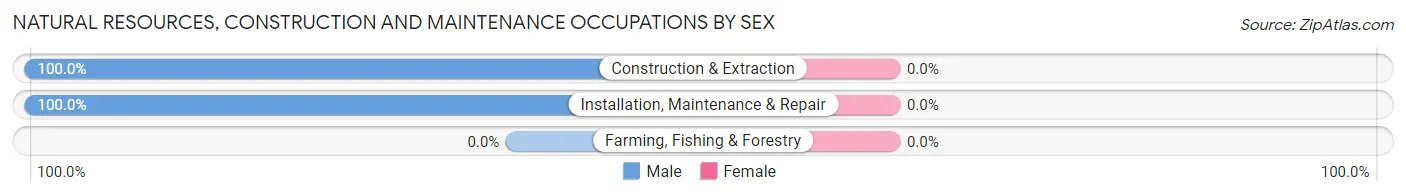
| Occupation | Male | Female |
| Farming, Fishing & Forestry | 0 (0.0%) | 0 (0.0%) |
| Construction & Extraction | 52 (100.0%) | 0 (0.0%) |
| Installation, Maintenance & Repair | 42 (100.0%) | 0 (0.0%) |
| Total (Category) | 94 (100.0%) | 0 (0.0%) |
| Total (Overall) | 1,420 (51.9%) | 1,317 (48.1%) |
Production, Transportation and Moving Occupations
The most common Production, Transportation and Moving occupations in Norwood borough are Production (97 | 3.5%), Transportation (44 | 1.6%), and Material Moving (37 | 1.3%).
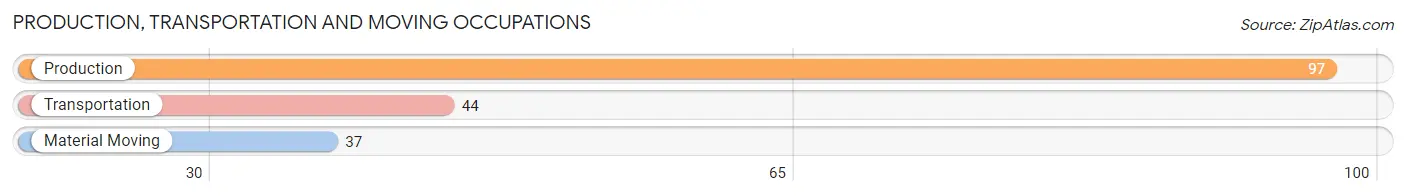
Production, Transportation and Moving Occupations by Sex
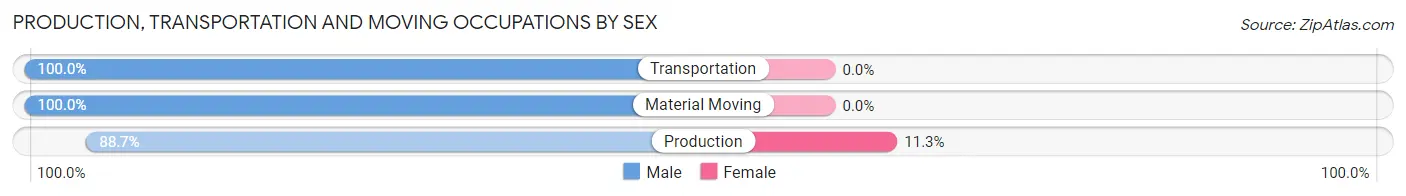
| Occupation | Male | Female |
| Production | 86 (88.7%) | 11 (11.3%) |
| Transportation | 44 (100.0%) | 0 (0.0%) |
| Material Moving | 37 (100.0%) | 0 (0.0%) |
| Total (Category) | 167 (93.8%) | 11 (6.2%) |
| Total (Overall) | 1,420 (51.9%) | 1,317 (48.1%) |
Employment Industries by Sex in Norwood borough
Employment Industries in Norwood borough
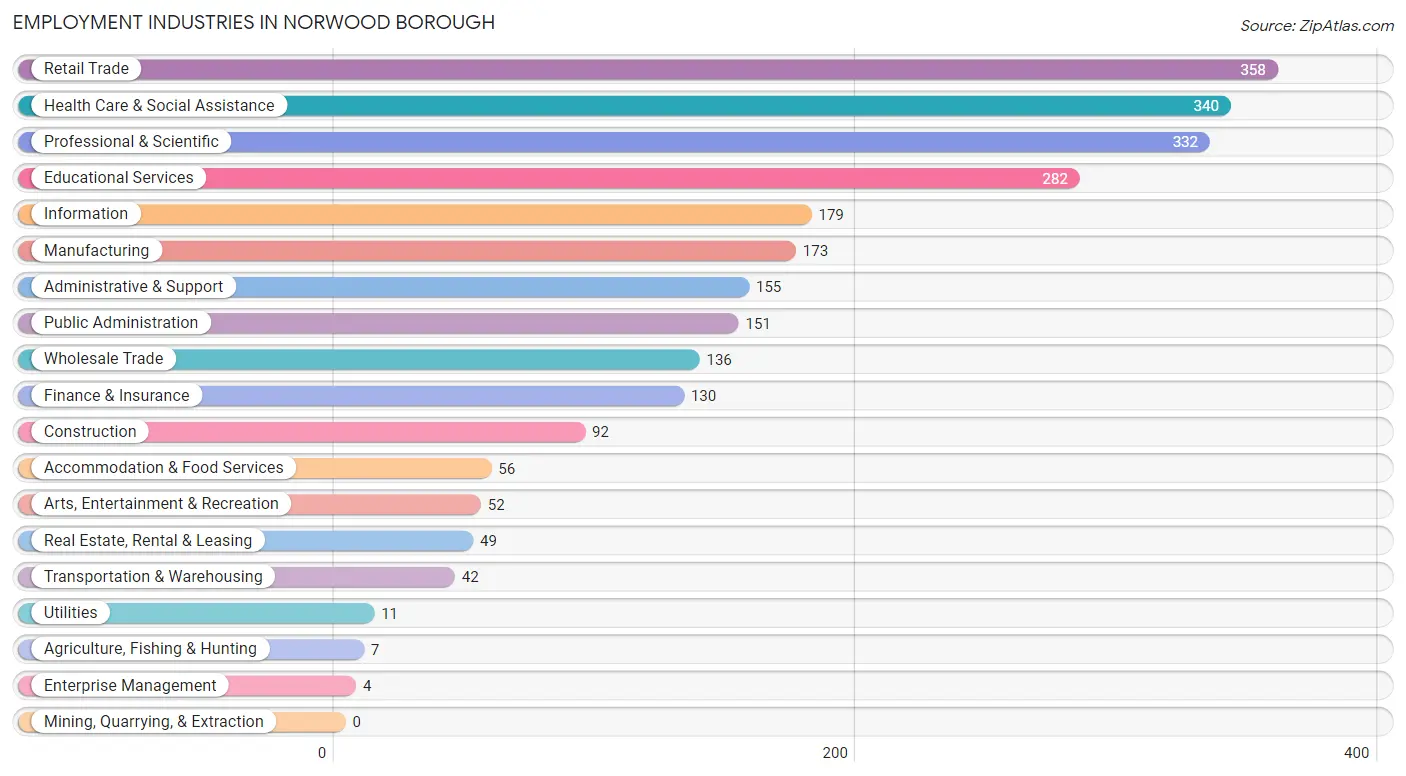
The major employment industries in Norwood borough include Retail Trade (358 | 13.1%), Health Care & Social Assistance (340 | 12.4%), Professional & Scientific (332 | 12.1%), Educational Services (282 | 10.3%), and Information (179 | 6.5%).
Employment Industries by Sex in Norwood borough
The Norwood borough industries that see more men than women are Agriculture, Fishing & Hunting (100.0%), Construction (100.0%), and Enterprise Management (100.0%), whereas the industries that tend to have a higher number of women are Utilities (100.0%), Educational Services (84.4%), and Health Care & Social Assistance (82.9%).
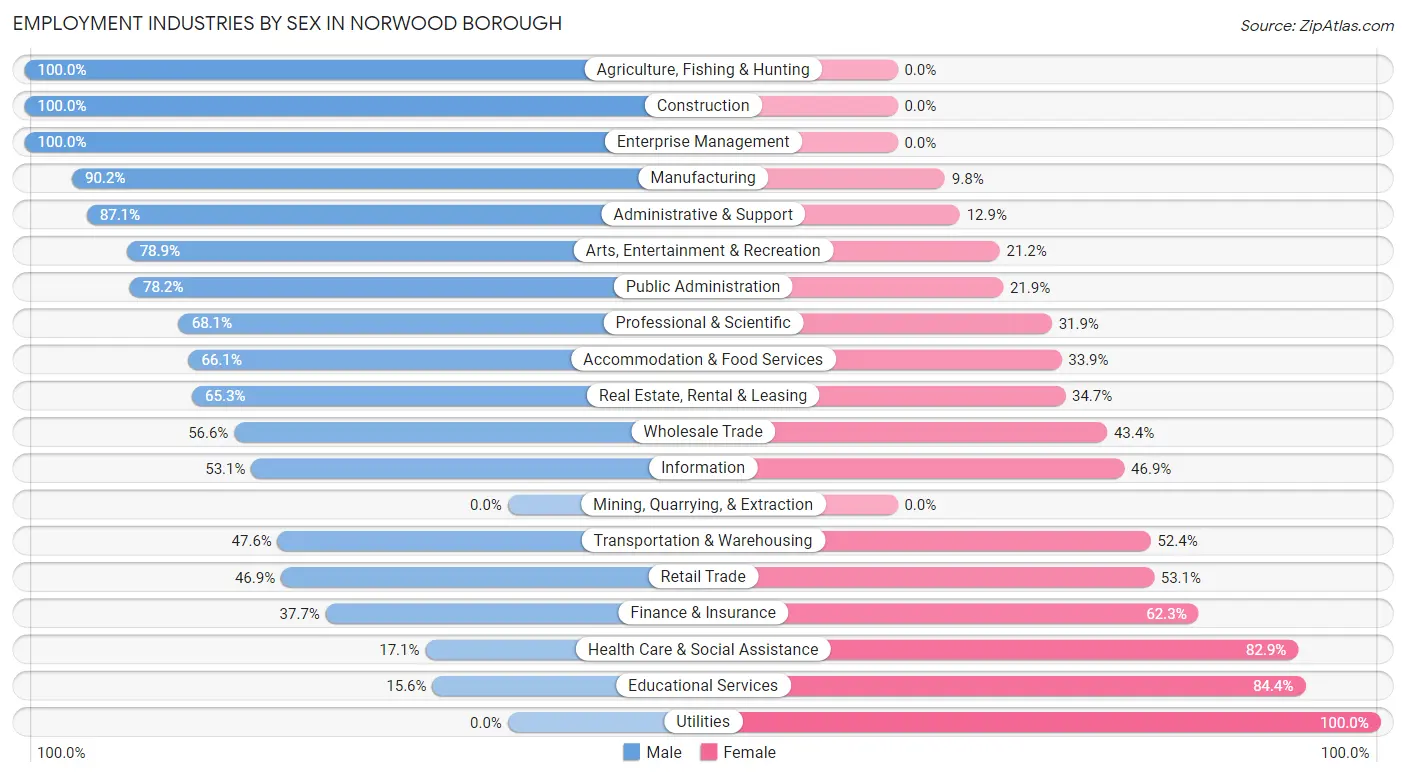
| Industry | Male | Female |
| Agriculture, Fishing & Hunting | 7 (100.0%) | 0 (0.0%) |
| Mining, Quarrying, & Extraction | 0 (0.0%) | 0 (0.0%) |
| Construction | 92 (100.0%) | 0 (0.0%) |
| Manufacturing | 156 (90.2%) | 17 (9.8%) |
| Wholesale Trade | 77 (56.6%) | 59 (43.4%) |
| Retail Trade | 168 (46.9%) | 190 (53.1%) |
| Transportation & Warehousing | 20 (47.6%) | 22 (52.4%) |
| Utilities | 0 (0.0%) | 11 (100.0%) |
| Information | 95 (53.1%) | 84 (46.9%) |
| Finance & Insurance | 49 (37.7%) | 81 (62.3%) |
| Real Estate, Rental & Leasing | 32 (65.3%) | 17 (34.7%) |
| Professional & Scientific | 226 (68.1%) | 106 (31.9%) |
| Enterprise Management | 4 (100.0%) | 0 (0.0%) |
| Administrative & Support | 135 (87.1%) | 20 (12.9%) |
| Educational Services | 44 (15.6%) | 238 (84.4%) |
| Health Care & Social Assistance | 58 (17.1%) | 282 (82.9%) |
| Arts, Entertainment & Recreation | 41 (78.8%) | 11 (21.1%) |
| Accommodation & Food Services | 37 (66.1%) | 19 (33.9%) |
| Public Administration | 118 (78.1%) | 33 (21.8%) |
| Total | 1,420 (51.9%) | 1,317 (48.1%) |
Education in Norwood borough
School Enrollment in Norwood borough
The most common levels of schooling among the 1,503 students in Norwood borough are high school (412 | 27.4%), middle school (386 | 25.7%), and elementary school (292 | 19.4%).
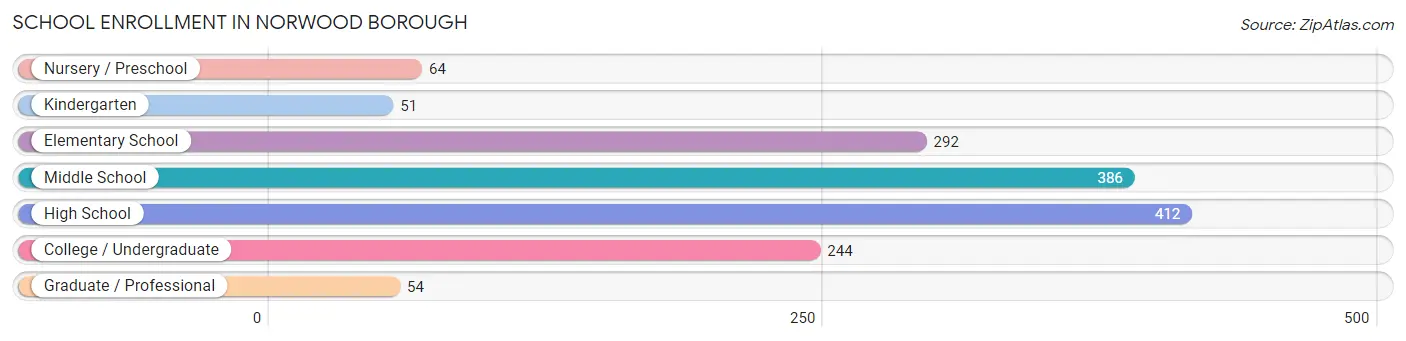
| School Level | # Students | % Students |
| Nursery / Preschool | 64 | 4.3% |
| Kindergarten | 51 | 3.4% |
| Elementary School | 292 | 19.4% |
| Middle School | 386 | 25.7% |
| High School | 412 | 27.4% |
| College / Undergraduate | 244 | 16.2% |
| Graduate / Professional | 54 | 3.6% |
| Total | 1,503 | 100.0% |
School Enrollment by Age by Funding Source in Norwood borough
Out of a total of 1,503 students who are enrolled in schools in Norwood borough, 259 (17.2%) attend a private institution, while the remaining 1,244 (82.8%) are enrolled in public schools. The age group of 3 to 4 year olds has the highest likelihood of being enrolled in private schools, with 31 (66.0% in the age bracket) enrolled. Conversely, the age group of 10 to 14 year olds has the lowest likelihood of being enrolled in a private school, with 412 (100.0% in the age bracket) attending a public institution.
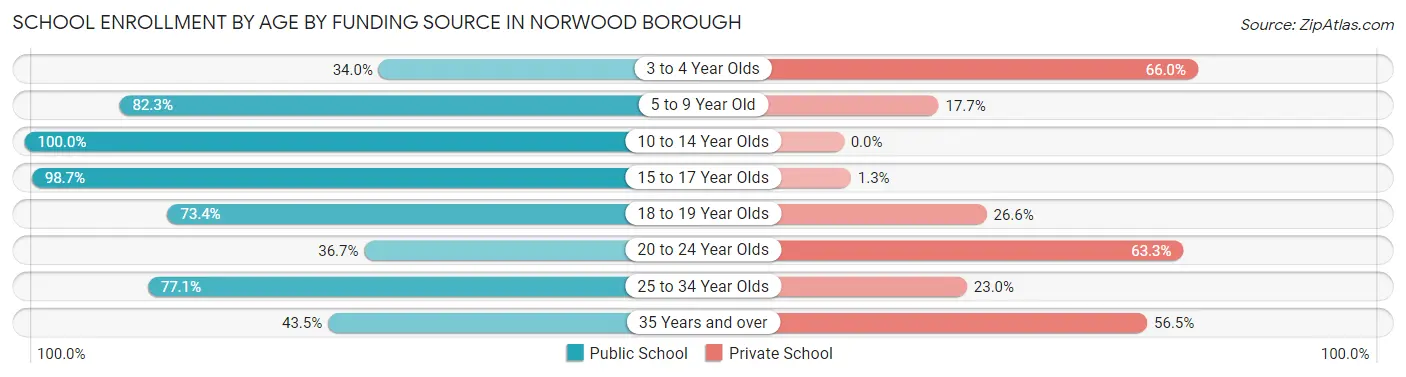
| Age Bracket | Public School | Private School |
| 3 to 4 Year Olds | 16 (34.0%) | 31 (66.0%) |
| 5 to 9 Year Old | 284 (82.3%) | 61 (17.7%) |
| 10 to 14 Year Olds | 412 (100.0%) | 0 (0.0%) |
| 15 to 17 Year Olds | 294 (98.7%) | 4 (1.3%) |
| 18 to 19 Year Olds | 80 (73.4%) | 29 (26.6%) |
| 20 to 24 Year Olds | 54 (36.7%) | 93 (63.3%) |
| 25 to 34 Year Olds | 94 (77.0%) | 28 (23.0%) |
| 35 Years and over | 10 (43.5%) | 13 (56.5%) |
| Total | 1,244 (82.8%) | 259 (17.2%) |
Educational Attainment by Field of Study in Norwood borough
Business (605 | 24.4%), science & technology (302 | 12.2%), literature & languages (258 | 10.4%), social sciences (237 | 9.6%), and education (188 | 7.6%) are the most common fields of study among 2,474 individuals in Norwood borough who have obtained a bachelor's degree or higher.
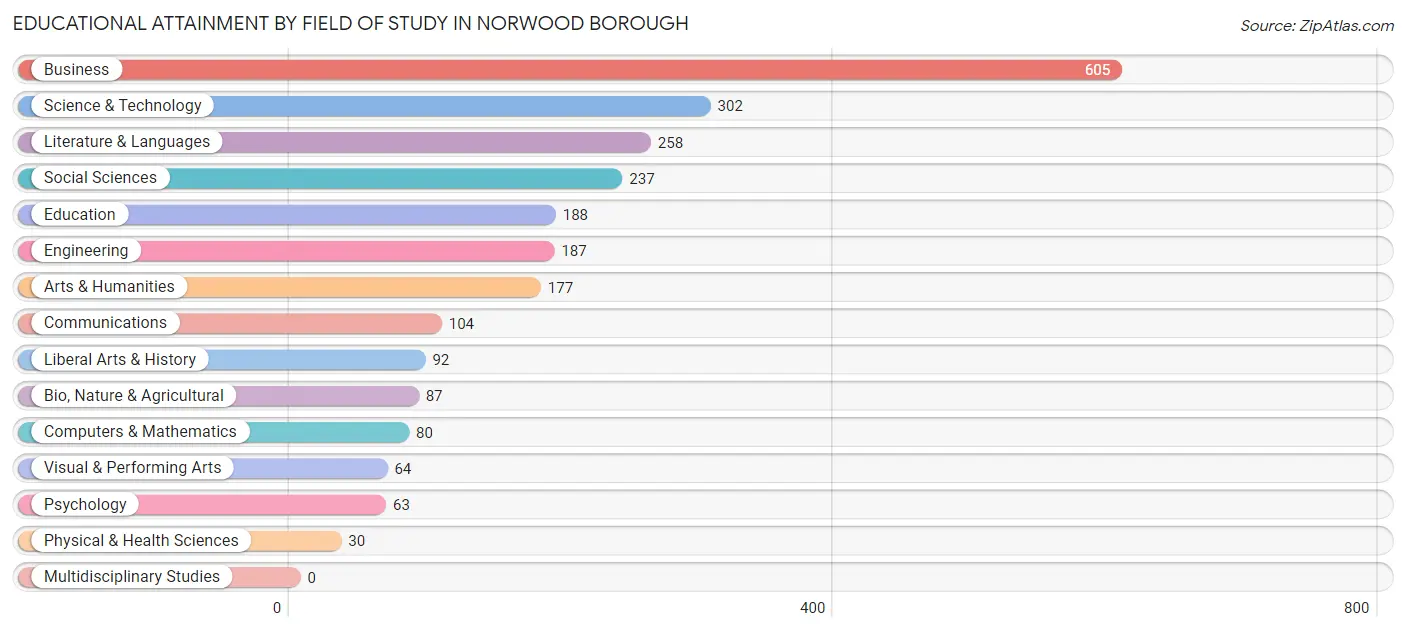
| Field of Study | # Graduates | % Graduates |
| Computers & Mathematics | 80 | 3.2% |
| Bio, Nature & Agricultural | 87 | 3.5% |
| Physical & Health Sciences | 30 | 1.2% |
| Psychology | 63 | 2.5% |
| Social Sciences | 237 | 9.6% |
| Engineering | 187 | 7.6% |
| Multidisciplinary Studies | 0 | 0.0% |
| Science & Technology | 302 | 12.2% |
| Business | 605 | 24.4% |
| Education | 188 | 7.6% |
| Literature & Languages | 258 | 10.4% |
| Liberal Arts & History | 92 | 3.7% |
| Visual & Performing Arts | 64 | 2.6% |
| Communications | 104 | 4.2% |
| Arts & Humanities | 177 | 7.1% |
| Total | 2,474 | 100.0% |
Transportation & Commute in Norwood borough
Vehicle Availability by Sex in Norwood borough
The most prevalent vehicle ownership categories in Norwood borough are males with 2 vehicles (836, accounting for 59.1%) and females with 2 vehicles (629, making up 64.7%).
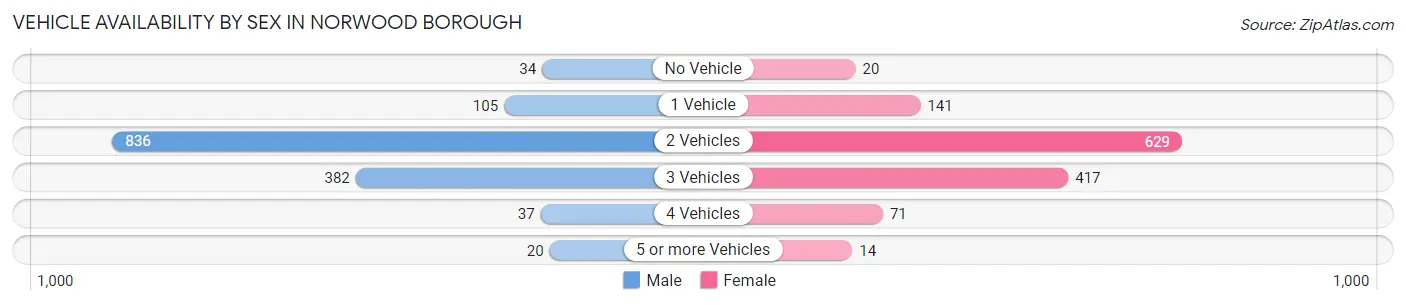
| Vehicles Available | Male | Female |
| No Vehicle | 34 (2.4%) | 20 (1.5%) |
| 1 Vehicle | 105 (7.4%) | 141 (10.9%) |
| 2 Vehicles | 836 (59.1%) | 629 (48.7%) |
| 3 Vehicles | 382 (27.0%) | 417 (32.3%) |
| 4 Vehicles | 37 (2.6%) | 71 (5.5%) |
| 5 or more Vehicles | 20 (1.4%) | 14 (1.1%) |
| Total | 1,414 (100.0%) | 1,292 (100.0%) |
Commute Time in Norwood borough
The most frequently occuring commute durations in Norwood borough are 60 to 89 minutes (408 commuters, 18.2%), 20 to 24 minutes (338 commuters, 15.1%), and 30 to 34 minutes (230 commuters, 10.3%).
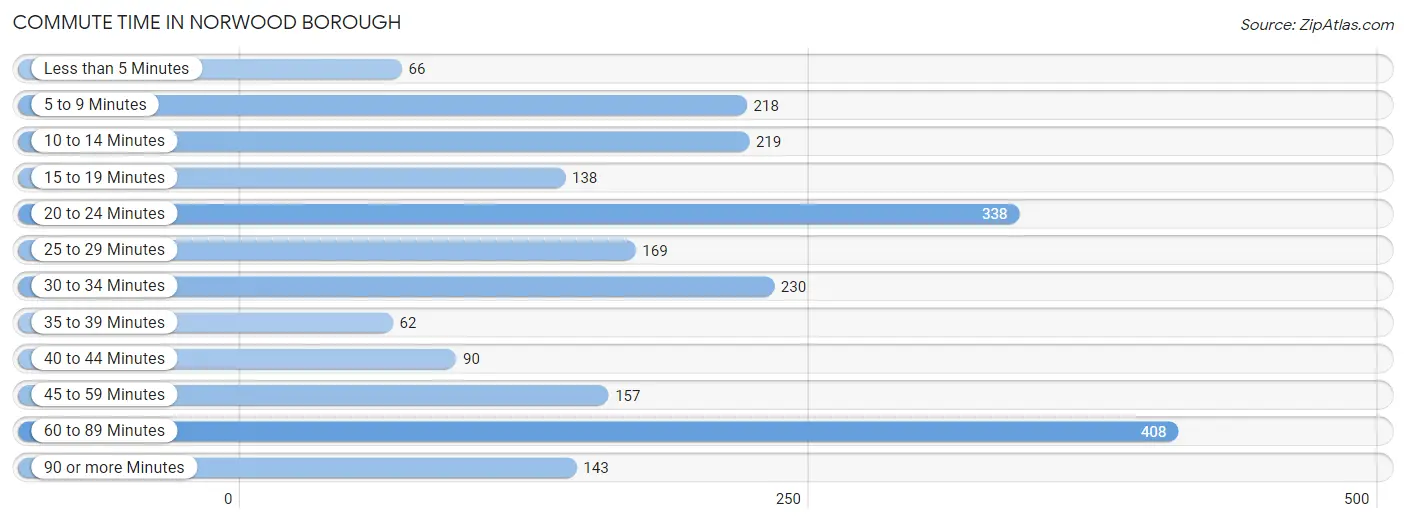
| Commute Time | # Commuters | % Commuters |
| Less than 5 Minutes | 66 | 2.9% |
| 5 to 9 Minutes | 218 | 9.7% |
| 10 to 14 Minutes | 219 | 9.8% |
| 15 to 19 Minutes | 138 | 6.2% |
| 20 to 24 Minutes | 338 | 15.1% |
| 25 to 29 Minutes | 169 | 7.5% |
| 30 to 34 Minutes | 230 | 10.3% |
| 35 to 39 Minutes | 62 | 2.8% |
| 40 to 44 Minutes | 90 | 4.0% |
| 45 to 59 Minutes | 157 | 7.0% |
| 60 to 89 Minutes | 408 | 18.2% |
| 90 or more Minutes | 143 | 6.4% |
Commute Time by Sex in Norwood borough
The most common commute times in Norwood borough are 60 to 89 minutes (295 commuters, 25.2%) for males and 20 to 24 minutes (244 commuters, 22.9%) for females.
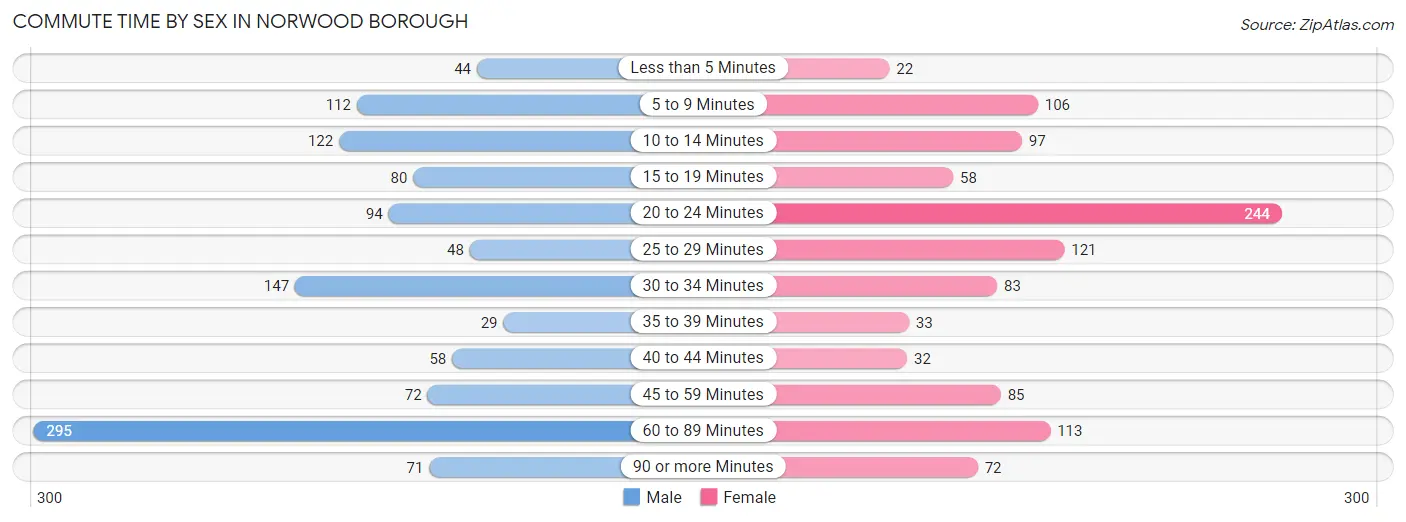
| Commute Time | Male | Female |
| Less than 5 Minutes | 44 (3.7%) | 22 (2.1%) |
| 5 to 9 Minutes | 112 (9.6%) | 106 (9.9%) |
| 10 to 14 Minutes | 122 (10.4%) | 97 (9.1%) |
| 15 to 19 Minutes | 80 (6.8%) | 58 (5.4%) |
| 20 to 24 Minutes | 94 (8.0%) | 244 (22.9%) |
| 25 to 29 Minutes | 48 (4.1%) | 121 (11.4%) |
| 30 to 34 Minutes | 147 (12.5%) | 83 (7.8%) |
| 35 to 39 Minutes | 29 (2.5%) | 33 (3.1%) |
| 40 to 44 Minutes | 58 (5.0%) | 32 (3.0%) |
| 45 to 59 Minutes | 72 (6.1%) | 85 (8.0%) |
| 60 to 89 Minutes | 295 (25.2%) | 113 (10.6%) |
| 90 or more Minutes | 71 (6.1%) | 72 (6.8%) |
Time of Departure to Work by Sex in Norwood borough
The most frequent times of departure to work in Norwood borough are 7:00 AM to 7:29 AM (257, 21.9%) for males and 7:00 AM to 7:29 AM (170, 16.0%) for females.
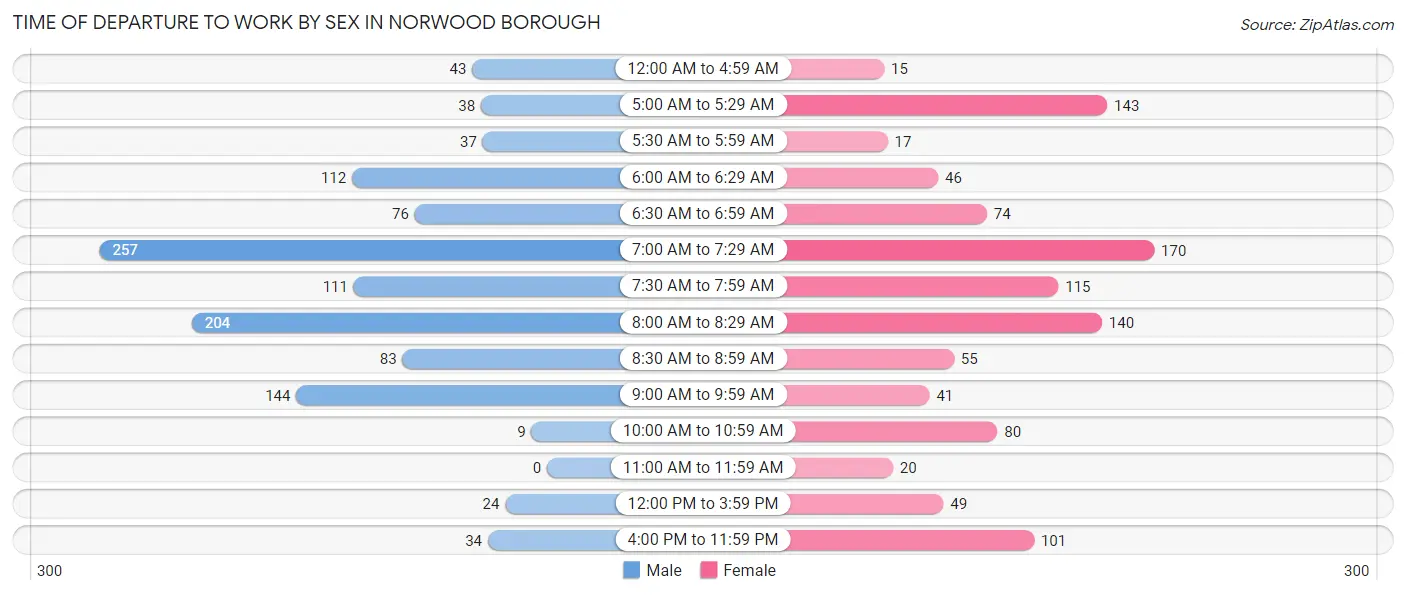
| Time of Departure | Male | Female |
| 12:00 AM to 4:59 AM | 43 (3.7%) | 15 (1.4%) |
| 5:00 AM to 5:29 AM | 38 (3.2%) | 143 (13.4%) |
| 5:30 AM to 5:59 AM | 37 (3.2%) | 17 (1.6%) |
| 6:00 AM to 6:29 AM | 112 (9.6%) | 46 (4.3%) |
| 6:30 AM to 6:59 AM | 76 (6.5%) | 74 (6.9%) |
| 7:00 AM to 7:29 AM | 257 (21.9%) | 170 (16.0%) |
| 7:30 AM to 7:59 AM | 111 (9.5%) | 115 (10.8%) |
| 8:00 AM to 8:29 AM | 204 (17.4%) | 140 (13.1%) |
| 8:30 AM to 8:59 AM | 83 (7.1%) | 55 (5.2%) |
| 9:00 AM to 9:59 AM | 144 (12.3%) | 41 (3.8%) |
| 10:00 AM to 10:59 AM | 9 (0.8%) | 80 (7.5%) |
| 11:00 AM to 11:59 AM | 0 (0.0%) | 20 (1.9%) |
| 12:00 PM to 3:59 PM | 24 (2.1%) | 49 (4.6%) |
| 4:00 PM to 11:59 PM | 34 (2.9%) | 101 (9.5%) |
| Total | 1,172 (100.0%) | 1,066 (100.0%) |
Housing Occupancy in Norwood borough
Occupancy by Ownership in Norwood borough
Of the total 1,964 dwellings in Norwood borough, owner-occupied units account for 1,667 (84.9%), while renter-occupied units make up 297 (15.1%).
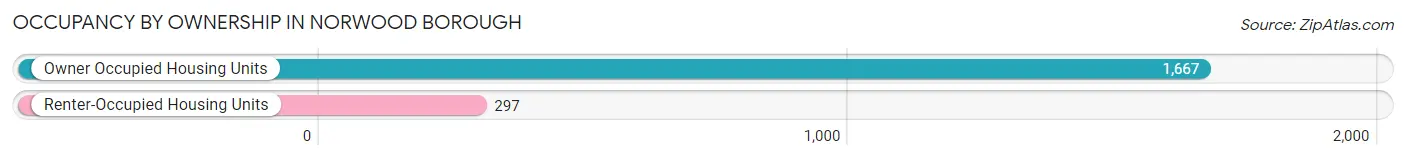
| Occupancy | # Housing Units | % Housing Units |
| Owner Occupied Housing Units | 1,667 | 84.9% |
| Renter-Occupied Housing Units | 297 | 15.1% |
| Total Occupied Housing Units | 1,964 | 100.0% |
Occupancy by Household Size in Norwood borough
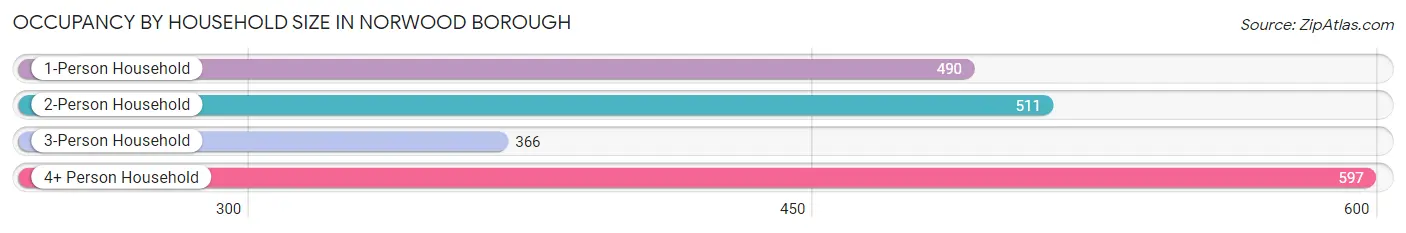
| Household Size | # Housing Units | % Housing Units |
| 1-Person Household | 490 | 24.9% |
| 2-Person Household | 511 | 26.0% |
| 3-Person Household | 366 | 18.6% |
| 4+ Person Household | 597 | 30.4% |
| Total Housing Units | 1,964 | 100.0% |
Occupancy by Ownership by Household Size in Norwood borough
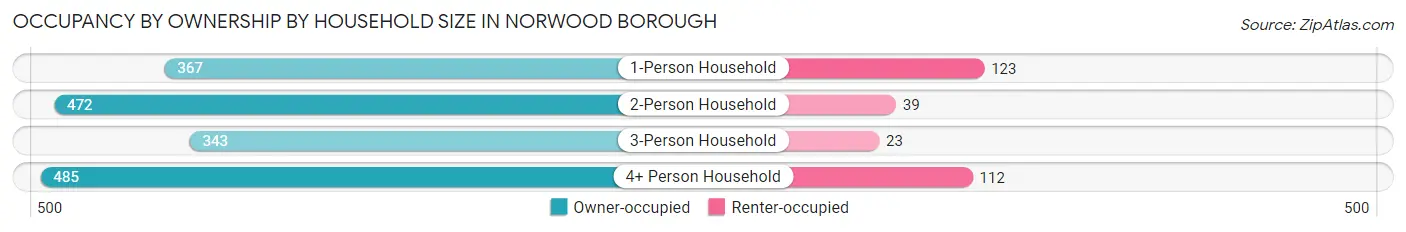
| Household Size | Owner-occupied | Renter-occupied |
| 1-Person Household | 367 (74.9%) | 123 (25.1%) |
| 2-Person Household | 472 (92.4%) | 39 (7.6%) |
| 3-Person Household | 343 (93.7%) | 23 (6.3%) |
| 4+ Person Household | 485 (81.2%) | 112 (18.8%) |
| Total Housing Units | 1,667 (84.9%) | 297 (15.1%) |
Occupancy by Educational Attainment in Norwood borough
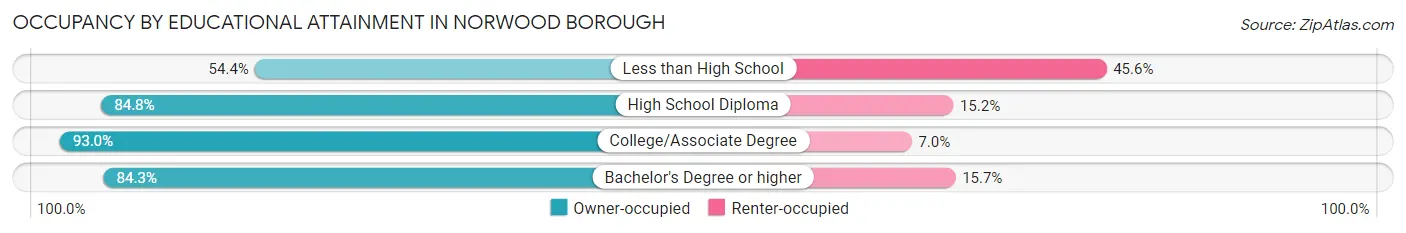
| Household Size | Owner-occupied | Renter-occupied |
| Less than High School | 31 (54.4%) | 26 (45.6%) |
| High School Diploma | 345 (84.8%) | 62 (15.2%) |
| College/Associate Degree | 279 (93.0%) | 21 (7.0%) |
| Bachelor's Degree or higher | 1,012 (84.3%) | 188 (15.7%) |
Occupancy by Age of Householder in Norwood borough
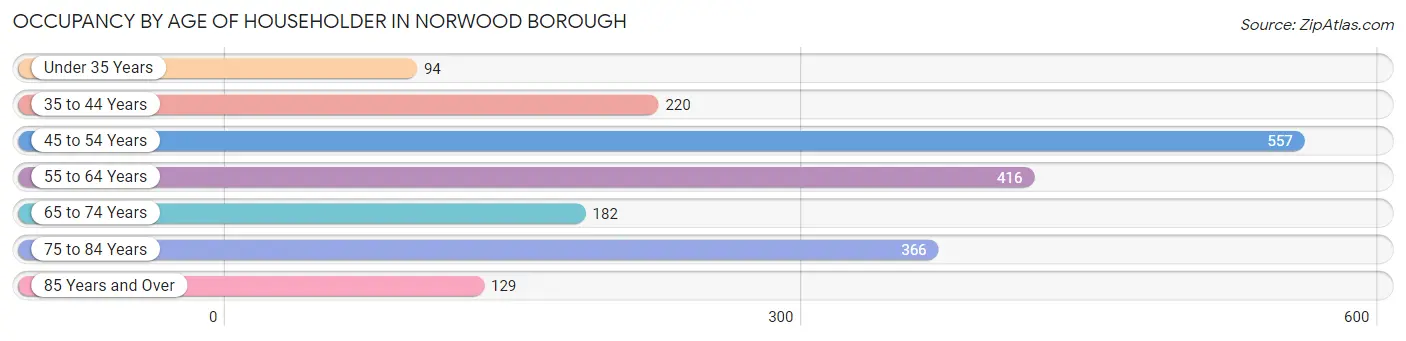
| Age Bracket | # Households | % Households |
| Under 35 Years | 94 | 4.8% |
| 35 to 44 Years | 220 | 11.2% |
| 45 to 54 Years | 557 | 28.4% |
| 55 to 64 Years | 416 | 21.2% |
| 65 to 74 Years | 182 | 9.3% |
| 75 to 84 Years | 366 | 18.6% |
| 85 Years and Over | 129 | 6.6% |
| Total | 1,964 | 100.0% |
Housing Finances in Norwood borough
Median Income by Occupancy in Norwood borough
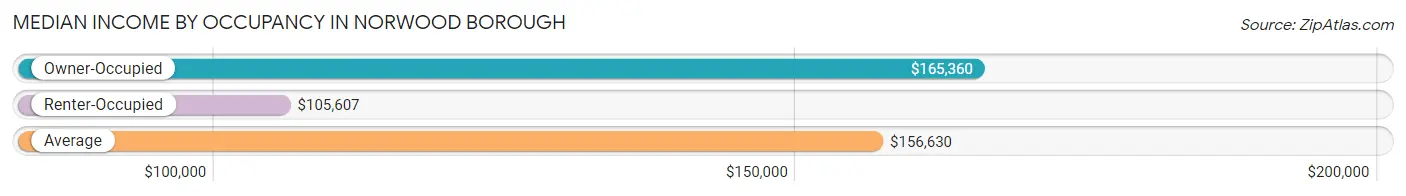
| Occupancy Type | # Households | Median Income |
| Owner-Occupied | 1,667 (84.9%) | $165,360 |
| Renter-Occupied | 297 (15.1%) | $105,607 |
| Average | 1,964 (100.0%) | $156,630 |
Occupancy by Householder Income Bracket in Norwood borough
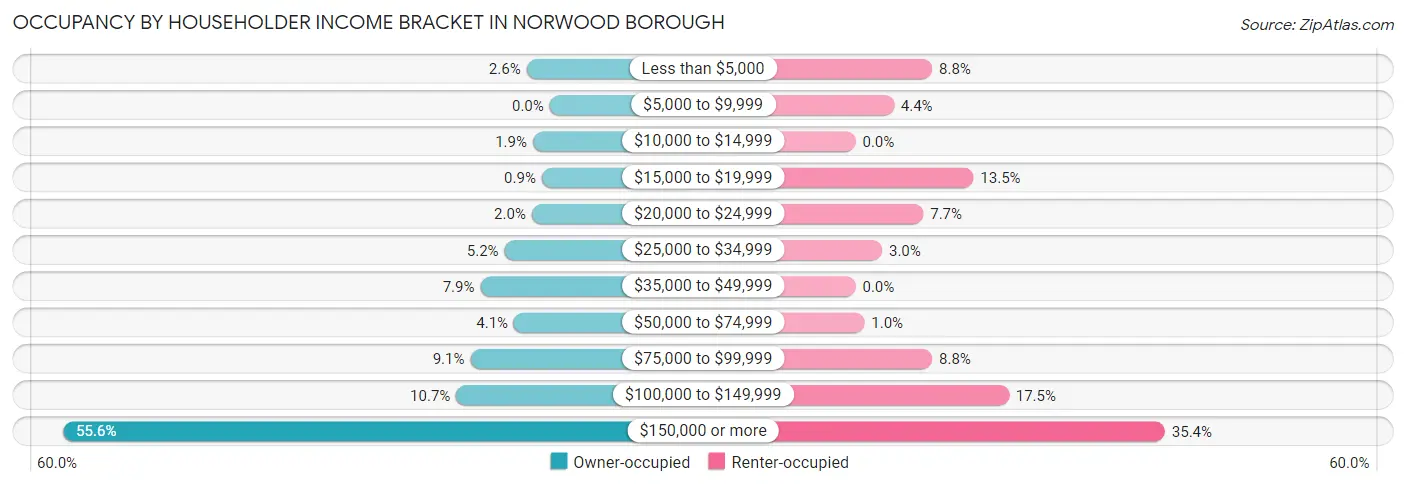
| Income Bracket | Owner-occupied | Renter-occupied |
| Less than $5,000 | 44 (2.6%) | 26 (8.7%) |
| $5,000 to $9,999 | 0 (0.0%) | 13 (4.4%) |
| $10,000 to $14,999 | 32 (1.9%) | 0 (0.0%) |
| $15,000 to $19,999 | 15 (0.9%) | 40 (13.5%) |
| $20,000 to $24,999 | 34 (2.0%) | 23 (7.7%) |
| $25,000 to $34,999 | 86 (5.2%) | 9 (3.0%) |
| $35,000 to $49,999 | 132 (7.9%) | 0 (0.0%) |
| $50,000 to $74,999 | 68 (4.1%) | 3 (1.0%) |
| $75,000 to $99,999 | 151 (9.1%) | 26 (8.7%) |
| $100,000 to $149,999 | 178 (10.7%) | 52 (17.5%) |
| $150,000 or more | 927 (55.6%) | 105 (35.3%) |
| Total | 1,667 (100.0%) | 297 (100.0%) |
Monthly Housing Cost Tiers in Norwood borough
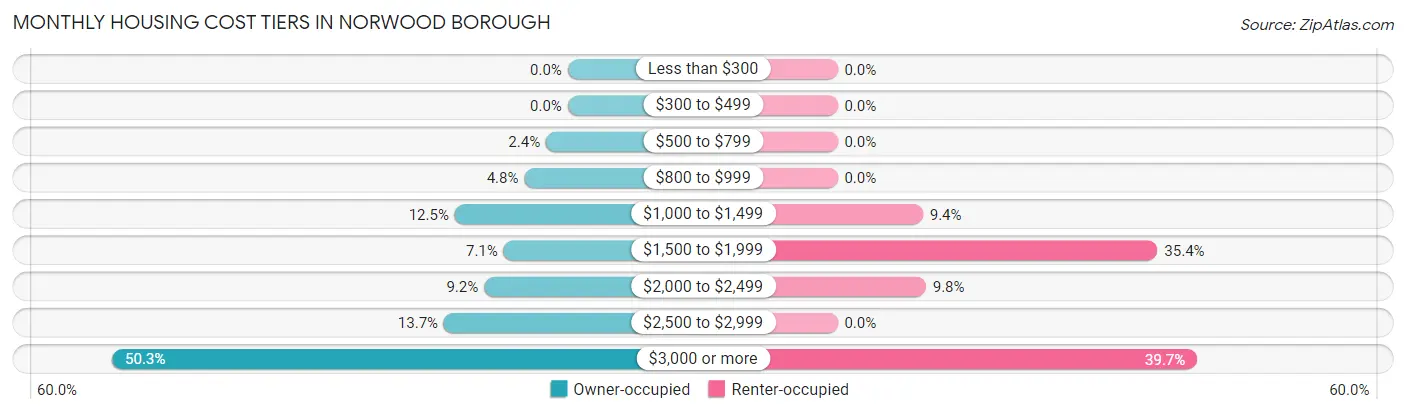
| Monthly Cost | Owner-occupied | Renter-occupied |
| Less than $300 | 0 (0.0%) | 0 (0.0%) |
| $300 to $499 | 0 (0.0%) | 0 (0.0%) |
| $500 to $799 | 40 (2.4%) | 0 (0.0%) |
| $800 to $999 | 80 (4.8%) | 0 (0.0%) |
| $1,000 to $1,499 | 208 (12.5%) | 28 (9.4%) |
| $1,500 to $1,999 | 118 (7.1%) | 105 (35.3%) |
| $2,000 to $2,499 | 154 (9.2%) | 29 (9.8%) |
| $2,500 to $2,999 | 228 (13.7%) | 0 (0.0%) |
| $3,000 or more | 839 (50.3%) | 118 (39.7%) |
| Total | 1,667 (100.0%) | 297 (100.0%) |
Physical Housing Characteristics in Norwood borough
Housing Structures in Norwood borough
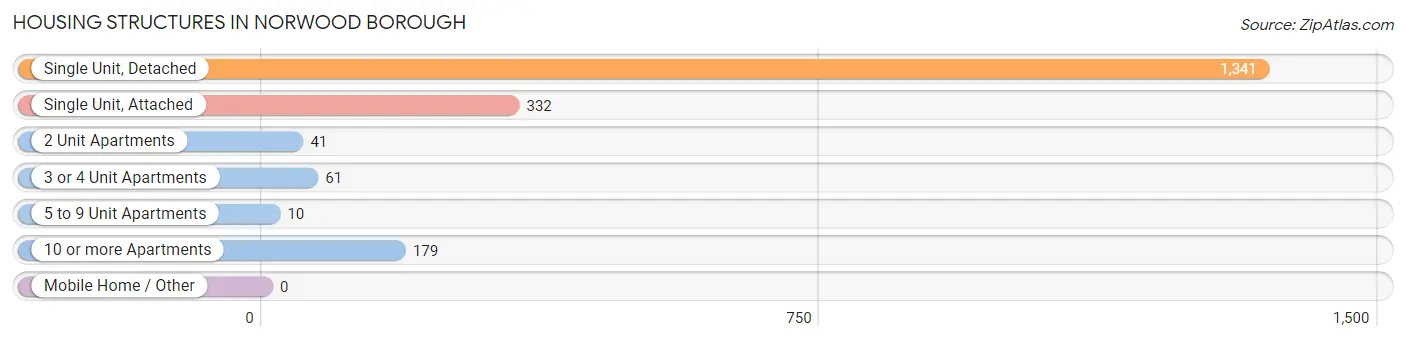
| Structure Type | # Housing Units | % Housing Units |
| Single Unit, Detached | 1,341 | 68.3% |
| Single Unit, Attached | 332 | 16.9% |
| 2 Unit Apartments | 41 | 2.1% |
| 3 or 4 Unit Apartments | 61 | 3.1% |
| 5 to 9 Unit Apartments | 10 | 0.5% |
| 10 or more Apartments | 179 | 9.1% |
| Mobile Home / Other | 0 | 0.0% |
| Total | 1,964 | 100.0% |
Housing Structures by Occupancy in Norwood borough
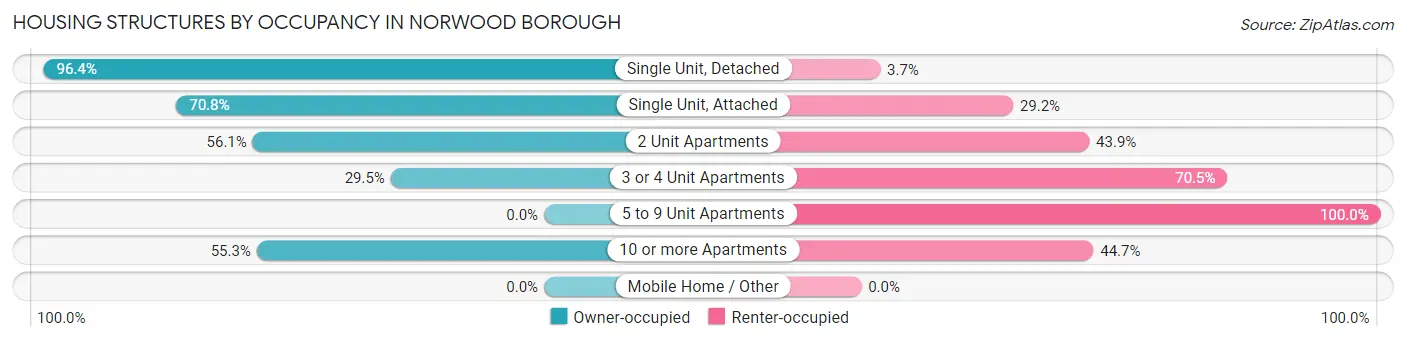
| Structure Type | Owner-occupied | Renter-occupied |
| Single Unit, Detached | 1,292 (96.4%) | 49 (3.6%) |
| Single Unit, Attached | 235 (70.8%) | 97 (29.2%) |
| 2 Unit Apartments | 23 (56.1%) | 18 (43.9%) |
| 3 or 4 Unit Apartments | 18 (29.5%) | 43 (70.5%) |
| 5 to 9 Unit Apartments | 0 (0.0%) | 10 (100.0%) |
| 10 or more Apartments | 99 (55.3%) | 80 (44.7%) |
| Mobile Home / Other | 0 (0.0%) | 0 (0.0%) |
| Total | 1,667 (84.9%) | 297 (15.1%) |
Housing Structures by Number of Rooms in Norwood borough
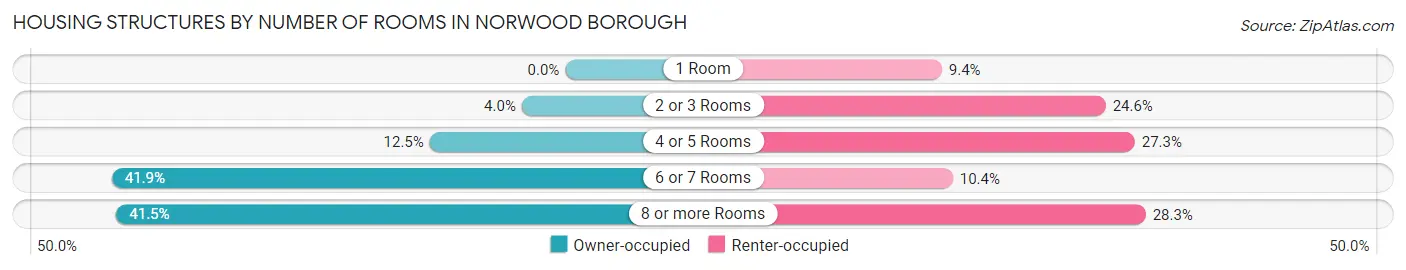
| Number of Rooms | Owner-occupied | Renter-occupied |
| 1 Room | 0 (0.0%) | 28 (9.4%) |
| 2 or 3 Rooms | 67 (4.0%) | 73 (24.6%) |
| 4 or 5 Rooms | 209 (12.5%) | 81 (27.3%) |
| 6 or 7 Rooms | 699 (41.9%) | 31 (10.4%) |
| 8 or more Rooms | 692 (41.5%) | 84 (28.3%) |
| Total | 1,667 (100.0%) | 297 (100.0%) |
Housing Structure by Heating Type in Norwood borough
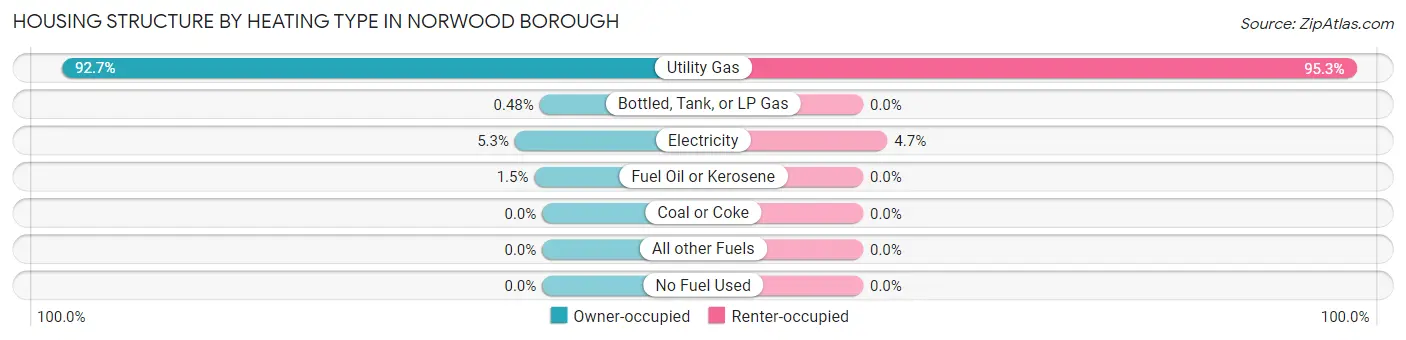
| Heating Type | Owner-occupied | Renter-occupied |
| Utility Gas | 1,546 (92.7%) | 283 (95.3%) |
| Bottled, Tank, or LP Gas | 8 (0.5%) | 0 (0.0%) |
| Electricity | 88 (5.3%) | 14 (4.7%) |
| Fuel Oil or Kerosene | 25 (1.5%) | 0 (0.0%) |
| Coal or Coke | 0 (0.0%) | 0 (0.0%) |
| All other Fuels | 0 (0.0%) | 0 (0.0%) |
| No Fuel Used | 0 (0.0%) | 0 (0.0%) |
| Total | 1,667 (100.0%) | 297 (100.0%) |
Household Vehicle Usage in Norwood borough
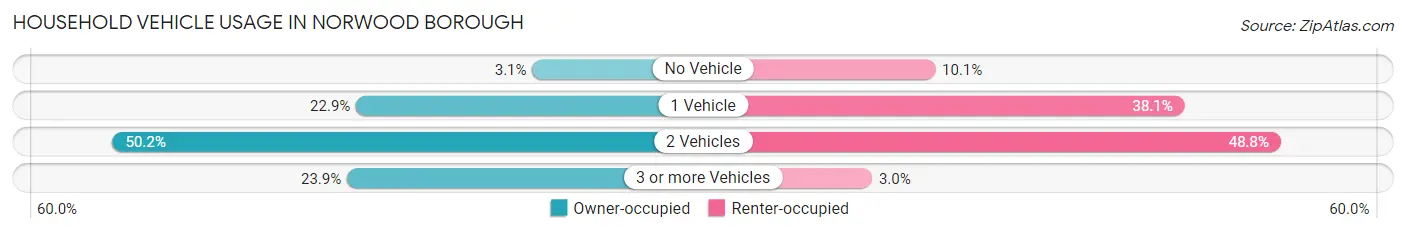
| Vehicles per Household | Owner-occupied | Renter-occupied |
| No Vehicle | 52 (3.1%) | 30 (10.1%) |
| 1 Vehicle | 381 (22.9%) | 113 (38.1%) |
| 2 Vehicles | 836 (50.1%) | 145 (48.8%) |
| 3 or more Vehicles | 398 (23.9%) | 9 (3.0%) |
| Total | 1,667 (100.0%) | 297 (100.0%) |
Real Estate & Mortgages in Norwood borough
Real Estate and Mortgage Overview in Norwood borough
| Characteristic | Without Mortgage | With Mortgage |
| Housing Units | 525 | 1,142 |
| Median Property Value | $553,100 | $679,100 |
| Median Household Income | $79,632 | $733 |
| Monthly Housing Costs | $1,430 | $813 |
| Real Estate Taxes | $10,001 | $0 |
Property Value by Mortgage Status in Norwood borough
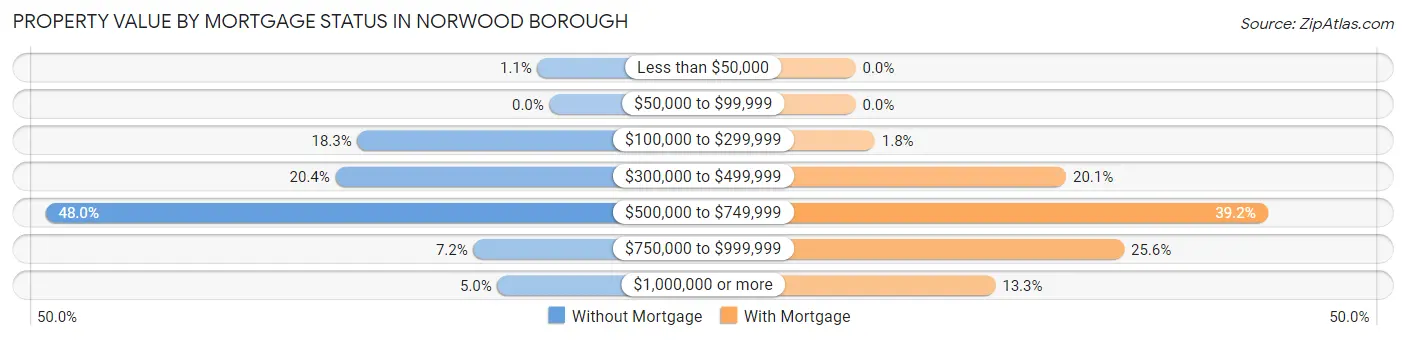
| Property Value | Without Mortgage | With Mortgage |
| Less than $50,000 | 6 (1.1%) | 0 (0.0%) |
| $50,000 to $99,999 | 0 (0.0%) | 0 (0.0%) |
| $100,000 to $299,999 | 96 (18.3%) | 21 (1.8%) |
| $300,000 to $499,999 | 107 (20.4%) | 229 (20.1%) |
| $500,000 to $749,999 | 252 (48.0%) | 448 (39.2%) |
| $750,000 to $999,999 | 38 (7.2%) | 292 (25.6%) |
| $1,000,000 or more | 26 (5.0%) | 152 (13.3%) |
| Total | 525 (100.0%) | 1,142 (100.0%) |
Household Income by Mortgage Status in Norwood borough
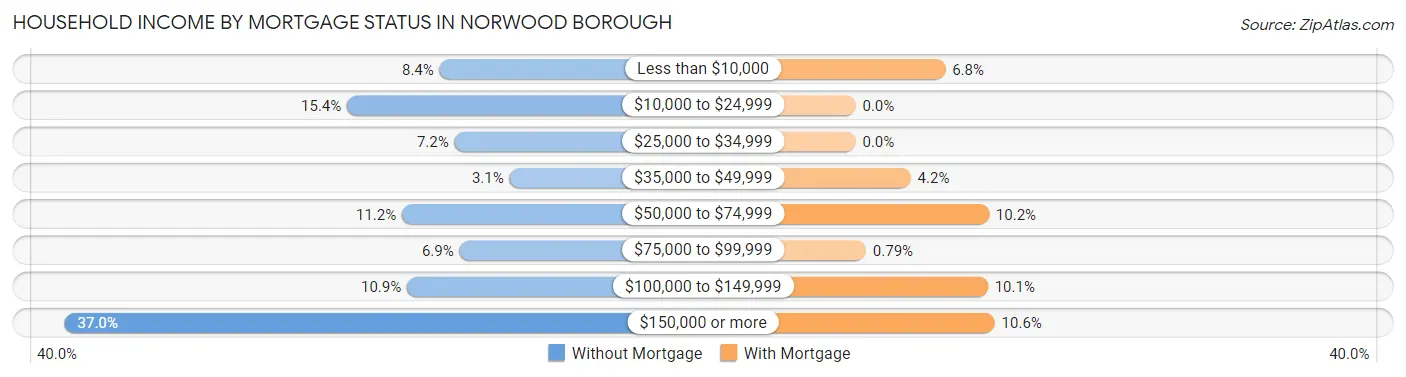
| Household Income | Without Mortgage | With Mortgage |
| Less than $10,000 | 44 (8.4%) | 78 (6.8%) |
| $10,000 to $24,999 | 81 (15.4%) | 0 (0.0%) |
| $25,000 to $34,999 | 38 (7.2%) | 0 (0.0%) |
| $35,000 to $49,999 | 16 (3.0%) | 48 (4.2%) |
| $50,000 to $74,999 | 59 (11.2%) | 116 (10.2%) |
| $75,000 to $99,999 | 36 (6.9%) | 9 (0.8%) |
| $100,000 to $149,999 | 57 (10.9%) | 115 (10.1%) |
| $150,000 or more | 194 (36.9%) | 121 (10.6%) |
| Total | 525 (100.0%) | 1,142 (100.0%) |
Property Value to Household Income Ratio in Norwood borough
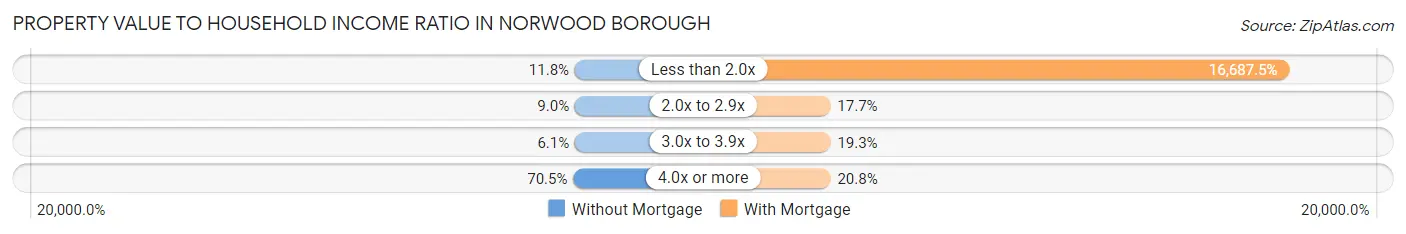
| Value-to-Income Ratio | Without Mortgage | With Mortgage |
| Less than 2.0x | 62 (11.8%) | 190,571 (16,687.5%) |
| 2.0x to 2.9x | 47 (8.9%) | 202 (17.7%) |
| 3.0x to 3.9x | 32 (6.1%) | 220 (19.3%) |
| 4.0x or more | 370 (70.5%) | 238 (20.8%) |
| Total | 525 (100.0%) | 1,142 (100.0%) |
Real Estate Taxes by Mortgage Status in Norwood borough
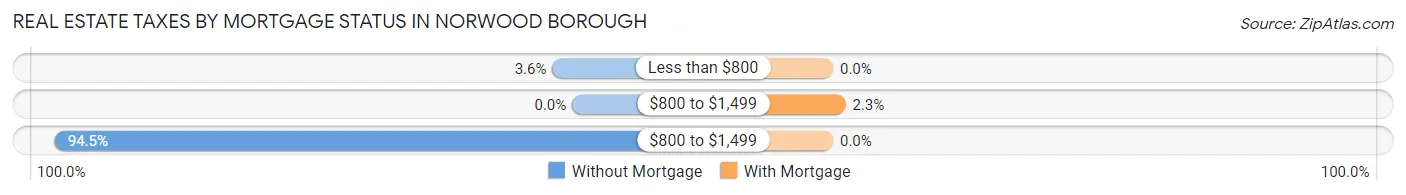
| Property Taxes | Without Mortgage | With Mortgage |
| Less than $800 | 19 (3.6%) | 0 (0.0%) |
| $800 to $1,499 | 0 (0.0%) | 26 (2.3%) |
| $800 to $1,499 | 496 (94.5%) | 0 (0.0%) |
| Total | 525 (100.0%) | 1,142 (100.0%) |
Health & Disability in Norwood borough
Health Insurance Coverage by Age in Norwood borough
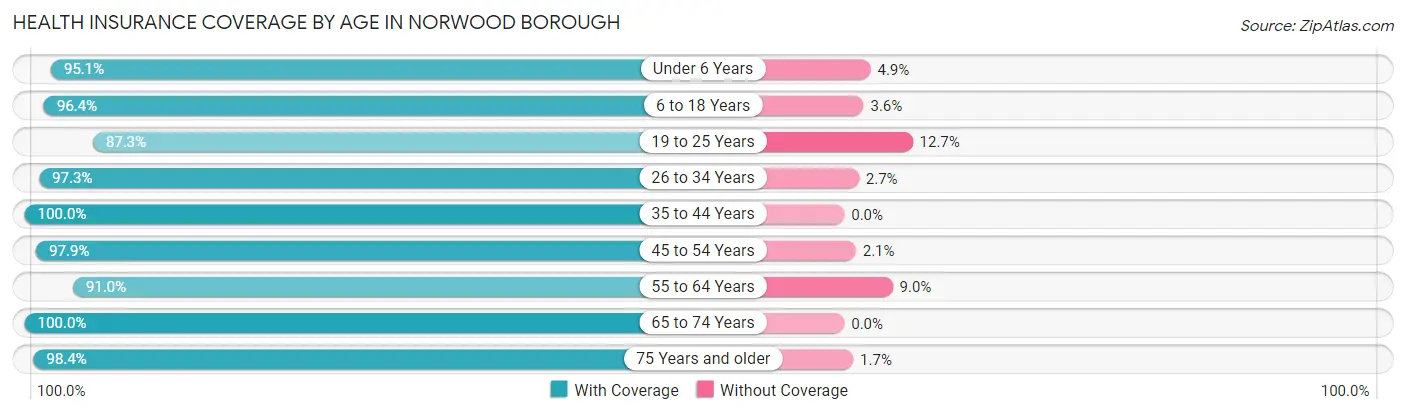
| Age Bracket | With Coverage | Without Coverage |
| Under 6 Years | 175 (95.1%) | 9 (4.9%) |
| 6 to 18 Years | 1,073 (96.4%) | 40 (3.6%) |
| 19 to 25 Years | 459 (87.3%) | 67 (12.7%) |
| 26 to 34 Years | 359 (97.3%) | 10 (2.7%) |
| 35 to 44 Years | 451 (100.0%) | 0 (0.0%) |
| 45 to 54 Years | 867 (97.9%) | 19 (2.1%) |
| 55 to 64 Years | 789 (91.0%) | 78 (9.0%) |
| 65 to 74 Years | 363 (100.0%) | 0 (0.0%) |
| 75 Years and older | 716 (98.4%) | 12 (1.7%) |
| Total | 5,252 (95.7%) | 235 (4.3%) |
Health Insurance Coverage by Citizenship Status in Norwood borough
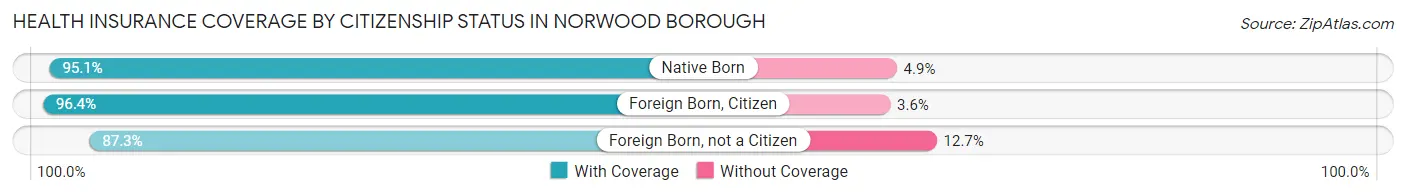
| Citizenship Status | With Coverage | Without Coverage |
| Native Born | 175 (95.1%) | 9 (4.9%) |
| Foreign Born, Citizen | 1,073 (96.4%) | 40 (3.6%) |
| Foreign Born, not a Citizen | 459 (87.3%) | 67 (12.7%) |
Health Insurance Coverage by Household Income in Norwood borough
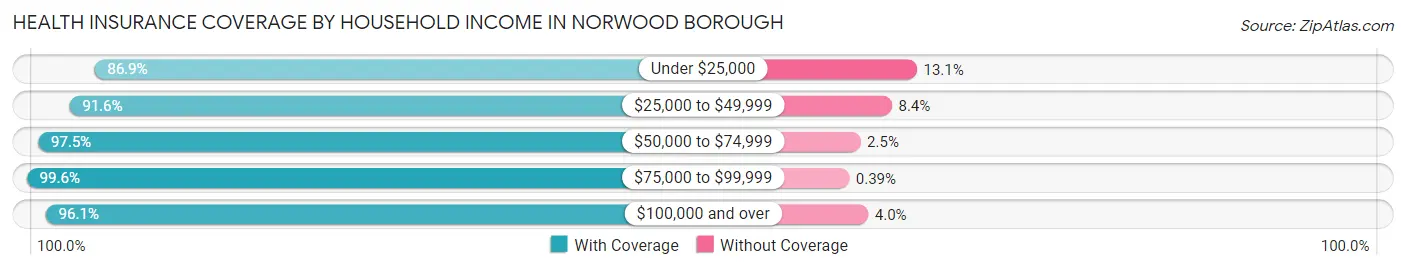
| Household Income | With Coverage | Without Coverage |
| Under $25,000 | 213 (86.9%) | 32 (13.1%) |
| $25,000 to $49,999 | 317 (91.6%) | 29 (8.4%) |
| $50,000 to $74,999 | 117 (97.5%) | 3 (2.5%) |
| $75,000 to $99,999 | 506 (99.6%) | 2 (0.4%) |
| $100,000 and over | 4,089 (96.1%) | 168 (4.0%) |
Public vs Private Health Insurance Coverage by Age in Norwood borough
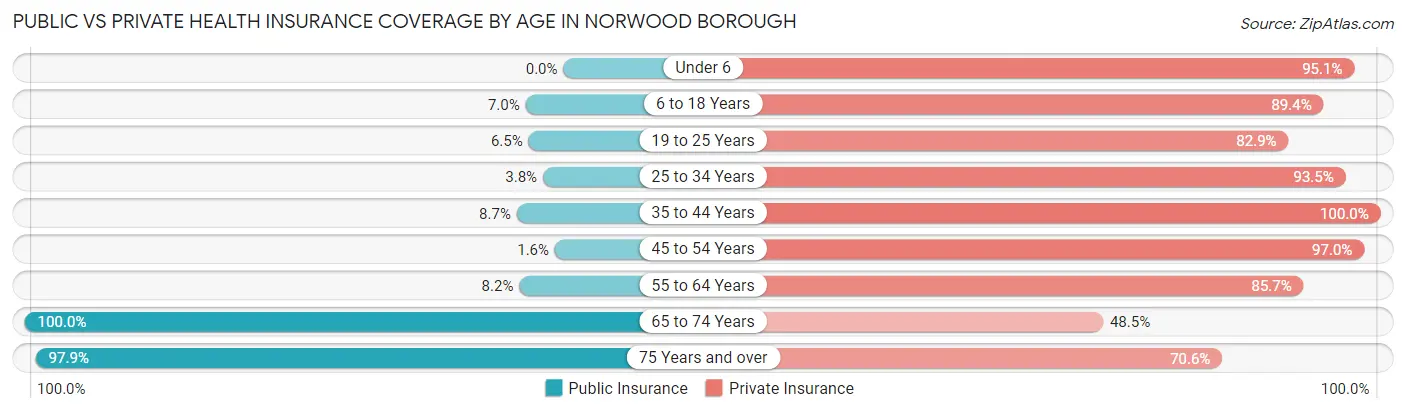
| Age Bracket | Public Insurance | Private Insurance |
| Under 6 | 0 (0.0%) | 175 (95.1%) |
| 6 to 18 Years | 78 (7.0%) | 995 (89.4%) |
| 19 to 25 Years | 34 (6.5%) | 436 (82.9%) |
| 25 to 34 Years | 14 (3.8%) | 345 (93.5%) |
| 35 to 44 Years | 39 (8.6%) | 451 (100.0%) |
| 45 to 54 Years | 14 (1.6%) | 859 (97.0%) |
| 55 to 64 Years | 71 (8.2%) | 743 (85.7%) |
| 65 to 74 Years | 363 (100.0%) | 176 (48.5%) |
| 75 Years and over | 713 (97.9%) | 514 (70.6%) |
| Total | 1,326 (24.2%) | 4,694 (85.6%) |
Disability Status by Sex by Age in Norwood borough
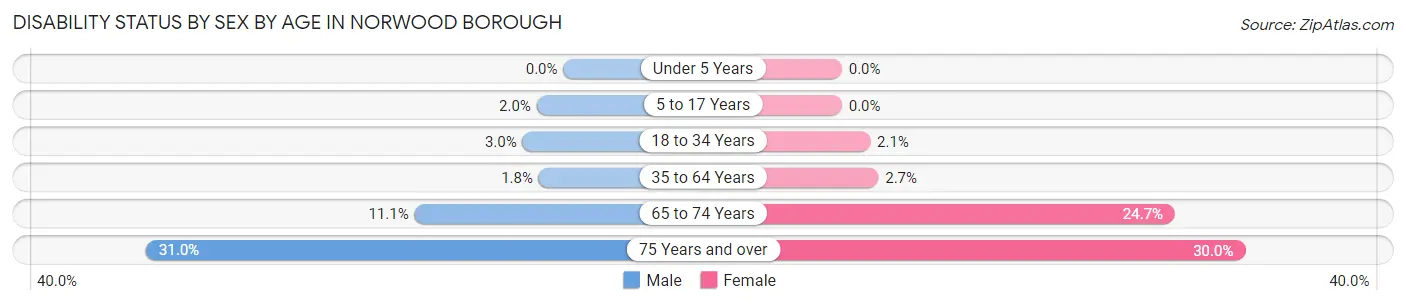
| Age Bracket | Male | Female |
| Under 5 Years | 0 (0.0%) | 0 (0.0%) |
| 5 to 17 Years | 8 (2.0%) | 0 (0.0%) |
| 18 to 34 Years | 14 (3.0%) | 11 (2.1%) |
| 35 to 64 Years | 20 (1.8%) | 30 (2.7%) |
| 65 to 74 Years | 20 (11.1%) | 45 (24.7%) |
| 75 Years and over | 88 (31.0%) | 133 (29.9%) |
Disability Class by Sex by Age in Norwood borough
Disability Class: Hearing Difficulty
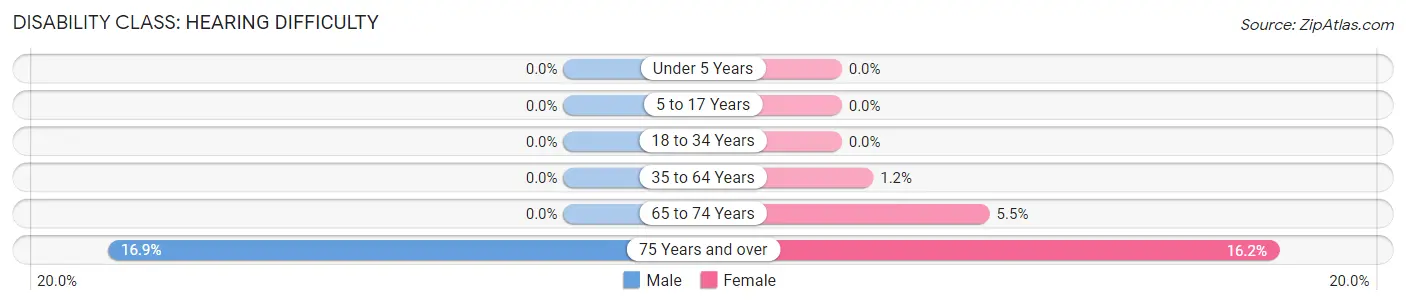
| Age Bracket | Male | Female |
| Under 5 Years | 0 (0.0%) | 0 (0.0%) |
| 5 to 17 Years | 0 (0.0%) | 0 (0.0%) |
| 18 to 34 Years | 0 (0.0%) | 0 (0.0%) |
| 35 to 64 Years | 0 (0.0%) | 13 (1.2%) |
| 65 to 74 Years | 0 (0.0%) | 10 (5.5%) |
| 75 Years and over | 48 (16.9%) | 72 (16.2%) |
Disability Class: Vision Difficulty
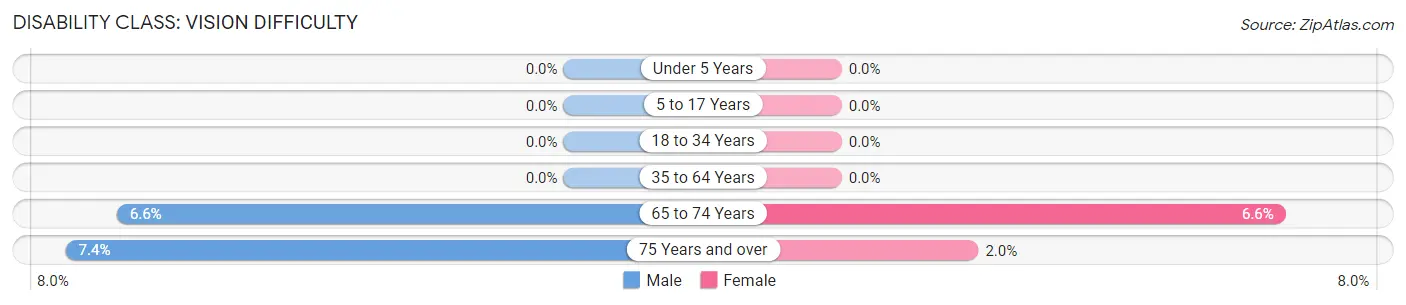
| Age Bracket | Male | Female |
| Under 5 Years | 0 (0.0%) | 0 (0.0%) |
| 5 to 17 Years | 0 (0.0%) | 0 (0.0%) |
| 18 to 34 Years | 0 (0.0%) | 0 (0.0%) |
| 35 to 64 Years | 0 (0.0%) | 0 (0.0%) |
| 65 to 74 Years | 12 (6.6%) | 12 (6.6%) |
| 75 Years and over | 21 (7.4%) | 9 (2.0%) |
Disability Class: Cognitive Difficulty
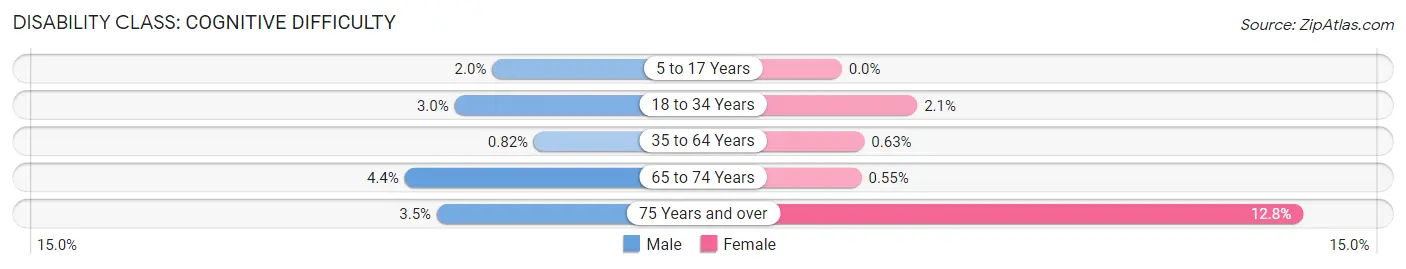
| Age Bracket | Male | Female |
| 5 to 17 Years | 8 (2.0%) | 0 (0.0%) |
| 18 to 34 Years | 14 (3.0%) | 11 (2.1%) |
| 35 to 64 Years | 9 (0.8%) | 7 (0.6%) |
| 65 to 74 Years | 8 (4.4%) | 1 (0.5%) |
| 75 Years and over | 10 (3.5%) | 57 (12.8%) |
Disability Class: Ambulatory Difficulty
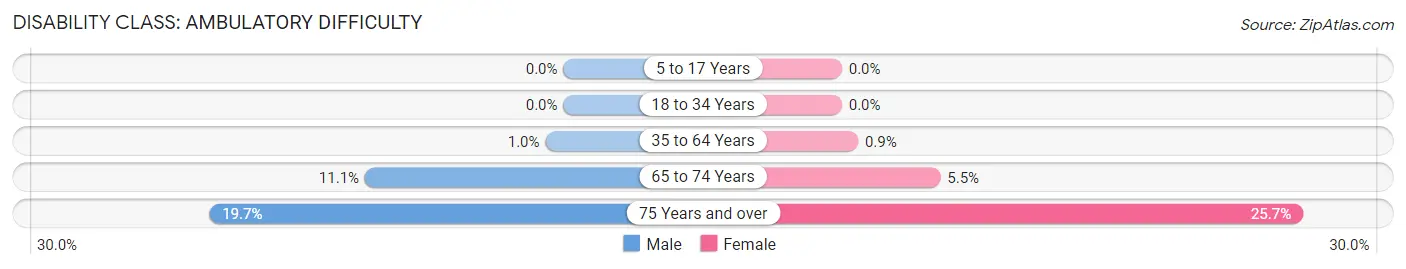
| Age Bracket | Male | Female |
| 5 to 17 Years | 0 (0.0%) | 0 (0.0%) |
| 18 to 34 Years | 0 (0.0%) | 0 (0.0%) |
| 35 to 64 Years | 11 (1.0%) | 10 (0.9%) |
| 65 to 74 Years | 20 (11.1%) | 10 (5.5%) |
| 75 Years and over | 56 (19.7%) | 114 (25.7%) |
Disability Class: Self-Care Difficulty
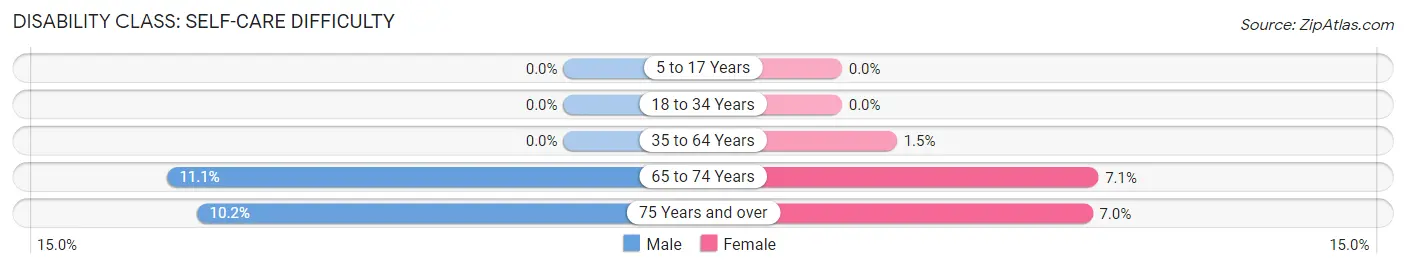
| Age Bracket | Male | Female |
| 5 to 17 Years | 0 (0.0%) | 0 (0.0%) |
| 18 to 34 Years | 0 (0.0%) | 0 (0.0%) |
| 35 to 64 Years | 0 (0.0%) | 17 (1.5%) |
| 65 to 74 Years | 20 (11.1%) | 13 (7.1%) |
| 75 Years and over | 29 (10.2%) | 31 (7.0%) |
Technology Access in Norwood borough
Computing Device Access in Norwood borough
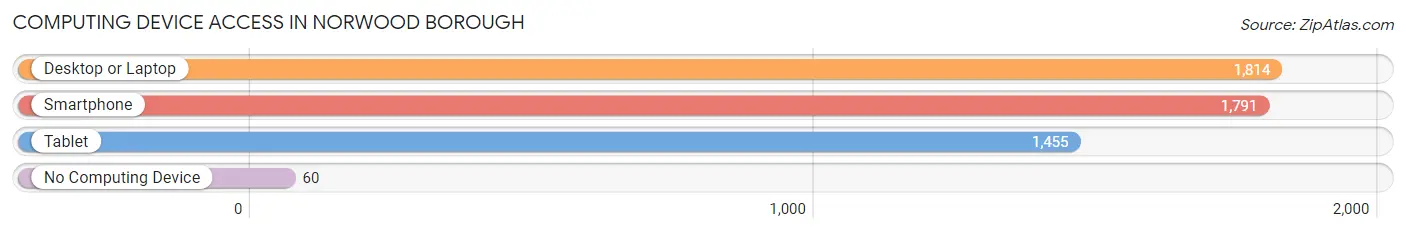
| Device Type | # Households | % Households |
| Desktop or Laptop | 1,814 | 92.4% |
| Smartphone | 1,791 | 91.2% |
| Tablet | 1,455 | 74.1% |
| No Computing Device | 60 | 3.0% |
| Total | 1,964 | 100.0% |
Internet Access in Norwood borough
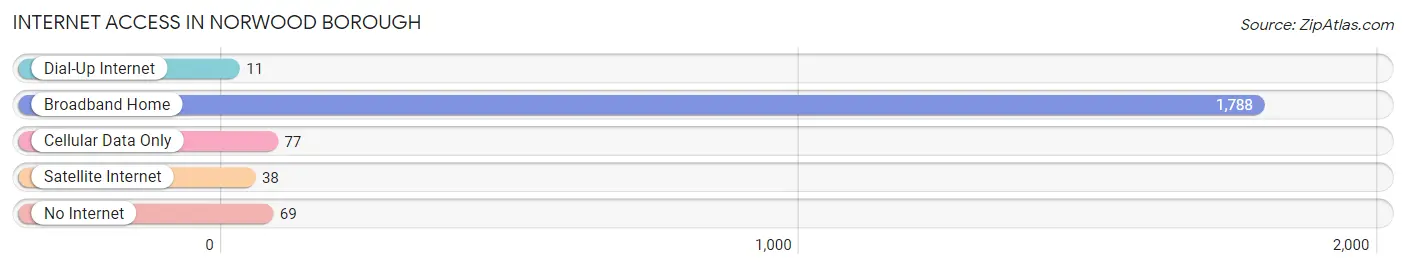
| Internet Type | # Households | % Households |
| Dial-Up Internet | 11 | 0.6% |
| Broadband Home | 1,788 | 91.0% |
| Cellular Data Only | 77 | 3.9% |
| Satellite Internet | 38 | 1.9% |
| No Internet | 69 | 3.5% |
| Total | 1,964 | 100.0% |
Norwood borough Summary
Norwood Borough is a small borough located in Bergen County, New Jersey. It is situated in the northern part of the state, just south of the New York border. The borough is bordered by the towns of Harrington Park, Northvale, Closter, and Rockleigh. As of the 2010 United States Census, the borough had a total population of 5,908.
History
The area that is now Norwood Borough was originally inhabited by the Lenni Lenape Native Americans. The first European settlers arrived in the area in the late 17th century. The area was part of Harrington Township until 1876, when it was incorporated as the Borough of Norwood. The borough was named after Norwood, England, which was the hometown of one of the original settlers.
Geography
Norwood Borough is located at 40°57'N 73°59'W (40.95, -73.98). According to the United States Census Bureau, the borough has a total area of 1.2 square miles (3.1 km2), all of which is land.
The borough is located in the Hackensack River watershed. The borough is located on the western edge of the Palisades Interstate Park, which is a National Natural Landmark.
Economy
The economy of Norwood Borough is largely based on small businesses and retail. The borough is home to several small businesses, including restaurants, shops, and professional services. The borough also has a few larger employers, such as the Norwood Public School District and the Norwood Fire Department.
Demographics
As of the 2010 United States Census, there were 5,908 people, 2,093 households, and 1,541 families residing in the borough. The population density was 4,919.3 people per square mile (1,902.2/km2). There were 2,209 housing units at an average density of 1,845.2 per square mile (715.3/km2). The racial makeup of the borough was 79.2% White, 1.2% African American, 0.2% Native American, 14.2% Asian, 0.1% Pacific Islander, 3.2% from other races, and 2.1% from two or more races. Hispanic or Latino of any race were 8.7% of the population.
There were 2,093 households, out of which 33.2% had children under the age of 18 living with them, 57.2% were married couples living together, 10.7% had a female householder with no husband present, and 27.3% were non-families. 22.2% of all households were made up of individuals, and 9.2% had someone living alone who was 65 years of age or older. The average household size was 2.83 and the average family size was 3.33.
In the borough, the population was spread out, with 24.2% under the age of 18, 7.2% from 18 to 24, 28.2% from 25 to 44, 27.2% from 45 to 64, and 13.2% who were 65 years of age or older. The median age was 39 years. For every 100 females, there were 94.2 males. For every 100 females age 18 and over, there were 91.2 males.
The median income for a household in the borough was $76,944, and the median income for a family was $87,917. Males had a median income of $60,000 versus $45,000 for females. The per capita income for the borough was $33,945. About 2.2% of families and 3.3% of the population were below the poverty line, including 3.7% of those under age 18 and 4.2% of those age 65 or over.
Common Questions
What is Per Capita Income in Norwood borough?
Per Capita income in Norwood borough is $63,518.
What is the Median Family Income in Norwood borough?
Median Family Income in Norwood borough is $179,500.
What is the Median Household income in Norwood borough?
Median Household Income in Norwood borough is $156,630.
What is Income or Wage Gap in Norwood borough?
Income or Wage Gap in Norwood borough is 42.7%.
Women in Norwood borough earn 57.3 cents for every dollar earned by a man.
What is Inequality or Gini Index in Norwood borough?
Inequality or Gini Index in Norwood borough is 0.44.
What is the Total Population of Norwood borough?
Total Population of Norwood borough is 5,657.
What is the Total Male Population of Norwood borough?
Total Male Population of Norwood borough is 2,609.
What is the Total Female Population of Norwood borough?
Total Female Population of Norwood borough is 3,048.
What is the Ratio of Males per 100 Females in Norwood borough?
There are 85.60 Males per 100 Females in Norwood borough.
What is the Ratio of Females per 100 Males in Norwood borough?
There are 116.83 Females per 100 Males in Norwood borough.
What is the Median Population Age in Norwood borough?
Median Population Age in Norwood borough is 48.1 Years.
What is the Average Family Size in Norwood borough
Average Family Size in Norwood borough is 3.4 People.
What is the Average Household Size in Norwood borough
Average Household Size in Norwood borough is 2.8 People.
How Large is the Labor Force in Norwood borough?
There are 2,806 People in the Labor Forcein in Norwood borough.
What is the Percentage of People in the Labor Force in Norwood borough?
60.5% of People are in the Labor Force in Norwood borough.
What is the Unemployment Rate in Norwood borough?
Unemployment Rate in Norwood borough is 2.5%.