Cities with the Highest Percentage of Asian Population in Illinois
RELATED REPORTS & OPTIONS
Asian
Illinois
Compare Cities
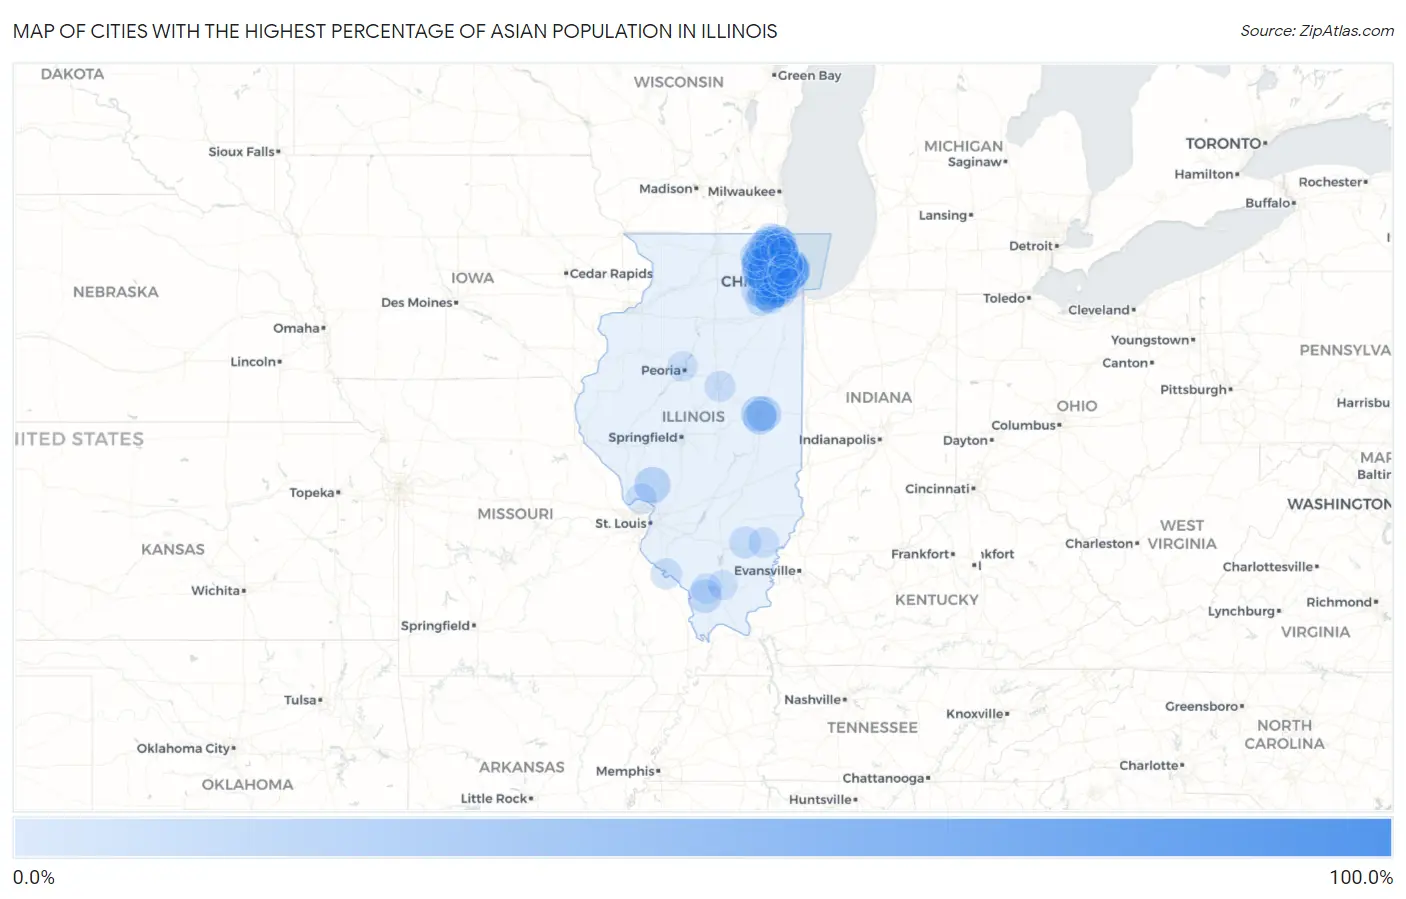
Map of Cities with the Highest Percentage of Asian Population in Illinois
0.0%
100.0%
Cities with the Highest Percentage of Asian Population in Illinois
| City | Asian | vs State | vs National | |
| 1. | Eagle Lake | 81.0% | 5.8%(+75.2)#1 | 5.8%(+75.3)#5 |
| 2. | Marley | 60.0% | 5.8%(+54.2)#2 | 5.8%(+54.2)#34 |
| 3. | South Barrington | 42.2% | 5.8%(+36.4)#3 | 5.8%(+36.4)#122 |
| 4. | Indian Creek | 34.9% | 5.8%(+29.2)#4 | 5.8%(+29.2)#195 |
| 5. | Morton Grove | 33.7% | 5.8%(+27.9)#5 | 5.8%(+27.9)#214 |
| 6. | Oak Brook | 29.4% | 5.8%(+23.6)#6 | 5.8%(+23.6)#288 |
| 7. | Skokie | 26.3% | 5.8%(+20.5)#7 | 5.8%(+20.5)#346 |
| 8. | Vernon Hills | 25.5% | 5.8%(+19.7)#8 | 5.8%(+19.7)#366 |
| 9. | Buffalo Grove | 25.4% | 5.8%(+19.6)#9 | 5.8%(+19.6)#369 |
| 10. | Hoffman Estates | 24.6% | 5.8%(+18.8)#10 | 5.8%(+18.9)#390 |
| 11. | Schaumburg | 24.6% | 5.8%(+18.8)#11 | 5.8%(+18.8)#392 |
| 12. | Lincolnwood | 23.0% | 5.8%(+17.2)#12 | 5.8%(+17.2)#427 |
| 13. | Glendale Heights | 22.3% | 5.8%(+16.5)#13 | 5.8%(+16.5)#452 |
| 14. | Niles | 21.4% | 5.8%(+15.6)#14 | 5.8%(+15.7)#476 |
| 15. | Inverness | 21.0% | 5.8%(+15.2)#15 | 5.8%(+15.2)#491 |
| 16. | Naperville | 21.0% | 5.8%(+15.2)#16 | 5.8%(+15.2)#493 |
| 17. | Lincolnshire | 20.4% | 5.8%(+14.6)#17 | 5.8%(+14.6)#511 |
| 18. | Hanover Park | 19.5% | 5.8%(+13.7)#18 | 5.8%(+13.7)#555 |
| 19. | Kildeer | 19.3% | 5.8%(+13.5)#19 | 5.8%(+13.5)#569 |
| 20. | Carol Stream | 19.2% | 5.8%(+13.4)#20 | 5.8%(+13.4)#576 |
| 21. | Fidelity | 17.3% | 5.8%(+11.5)#21 | 5.8%(+11.6)#682 |
| 22. | Lisle | 16.9% | 5.8%(+11.1)#22 | 5.8%(+11.1)#704 |
| 23. | Wheeling | 16.7% | 5.8%(+10.9)#23 | 5.8%(+10.9)#723 |
| 24. | Bartlett | 16.4% | 5.8%(+10.6)#24 | 5.8%(+10.7)#734 |
| 25. | Northbrook | 16.3% | 5.8%(+10.5)#25 | 5.8%(+10.6)#740 |
| 26. | Round Lake | 16.1% | 5.8%(+10.3)#26 | 5.8%(+10.3)#757 |
| 27. | Glenview | 16.0% | 5.8%(+10.2)#27 | 5.8%(+10.2)#764 |
| 28. | Champaign | 15.9% | 5.8%(+10.1)#28 | 5.8%(+10.1)#773 |
| 29. | Itasca | 15.3% | 5.8%(+9.54)#29 | 5.8%(+9.55)#812 |
| 30. | Burr Ridge | 14.8% | 5.8%(+8.99)#30 | 5.8%(+9.01)#847 |
| 31. | Bloomingdale | 14.7% | 5.8%(+8.95)#31 | 5.8%(+8.96)#851 |
| 32. | Urbana | 14.7% | 5.8%(+8.90)#32 | 5.8%(+8.91)#853 |
| 33. | Hawthorn Woods | 14.3% | 5.8%(+8.55)#33 | 5.8%(+8.56)#872 |
| 34. | Streamwood | 14.1% | 5.8%(+8.31)#34 | 5.8%(+8.32)#892 |
| 35. | Mount Prospect | 13.8% | 5.8%(+7.97)#35 | 5.8%(+7.98)#924 |
| 36. | Savoy | 13.7% | 5.8%(+7.94)#36 | 5.8%(+7.96)#927 |
| 37. | Hinsdale | 13.7% | 5.8%(+7.90)#37 | 5.8%(+7.91)#934 |
| 38. | Westmont | 13.6% | 5.8%(+7.77)#38 | 5.8%(+7.79)#946 |
| 39. | Des Plaines | 13.2% | 5.8%(+7.43)#39 | 5.8%(+7.44)#994 |
| 40. | Gurnee | 13.2% | 5.8%(+7.42)#40 | 5.8%(+7.44)#995 |
| 41. | Harwood Heights | 13.1% | 5.8%(+7.31)#41 | 5.8%(+7.32)#1,006 |
| 42. | Bolingbrook | 13.1% | 5.8%(+7.30)#42 | 5.8%(+7.31)#1,009 |
| 43. | Palatine | 13.1% | 5.8%(+7.28)#43 | 5.8%(+7.30)#1,010 |
| 44. | Oakbrook Terrace | 12.7% | 5.8%(+6.94)#44 | 5.8%(+6.95)#1,028 |
| 45. | Makanda | 12.6% | 5.8%(+6.81)#45 | 5.8%(+6.83)#1,046 |
| 46. | Rolling Meadows | 12.4% | 5.8%(+6.59)#46 | 5.8%(+6.60)#1,071 |
| 47. | Woodridge | 12.3% | 5.8%(+6.56)#47 | 5.8%(+6.57)#1,075 |
| 48. | Long Grove | 12.3% | 5.8%(+6.56)#48 | 5.8%(+6.57)#1,076 |
| 49. | Grandwood Park | 12.1% | 5.8%(+6.36)#49 | 5.8%(+6.38)#1,105 |
| 50. | Lombard | 12.0% | 5.8%(+6.23)#50 | 5.8%(+6.25)#1,118 |
| 51. | Wilmette | 11.6% | 5.8%(+5.79)#51 | 5.8%(+5.81)#1,175 |
| 52. | Elk Grove Village | 11.4% | 5.8%(+5.57)#52 | 5.8%(+5.58)#1,218 |
| 53. | Clarendon Hills | 11.3% | 5.8%(+5.55)#53 | 5.8%(+5.56)#1,224 |
| 54. | Arlington Heights | 11.1% | 5.8%(+5.29)#54 | 5.8%(+5.30)#1,256 |
| 55. | Darien | 11.0% | 5.8%(+5.17)#55 | 5.8%(+5.18)#1,276 |
| 56. | Aurora | 10.7% | 5.8%(+4.96)#56 | 5.8%(+4.97)#1,299 |
| 57. | Mundelein | 10.4% | 5.8%(+4.64)#57 | 5.8%(+4.65)#1,346 |
| 58. | Roselle | 10.1% | 5.8%(+4.34)#58 | 5.8%(+4.36)#1,387 |
| 59. | West Chicago | 10.0% | 5.8%(+4.19)#59 | 5.8%(+4.20)#1,415 |
| 60. | Sims | 9.8% | 5.8%(+4.05)#60 | 5.8%(+4.06)#1,443 |
| 61. | Hainesville | 9.7% | 5.8%(+3.88)#61 | 5.8%(+3.90)#1,484 |
| 62. | Plainfield | 9.5% | 5.8%(+3.76)#62 | 5.8%(+3.77)#1,500 |
| 63. | South Elgin | 9.5% | 5.8%(+3.67)#63 | 5.8%(+3.69)#1,510 |
| 64. | Lake Zurich | 9.4% | 5.8%(+3.66)#64 | 5.8%(+3.67)#1,516 |
| 65. | Evanston | 9.2% | 5.8%(+3.43)#65 | 5.8%(+3.44)#1,556 |
| 66. | Addison | 9.0% | 5.8%(+3.25)#66 | 5.8%(+3.27)#1,593 |
| 67. | Arbury Hills | 9.0% | 5.8%(+3.20)#67 | 5.8%(+3.22)#1,605 |
| 68. | Glen Ellyn | 9.0% | 5.8%(+3.19)#68 | 5.8%(+3.20)#1,607 |
| 69. | Barrington | 9.0% | 5.8%(+3.19)#69 | 5.8%(+3.20)#1,608 |
| 70. | Northfield | 8.8% | 5.8%(+2.99)#70 | 5.8%(+3.01)#1,651 |
| 71. | Bannockburn | 8.5% | 5.8%(+2.76)#71 | 5.8%(+2.77)#1,692 |
| 72. | North Barrington | 8.4% | 5.8%(+2.58)#72 | 5.8%(+2.60)#1,728 |
| 73. | Kaskaskia | 8.3% | 5.8%(+2.55)#73 | 5.8%(+2.56)#1,737 |
| 74. | Bloomington | 8.2% | 5.8%(+2.38)#74 | 5.8%(+2.39)#1,770 |
| 75. | Elsah | 8.1% | 5.8%(+2.32)#75 | 5.8%(+2.34)#1,786 |
| 76. | Golf | 8.1% | 5.8%(+2.27)#76 | 5.8%(+2.29)#1,796 |
| 77. | Deer Park | 8.0% | 5.8%(+2.25)#77 | 5.8%(+2.27)#1,802 |
| 78. | Lake Villa | 8.0% | 5.8%(+2.24)#78 | 5.8%(+2.25)#1,805 |
| 79. | Barrington Hills | 8.0% | 5.8%(+2.24)#79 | 5.8%(+2.25)#1,806 |
| 80. | Golden Gate | 7.8% | 5.8%(+1.99)#80 | 5.8%(+2.01)#1,859 |
| 81. | Green Oaks | 7.7% | 5.8%(+1.91)#81 | 5.8%(+1.92)#1,888 |
| 82. | Prospect Heights | 7.5% | 5.8%(+1.68)#82 | 5.8%(+1.69)#1,944 |
| 83. | Wayne | 7.5% | 5.8%(+1.68)#83 | 5.8%(+1.69)#1,945 |
| 84. | Elmhurst | 7.5% | 5.8%(+1.67)#84 | 5.8%(+1.68)#1,949 |
| 85. | West Dundee | 7.4% | 5.8%(+1.57)#85 | 5.8%(+1.58)#1,978 |
| 86. | Waukegan | 7.2% | 5.8%(+1.46)#86 | 5.8%(+1.47)#2,008 |
| 87. | Prairie Grove | 7.2% | 5.8%(+1.43)#87 | 5.8%(+1.45)#2,012 |
| 88. | Carbondale | 7.1% | 5.8%(+1.36)#88 | 5.8%(+1.37)#2,041 |
| 89. | Lake Bluff | 7.1% | 5.8%(+1.34)#89 | 5.8%(+1.36)#2,048 |
| 90. | Lake In The Hills | 7.0% | 5.8%(+1.26)#90 | 5.8%(+1.27)#2,070 |
| 91. | Romeoville | 7.0% | 5.8%(+1.24)#91 | 5.8%(+1.25)#2,078 |
| 92. | Chicago | 7.0% | 5.8%(+1.22)#92 | 5.8%(+1.24)#2,083 |
| 93. | Peoria | 6.7% | 5.8%(+0.906)#93 | 5.8%(+0.919)#2,200 |
| 94. | Forest Park | 6.7% | 5.8%(+0.893)#94 | 5.8%(+0.906)#2,204 |
| 95. | Lakemoor | 6.7% | 5.8%(+0.889)#95 | 5.8%(+0.902)#2,208 |
| 96. | Libertyville | 6.6% | 5.8%(+0.768)#96 | 5.8%(+0.781)#2,246 |
| 97. | Schiller Park | 6.5% | 5.8%(+0.706)#97 | 5.8%(+0.719)#2,269 |
| 98. | Lake Forest | 6.5% | 5.8%(+0.677)#98 | 5.8%(+0.690)#2,277 |
| 99. | Park Ridge | 6.4% | 5.8%(+0.578)#99 | 5.8%(+0.590)#2,321 |
| 100. | Spillertown | 6.3% | 5.8%(+0.564)#100 | 5.8%(+0.577)#2,323 |
Common Questions
What are the Top 10 Cities with the Highest Percentage of Asian Population in Illinois?
Top 10 Cities with the Highest Percentage of Asian Population in Illinois are:
#1
42.2%
#2
34.9%
#3
33.7%
#4
29.4%
#5
26.3%
#6
25.5%
#7
25.4%
#8
24.6%
#9
24.6%
#10
23.0%
What city has the Highest Percentage of Asian Population in Illinois?
South Barrington has the Highest Percentage of Asian Population in Illinois with 42.2%.
What is the Percentage of Asian Population in the State of Illinois?
Percentage of Asian Population in Illinois is 5.8%.
What is the Percentage of Asian Population in the United States?
Percentage of Asian Population in the United States is 5.8%.