Cities with the Highest Percentage of Asian Population in Connecticut
RELATED REPORTS & OPTIONS
Asian
Connecticut
Compare Cities
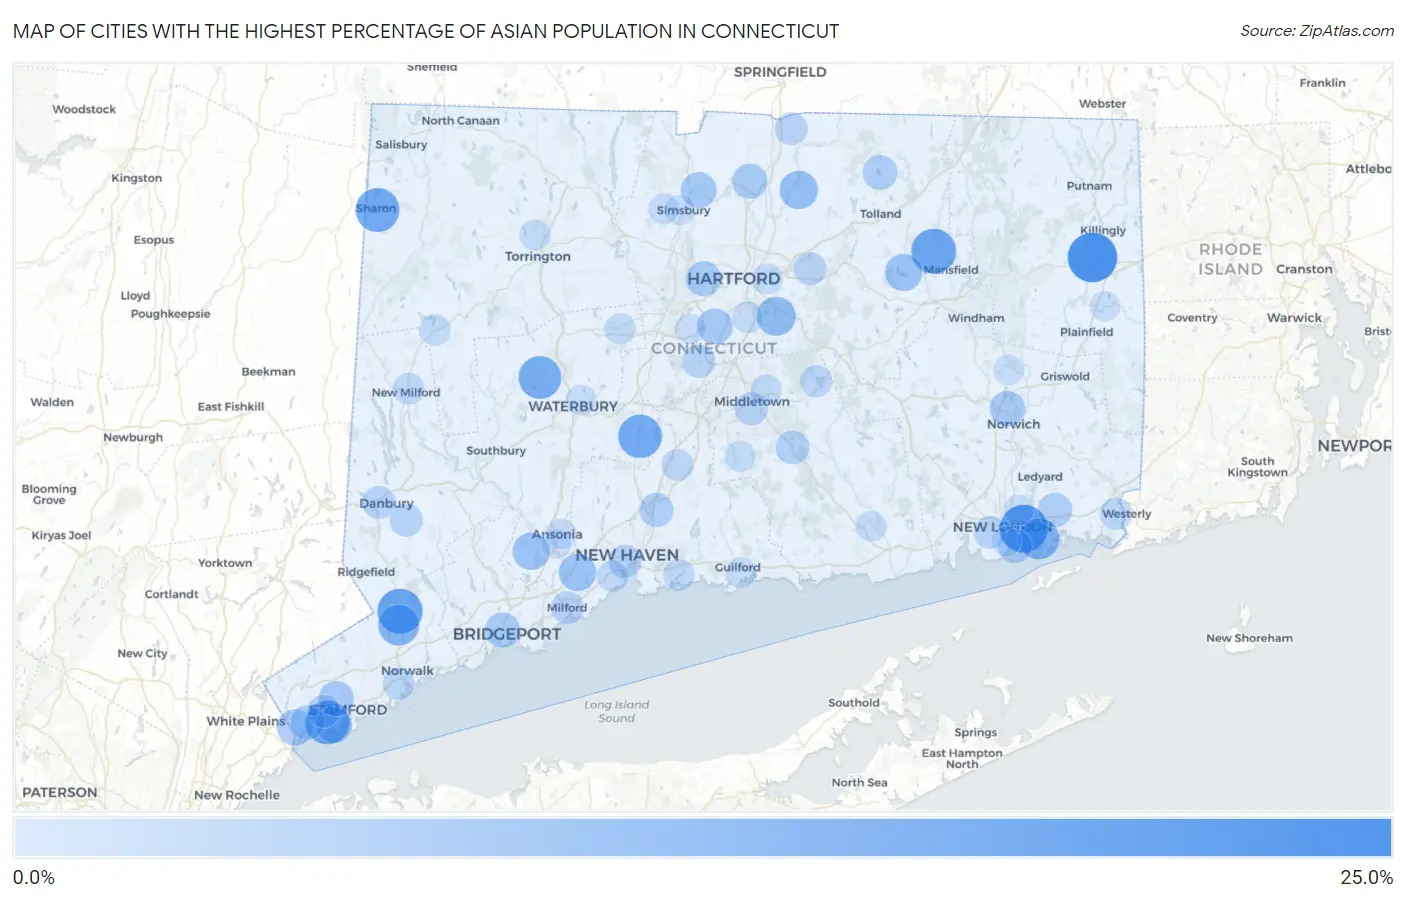
Map of Cities with the Highest Percentage of Asian Population in Connecticut
0.0%
25.0%
Cities with the Highest Percentage of Asian Population in Connecticut
| City | Asian | vs State | vs National | |
| 1. | East Brooklyn | 20.3% | 4.7%(+15.5)#1 | 5.8%(+14.5)#517 |
| 2. | Long Hill | 18.7% | 4.7%(+14.0)#2 | 5.8%(+12.9)#595 |
| 3. | Cannondale | 16.2% | 4.7%(+11.4)#3 | 5.8%(+10.4)#750 |
| 4. | Storrs | 15.9% | 4.7%(+11.2)#4 | 5.8%(+10.2)#767 |
| 5. | Riverside | 15.1% | 4.7%(+10.4)#5 | 5.8%(+9.32)#830 |
| 6. | Sharon | 14.9% | 4.7%(+10.2)#6 | 5.8%(+9.12)#843 |
| 7. | Noroton | 14.6% | 4.7%(+9.90)#7 | 5.8%(+8.86)#854 |
| 8. | Cheshire Village | 14.6% | 4.7%(+9.86)#8 | 5.8%(+8.82)#855 |
| 9. | South Wilton | 13.9% | 4.7%(+9.20)#9 | 5.8%(+8.16)#904 |
| 10. | Watertown | 13.9% | 4.7%(+9.18)#10 | 5.8%(+8.15)#908 |
| 11. | Poquonock Bridge | 12.5% | 4.7%(+7.78)#11 | 5.8%(+6.75)#1,055 |
| 12. | Wilton Center | 12.2% | 4.7%(+7.45)#12 | 5.8%(+6.41)#1,101 |
| 13. | Daniels Farm | 12.0% | 4.7%(+7.25)#13 | 5.8%(+6.21)#1,124 |
| 14. | Murray | 11.9% | 4.7%(+7.15)#14 | 5.8%(+6.11)#1,137 |
| 15. | Rock Ridge | 11.5% | 4.7%(+6.75)#15 | 5.8%(+5.71)#1,199 |
| 16. | Ridgebury | 11.1% | 4.7%(+6.38)#16 | 5.8%(+5.34)#1,252 |
| 17. | Westport | 11.0% | 4.7%(+6.29)#17 | 5.8%(+5.25)#1,265 |
| 18. | Tashua | 10.7% | 4.7%(+5.99)#18 | 5.8%(+4.95)#1,304 |
| 19. | Glastonbury Center | 10.4% | 4.7%(+5.69)#19 | 5.8%(+4.66)#1,344 |
| 20. | Broad Brook | 9.8% | 4.7%(+5.10)#20 | 5.8%(+4.06)#1,444 |
| 21. | Trumbull Center | 9.4% | 4.7%(+4.67)#21 | 5.8%(+3.63)#1,525 |
| 22. | Shelton | 8.8% | 4.7%(+4.10)#22 | 5.8%(+3.06)#1,640 |
| 23. | Taylor Corners | 8.8% | 4.7%(+4.10)#23 | 5.8%(+3.06)#1,641 |
| 24. | Orange | 8.8% | 4.7%(+4.08)#24 | 5.8%(+3.04)#1,646 |
| 25. | South Coventry | 8.8% | 4.7%(+4.05)#25 | 5.8%(+3.01)#1,650 |
| 26. | Lakes East | 8.4% | 4.7%(+3.71)#26 | 5.8%(+2.67)#1,712 |
| 27. | Bigelow Corners | 8.3% | 4.7%(+3.60)#27 | 5.8%(+2.56)#1,734 |
| 28. | Redding Center | 8.1% | 4.7%(+3.41)#28 | 5.8%(+2.37)#1,781 |
| 29. | New Canaan | 8.0% | 4.7%(+3.31)#29 | 5.8%(+2.27)#1,801 |
| 30. | Pemberwick | 7.8% | 4.7%(+3.11)#30 | 5.8%(+2.07)#1,847 |
| 31. | Old Greenwich | 7.8% | 4.7%(+3.04)#31 | 5.8%(+2.00)#1,861 |
| 32. | Brookfield Center | 7.6% | 4.7%(+2.91)#32 | 5.8%(+1.87)#1,898 |
| 33. | Staples | 7.6% | 4.7%(+2.89)#33 | 5.8%(+1.85)#1,906 |
| 34. | Tariffville | 7.4% | 4.7%(+2.70)#34 | 5.8%(+1.66)#1,957 |
| 35. | Litchfield Borough | 7.4% | 4.7%(+2.65)#35 | 5.8%(+1.61)#1,973 |
| 36. | Newington | 7.4% | 4.7%(+2.62)#36 | 5.8%(+1.58)#1,979 |
| 37. | Norwich | 7.2% | 4.7%(+2.46)#37 | 5.8%(+1.42)#2,023 |
| 38. | Stamford | 7.0% | 4.7%(+2.27)#38 | 5.8%(+1.23)#2,087 |
| 39. | Darien Downtown | 6.9% | 4.7%(+2.15)#39 | 5.8%(+1.11)#2,133 |
| 40. | Bridgeport | 6.8% | 4.7%(+2.09)#40 | 5.8%(+1.05)#2,157 |
| 41. | West Hartford | 6.8% | 4.7%(+2.08)#41 | 5.8%(+1.04)#2,159 |
| 42. | Windsor Locks | 6.8% | 4.7%(+2.08)#42 | 5.8%(+1.04)#2,162 |
| 43. | East | 6.6% | 4.7%(+1.88)#43 | 5.8%(+0.840)#2,228 |
| 44. | Crystal Lake | 6.4% | 4.7%(+1.66)#44 | 5.8%(+0.622)#2,308 |
| 45. | Old Mystic | 6.3% | 4.7%(+1.56)#45 | 5.8%(+0.520)#2,347 |
| 46. | Noroton Heights | 6.2% | 4.7%(+1.45)#46 | 5.8%(+0.415)#2,388 |
| 47. | Greenwich | 6.1% | 4.7%(+1.41)#47 | 5.8%(+0.369)#2,411 |
| 48. | North Haven | 6.0% | 4.7%(+1.26)#48 | 5.8%(+0.216)#2,476 |
| 49. | Groton | 5.8% | 4.7%(+1.05)#49 | 5.8%(+0.016)#2,568 |
| 50. | Higganum | 5.6% | 4.7%(+0.878)#50 | 5.8%(-0.161)#2,662 |
| 51. | Bethel | 5.1% | 4.7%(+0.409)#51 | 5.8%(-0.630)#2,925 |
| 52. | Kensington | 5.1% | 4.7%(+0.402)#52 | 5.8%(-0.637)#2,927 |
| 53. | Middletown | 5.1% | 4.7%(+0.363)#53 | 5.8%(-0.676)#2,941 |
| 54. | New Haven | 5.1% | 4.7%(+0.347)#54 | 5.8%(-0.692)#2,950 |
| 55. | Stratford Downtown | 5.1% | 4.7%(+0.346)#55 | 5.8%(-0.693)#2,951 |
| 56. | Cos Cob | 5.0% | 4.7%(+0.278)#56 | 5.8%(-0.761)#2,980 |
| 57. | Manchester | 4.9% | 4.7%(+0.197)#57 | 5.8%(-0.842)#3,024 |
| 58. | Danbury | 4.9% | 4.7%(+0.187)#58 | 5.8%(-0.852)#3,031 |
| 59. | Saugatuck | 4.9% | 4.7%(+0.168)#59 | 5.8%(-0.871)#3,040 |
| 60. | Milford City Balance | 4.9% | 4.7%(+0.128)#60 | 5.8%(-0.911)#3,065 |
| 61. | Sherwood Manor | 4.7% | 4.7%(-0.022)#61 | 5.8%(-1.06)#3,143 |
| 62. | Waterford | 4.6% | 4.7%(-0.094)#62 | 5.8%(-1.13)#3,198 |
| 63. | Naugatuck Borough | 4.6% | 4.7%(-0.140)#63 | 5.8%(-1.18)#3,235 |
| 64. | Quinnipiac University | 4.6% | 4.7%(-0.166)#64 | 5.8%(-1.21)#3,252 |
| 65. | Pawcatuck | 4.5% | 4.7%(-0.191)#65 | 5.8%(-1.23)#3,279 |
| 66. | Weston | 4.5% | 4.7%(-0.217)#66 | 5.8%(-1.26)#3,290 |
| 67. | Lake Pocotopaug | 4.4% | 4.7%(-0.365)#67 | 5.8%(-1.40)#3,395 |
| 68. | Knollcrest | 4.3% | 4.7%(-0.429)#68 | 5.8%(-1.47)#3,442 |
| 69. | Norwalk | 4.0% | 4.7%(-0.724)#69 | 5.8%(-1.76)#3,685 |
| 70. | Wallingford Center | 4.0% | 4.7%(-0.742)#70 | 5.8%(-1.78)#3,700 |
| 71. | New Milford | 3.9% | 4.7%(-0.815)#71 | 5.8%(-1.85)#3,763 |
| 72. | Old Hill | 3.8% | 4.7%(-0.952)#72 | 5.8%(-1.99)#3,875 |
| 73. | Branford Center | 3.8% | 4.7%(-0.976)#73 | 5.8%(-2.02)#3,898 |
| 74. | West Haven | 3.7% | 4.7%(-1.00)#74 | 5.8%(-2.04)#3,918 |
| 75. | Poplar Plains | 3.6% | 4.7%(-1.10)#75 | 5.8%(-2.14)#4,009 |
| 76. | New Preston | 3.5% | 4.7%(-1.22)#76 | 5.8%(-2.26)#4,130 |
| 77. | Bristol | 3.5% | 4.7%(-1.28)#77 | 5.8%(-2.32)#4,188 |
| 78. | Wethersfield | 3.4% | 4.7%(-1.33)#78 | 5.8%(-2.37)#4,248 |
| 79. | Portland | 3.4% | 4.7%(-1.34)#79 | 5.8%(-2.38)#4,252 |
| 80. | Torrington | 3.4% | 4.7%(-1.37)#80 | 5.8%(-2.41)#4,295 |
| 81. | Durham | 3.3% | 4.7%(-1.45)#81 | 5.8%(-2.49)#4,376 |
| 82. | East Hartford | 3.2% | 4.7%(-1.50)#82 | 5.8%(-2.54)#4,436 |
| 83. | Sacred Heart University | 3.1% | 4.7%(-1.66)#83 | 5.8%(-2.70)#4,639 |
| 84. | Baltic | 3.0% | 4.7%(-1.69)#84 | 5.8%(-2.73)#4,680 |
| 85. | Sandy Hook | 3.0% | 4.7%(-1.71)#85 | 5.8%(-2.75)#4,718 |
| 86. | Essex Village | 3.0% | 4.7%(-1.72)#86 | 5.8%(-2.76)#4,733 |
| 87. | Coleytown | 3.0% | 4.7%(-1.75)#87 | 5.8%(-2.79)#4,771 |
| 88. | Ansonia | 3.0% | 4.7%(-1.76)#88 | 5.8%(-2.80)#4,774 |
| 89. | Guilford Center | 3.0% | 4.7%(-1.78)#89 | 5.8%(-2.82)#4,799 |
| 90. | Waterbury | 2.9% | 4.7%(-1.80)#90 | 5.8%(-2.83)#4,812 |
| 91. | West Simsbury | 2.9% | 4.7%(-1.80)#91 | 5.8%(-2.84)#4,820 |
| 92. | Lordship | 2.9% | 4.7%(-1.82)#92 | 5.8%(-2.86)#4,851 |
| 93. | Indian Field | 2.9% | 4.7%(-1.85)#93 | 5.8%(-2.89)#4,892 |
| 94. | Conning Towers Nautilus Park | 2.8% | 4.7%(-1.90)#94 | 5.8%(-2.94)#4,966 |
| 95. | Moosup | 2.7% | 4.7%(-1.99)#95 | 5.8%(-3.03)#5,104 |
| 96. | Simsbury Center | 2.7% | 4.7%(-2.03)#96 | 5.8%(-3.07)#5,147 |
| 97. | New Britain | 2.7% | 4.7%(-2.06)#97 | 5.8%(-3.10)#5,193 |
| 98. | Stepney | 2.4% | 4.7%(-2.28)#98 | 5.8%(-3.32)#5,505 |
| 99. | Derby | 2.4% | 4.7%(-2.29)#99 | 5.8%(-3.33)#5,520 |
| 100. | New London | 2.3% | 4.7%(-2.39)#100 | 5.8%(-3.42)#5,682 |
Common Questions
What are the Top 10 Cities with the Highest Percentage of Asian Population in Connecticut?
Top 10 Cities with the Highest Percentage of Asian Population in Connecticut are:
#1
20.3%
#2
18.7%
#3
16.2%
#4
15.9%
#5
15.1%
#6
14.9%
#7
14.6%
#8
13.9%
#9
12.5%
#10
12.2%
What city has the Highest Percentage of Asian Population in Connecticut?
East Brooklyn has the Highest Percentage of Asian Population in Connecticut with 20.3%.
What is the Percentage of Asian Population in the State of Connecticut?
Percentage of Asian Population in Connecticut is 4.7%.
What is the Percentage of Asian Population in the United States?
Percentage of Asian Population in the United States is 5.8%.