Cities with the Highest Percentage of Asian Population in Oregon
RELATED REPORTS & OPTIONS
Asian
Oregon
Compare Cities
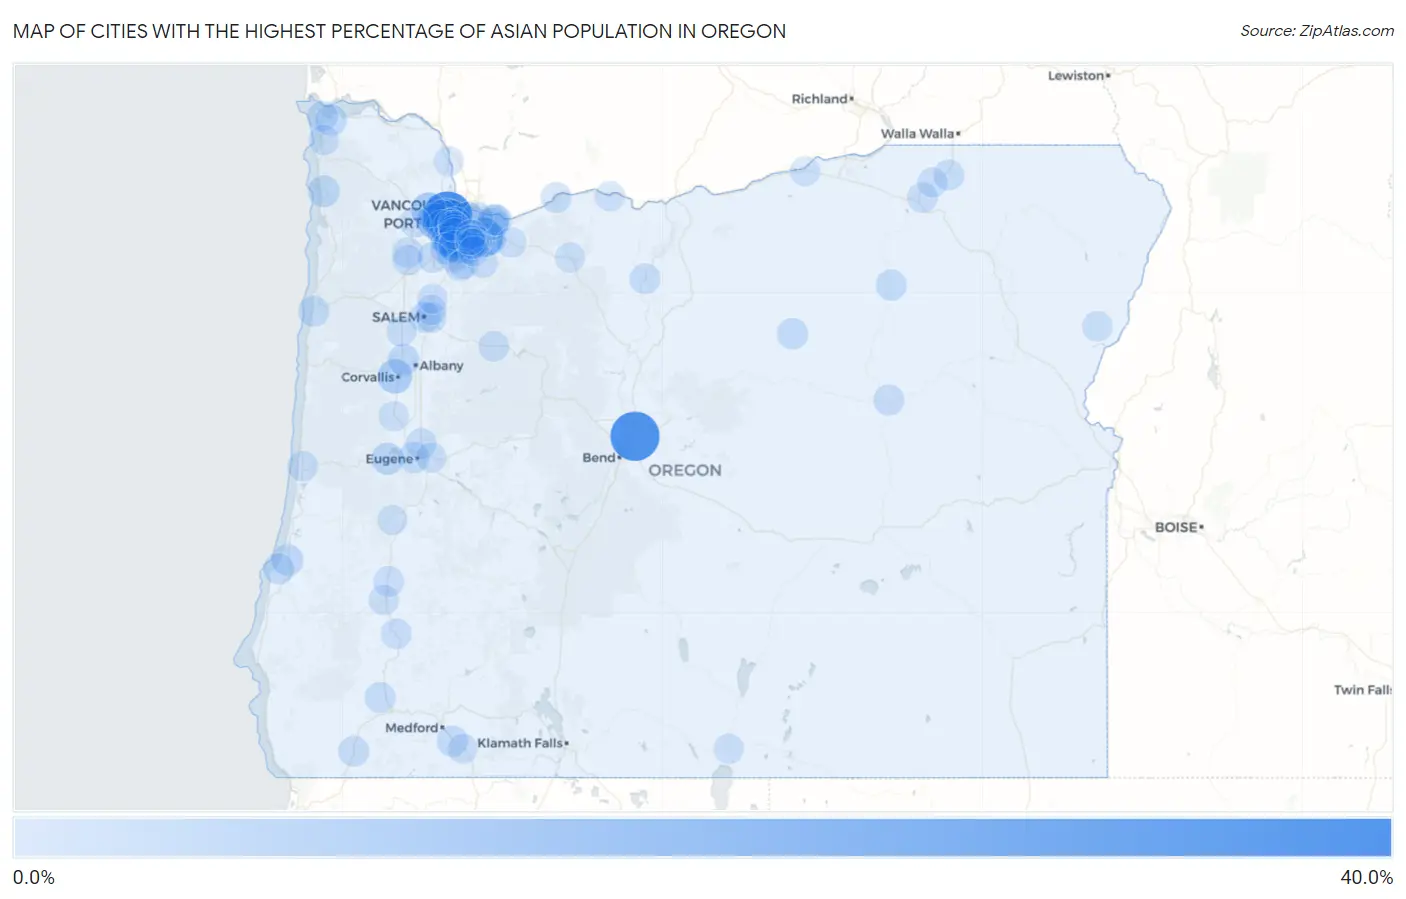
Map of Cities with the Highest Percentage of Asian Population in Oregon
0.0%
40.0%
Cities with the Highest Percentage of Asian Population in Oregon
| City | Asian | vs State | vs National | |
| 1. | Bethany | 38.6% | 4.4%(+34.1)#1 | 5.8%(+32.8)#159 |
| 2. | Pronghorn | 37.7% | 4.4%(+33.3)#2 | 5.8%(+31.9)#173 |
| 3. | Oak Hills | 21.3% | 4.4%(+16.9)#3 | 5.8%(+15.5)#479 |
| 4. | Cedar Mill | 19.6% | 4.4%(+15.2)#4 | 5.8%(+13.9)#548 |
| 5. | Happy Valley | 18.1% | 4.4%(+13.7)#5 | 5.8%(+12.3)#630 |
| 6. | Falcon Heights | 14.4% | 4.4%(+9.98)#6 | 5.8%(+8.65)#864 |
| 7. | Rivergrove | 14.3% | 4.4%(+9.90)#7 | 5.8%(+8.56)#871 |
| 8. | Beaverton | 11.9% | 4.4%(+7.48)#8 | 5.8%(+6.15)#1,133 |
| 9. | Hillsboro | 11.5% | 4.4%(+7.09)#9 | 5.8%(+5.76)#1,185 |
| 10. | Rockcreek | 11.2% | 4.4%(+6.72)#10 | 5.8%(+5.39)#1,248 |
| 11. | Marlene | 11.1% | 4.4%(+6.68)#11 | 5.8%(+5.35)#1,251 |
| 12. | Aloha | 10.7% | 4.4%(+6.29)#12 | 5.8%(+4.96)#1,302 |
| 13. | North Plains | 10.4% | 4.4%(+5.96)#13 | 5.8%(+4.63)#1,352 |
| 14. | Corvallis | 9.8% | 4.4%(+5.36)#14 | 5.8%(+4.03)#1,448 |
| 15. | Tigard | 9.3% | 4.4%(+4.89)#15 | 5.8%(+3.56)#1,535 |
| 16. | Bull Mountain | 8.5% | 4.4%(+4.09)#16 | 5.8%(+2.76)#1,694 |
| 17. | Lake Oswego | 8.5% | 4.4%(+4.08)#17 | 5.8%(+2.75)#1,698 |
| 18. | Portland | 8.4% | 4.4%(+4.00)#18 | 5.8%(+2.67)#1,715 |
| 19. | West Haven Sylvan | 7.3% | 4.4%(+2.90)#19 | 5.8%(+1.57)#1,981 |
| 20. | Raleigh Hills | 6.5% | 4.4%(+2.10)#20 | 5.8%(+0.773)#2,252 |
| 21. | Keno | 6.3% | 4.4%(+1.83)#21 | 5.8%(+0.501)#2,359 |
| 22. | Damascus | 5.7% | 4.4%(+1.30)#22 | 5.8%(-0.031)#2,589 |
| 23. | Cedar Hills | 5.7% | 4.4%(+1.30)#23 | 5.8%(-0.032)#2,590 |
| 24. | Dunthorpe | 5.7% | 4.4%(+1.27)#24 | 5.8%(-0.057)#2,600 |
| 25. | West Linn | 5.6% | 4.4%(+1.12)#25 | 5.8%(-0.214)#2,686 |
| 26. | Gresham | 5.4% | 4.4%(+0.949)#26 | 5.8%(-0.382)#2,768 |
| 27. | Veneta | 5.2% | 4.4%(+0.716)#27 | 5.8%(-0.615)#2,913 |
| 28. | Bayside Gardens | 5.0% | 4.4%(+0.558)#28 | 5.8%(-0.773)#2,987 |
| 29. | King City | 4.7% | 4.4%(+0.259)#29 | 5.8%(-1.07)#3,155 |
| 30. | North Bend | 4.7% | 4.4%(+0.222)#30 | 5.8%(-1.11)#3,184 |
| 31. | Garden Home Whitford | 4.6% | 4.4%(+0.187)#31 | 5.8%(-1.14)#3,208 |
| 32. | Adair Village | 4.5% | 4.4%(+0.031)#32 | 5.8%(-1.30)#3,329 |
| 33. | Durham | 4.3% | 4.4%(-0.141)#33 | 5.8%(-1.47)#3,446 |
| 34. | Jeffers Gardens | 4.3% | 4.4%(-0.168)#34 | 5.8%(-1.50)#3,469 |
| 35. | Wilsonville | 4.3% | 4.4%(-0.186)#35 | 5.8%(-1.52)#3,496 |
| 36. | Metzger | 4.2% | 4.4%(-0.194)#36 | 5.8%(-1.53)#3,501 |
| 37. | Wood Village | 4.1% | 4.4%(-0.308)#37 | 5.8%(-1.64)#3,588 |
| 38. | Sherwood | 4.1% | 4.4%(-0.330)#38 | 5.8%(-1.66)#3,604 |
| 39. | Eugene | 4.0% | 4.4%(-0.475)#39 | 5.8%(-1.81)#3,718 |
| 40. | Boring | 3.9% | 4.4%(-0.516)#40 | 5.8%(-1.85)#3,760 |
| 41. | Talent | 3.7% | 4.4%(-0.701)#41 | 5.8%(-2.03)#3,911 |
| 42. | Barview | 3.7% | 4.4%(-0.792)#42 | 5.8%(-2.12)#3,990 |
| 43. | Tualatin | 3.5% | 4.4%(-0.917)#43 | 5.8%(-2.25)#4,111 |
| 44. | Spray | 3.5% | 4.4%(-0.924)#44 | 5.8%(-2.26)#4,117 |
| 45. | Oatfield | 3.5% | 4.4%(-0.946)#45 | 5.8%(-2.28)#4,144 |
| 46. | Johnson City | 3.5% | 4.4%(-0.953)#46 | 5.8%(-2.28)#4,153 |
| 47. | Lincoln City | 3.5% | 4.4%(-0.989)#47 | 5.8%(-2.32)#4,192 |
| 48. | Troutdale | 3.4% | 4.4%(-1.02)#48 | 5.8%(-2.35)#4,234 |
| 49. | Ukiah | 3.4% | 4.4%(-1.05)#49 | 5.8%(-2.38)#4,253 |
| 50. | Mapleton | 3.3% | 4.4%(-1.10)#50 | 5.8%(-2.43)#4,314 |
| 51. | Salem | 3.3% | 4.4%(-1.14)#51 | 5.8%(-2.47)#4,358 |
| 52. | Yamhill | 3.2% | 4.4%(-1.23)#52 | 5.8%(-2.56)#4,476 |
| 53. | Warrenton | 3.2% | 4.4%(-1.24)#53 | 5.8%(-2.57)#4,485 |
| 54. | Maywood Park | 3.2% | 4.4%(-1.28)#54 | 5.8%(-2.61)#4,531 |
| 55. | John Day | 3.1% | 4.4%(-1.30)#55 | 5.8%(-2.63)#4,558 |
| 56. | Merlin | 3.1% | 4.4%(-1.35)#56 | 5.8%(-2.69)#4,617 |
| 57. | West Slope | 3.1% | 4.4%(-1.36)#57 | 5.8%(-2.70)#4,633 |
| 58. | Coburg | 3.0% | 4.4%(-1.45)#58 | 5.8%(-2.78)#4,753 |
| 59. | Cave Junction | 3.0% | 4.4%(-1.46)#59 | 5.8%(-2.79)#4,760 |
| 60. | Cascade Locks | 2.9% | 4.4%(-1.55)#60 | 5.8%(-2.88)#4,878 |
| 61. | Maupin | 2.8% | 4.4%(-1.63)#61 | 5.8%(-2.96)#4,999 |
| 62. | Weston | 2.7% | 4.4%(-1.75)#62 | 5.8%(-3.08)#5,166 |
| 63. | Four Corners | 2.6% | 4.4%(-1.84)#63 | 5.8%(-3.17)#5,294 |
| 64. | Roseburg North | 2.5% | 4.4%(-1.92)#64 | 5.8%(-3.25)#5,394 |
| 65. | Carlton | 2.5% | 4.4%(-1.92)#65 | 5.8%(-3.25)#5,397 |
| 66. | Canyonville | 2.5% | 4.4%(-1.93)#66 | 5.8%(-3.26)#5,406 |
| 67. | Milwaukie | 2.5% | 4.4%(-1.96)#67 | 5.8%(-3.29)#5,463 |
| 68. | Kirkpatrick | 2.5% | 4.4%(-1.96)#68 | 5.8%(-3.29)#5,465 |
| 69. | Newberg | 2.5% | 4.4%(-1.99)#69 | 5.8%(-3.32)#5,503 |
| 70. | Gates | 2.4% | 4.4%(-2.00)#70 | 5.8%(-3.33)#5,524 |
| 71. | Monmouth | 2.4% | 4.4%(-2.02)#71 | 5.8%(-3.35)#5,554 |
| 72. | Gearhart | 2.4% | 4.4%(-2.06)#72 | 5.8%(-3.39)#5,625 |
| 73. | Forest Grove | 2.3% | 4.4%(-2.12)#73 | 5.8%(-3.45)#5,730 |
| 74. | Florence | 2.3% | 4.4%(-2.12)#74 | 5.8%(-3.45)#5,733 |
| 75. | Beavercreek | 2.3% | 4.4%(-2.19)#75 | 5.8%(-3.52)#5,858 |
| 76. | Cherry Grove | 2.2% | 4.4%(-2.19)#76 | 5.8%(-3.52)#5,862 |
| 77. | Hayesville | 2.2% | 4.4%(-2.20)#77 | 5.8%(-3.53)#5,872 |
| 78. | Halfway | 2.2% | 4.4%(-2.27)#78 | 5.8%(-3.60)#6,020 |
| 79. | Heceta Beach | 2.2% | 4.4%(-2.27)#79 | 5.8%(-3.60)#6,021 |
| 80. | Green | 2.1% | 4.4%(-2.31)#80 | 5.8%(-3.64)#6,090 |
| 81. | River Road | 2.1% | 4.4%(-2.32)#81 | 5.8%(-3.65)#6,117 |
| 82. | Jennings Lodge | 2.1% | 4.4%(-2.35)#82 | 5.8%(-3.68)#6,204 |
| 83. | Canby | 2.1% | 4.4%(-2.36)#83 | 5.8%(-3.69)#6,224 |
| 84. | Lakeview | 2.0% | 4.4%(-2.44)#84 | 5.8%(-3.77)#6,369 |
| 85. | Gladstone | 2.0% | 4.4%(-2.44)#85 | 5.8%(-3.77)#6,374 |
| 86. | Monroe | 2.0% | 4.4%(-2.45)#86 | 5.8%(-3.78)#6,399 |
| 87. | Government Camp | 2.0% | 4.4%(-2.46)#87 | 5.8%(-3.79)#6,427 |
| 88. | Brooks | 1.9% | 4.4%(-2.51)#88 | 5.8%(-3.84)#6,527 |
| 89. | Columbia City | 1.9% | 4.4%(-2.52)#89 | 5.8%(-3.85)#6,554 |
| 90. | Barlow | 1.9% | 4.4%(-2.53)#90 | 5.8%(-3.86)#6,561 |
| 91. | Mosier | 1.9% | 4.4%(-2.54)#91 | 5.8%(-3.87)#6,581 |
| 92. | Oregon City | 1.9% | 4.4%(-2.55)#92 | 5.8%(-3.88)#6,609 |
| 93. | Springfield | 1.8% | 4.4%(-2.60)#93 | 5.8%(-3.93)#6,707 |
| 94. | Adams | 1.8% | 4.4%(-2.60)#94 | 5.8%(-3.94)#6,724 |
| 95. | Sandy | 1.8% | 4.4%(-2.63)#95 | 5.8%(-3.96)#6,794 |
| 96. | Drain | 1.8% | 4.4%(-2.64)#96 | 5.8%(-3.97)#6,825 |
| 97. | Ashland | 1.7% | 4.4%(-2.72)#97 | 5.8%(-4.05)#6,997 |
| 98. | Boardman | 1.7% | 4.4%(-2.72)#98 | 5.8%(-4.05)#7,001 |
| 99. | Santa Clara | 1.7% | 4.4%(-2.72)#99 | 5.8%(-4.05)#7,004 |
| 100. | Oak Grove | 1.7% | 4.4%(-2.74)#100 | 5.8%(-4.07)#7,066 |
Common Questions
What are the Top 10 Cities with the Highest Percentage of Asian Population in Oregon?
Top 10 Cities with the Highest Percentage of Asian Population in Oregon are:
#1
38.6%
#2
37.7%
#3
21.3%
#4
19.6%
#5
18.1%
#6
14.3%
#7
11.9%
#8
11.5%
#9
11.2%
#10
10.7%
What city has the Highest Percentage of Asian Population in Oregon?
Bethany has the Highest Percentage of Asian Population in Oregon with 38.6%.
What is the Percentage of Asian Population in the State of Oregon?
Percentage of Asian Population in Oregon is 4.4%.
What is the Percentage of Asian Population in the United States?
Percentage of Asian Population in the United States is 5.8%.