Rutherford borough, NJ Map & Demographics
Rutherford borough Overview
$57,150
PER CAPITA INCOME
$151,812
AVG FAMILY INCOME
$128,576
AVG HOUSEHOLD INCOME
15.8%
WAGE / INCOME GAP [ % ]
84.2¢/ $1
WAGE / INCOME GAP [ $ ]
0.41
INEQUALITY / GINI INDEX
18,754
TOTAL POPULATION
9,306
MALE POPULATION
9,448
FEMALE POPULATION
98.50
MALES / 100 FEMALES
101.53
FEMALES / 100 MALES
40.5
MEDIAN AGE
3.2
AVG FAMILY SIZE
2.7
AVG HOUSEHOLD SIZE
10,574
LABOR FORCE [ PEOPLE ]
67.1%
PERCENT IN LABOR FORCE
3.3%
UNEMPLOYMENT RATE
Income in Rutherford borough
Income Overview in Rutherford borough
Per Capita Income in Rutherford borough is $57,150, while median incomes of families and households are $151,812 and $128,576 respectively.
| Characteristic | Number | Measure |
| Per Capita Income | 18,754 | $57,150 |
| Median Family Income | 4,786 | $151,812 |
| Mean Family Income | 4,786 | $178,621 |
| Median Household Income | 6,755 | $128,576 |
| Mean Household Income | 6,755 | $156,043 |
| Income Deficit | 4,786 | $0 |
| Wage / Income Gap (%) | 18,754 | 15.79% |
| Wage / Income Gap ($) | 18,754 | 84.21¢ per $1 |
| Gini / Inequality Index | 18,754 | 0.41 |
Earnings by Sex in Rutherford borough
Average Earnings in Rutherford borough are $67,297, $74,242 for men and $62,517 for women, a difference of 15.8%.
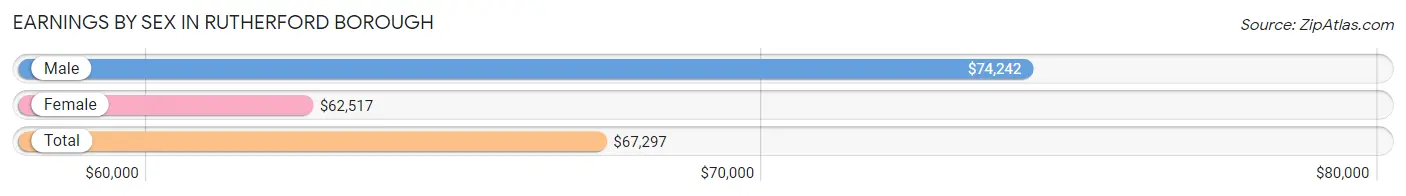
| Sex | Number | Average Earnings |
| Male | 5,726 (52.7%) | $74,242 |
| Female | 5,134 (47.3%) | $62,517 |
| Total | 10,860 (100.0%) | $67,297 |
Earnings by Sex by Income Bracket in Rutherford borough
The most common earnings brackets in Rutherford borough are $100,000+ for men (1,957 | 34.2%) and $100,000+ for women (1,303 | 25.4%).
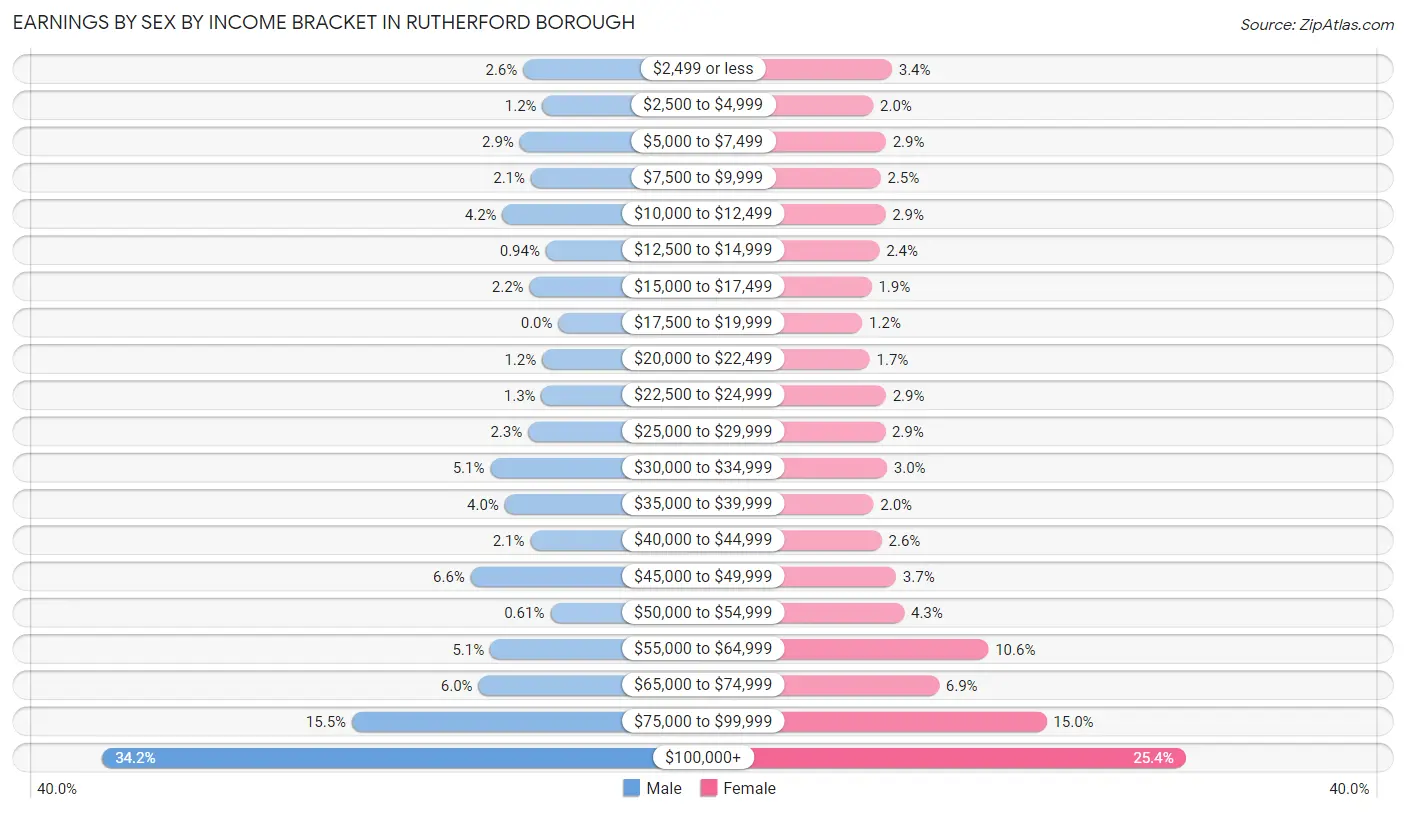
| Income | Male | Female |
| $2,499 or less | 151 (2.6%) | 173 (3.4%) |
| $2,500 to $4,999 | 68 (1.2%) | 101 (2.0%) |
| $5,000 to $7,499 | 166 (2.9%) | 150 (2.9%) |
| $7,500 to $9,999 | 118 (2.1%) | 130 (2.5%) |
| $10,000 to $12,499 | 240 (4.2%) | 148 (2.9%) |
| $12,500 to $14,999 | 54 (0.9%) | 125 (2.4%) |
| $15,000 to $17,499 | 124 (2.2%) | 95 (1.8%) |
| $17,500 to $19,999 | 0 (0.0%) | 59 (1.1%) |
| $20,000 to $22,499 | 70 (1.2%) | 88 (1.7%) |
| $22,500 to $24,999 | 73 (1.3%) | 150 (2.9%) |
| $25,000 to $29,999 | 130 (2.3%) | 147 (2.9%) |
| $30,000 to $34,999 | 292 (5.1%) | 154 (3.0%) |
| $35,000 to $39,999 | 230 (4.0%) | 102 (2.0%) |
| $40,000 to $44,999 | 120 (2.1%) | 134 (2.6%) |
| $45,000 to $49,999 | 376 (6.6%) | 189 (3.7%) |
| $50,000 to $54,999 | 35 (0.6%) | 220 (4.3%) |
| $55,000 to $64,999 | 293 (5.1%) | 544 (10.6%) |
| $65,000 to $74,999 | 343 (6.0%) | 354 (6.9%) |
| $75,000 to $99,999 | 886 (15.5%) | 768 (15.0%) |
| $100,000+ | 1,957 (34.2%) | 1,303 (25.4%) |
| Total | 5,726 (100.0%) | 5,134 (100.0%) |
Earnings by Sex by Educational Attainment in Rutherford borough
Average earnings in Rutherford borough are $79,237 for men and $71,943 for women, a difference of 9.2%. Men with an educational attainment of graduate degree enjoy the highest average annual earnings of $109,219, while those with less than high school education earn the least with $35,652. Women with an educational attainment of graduate degree earn the most with the average annual earnings of $87,074, while those with less than high school education have the smallest earnings of $46,250.
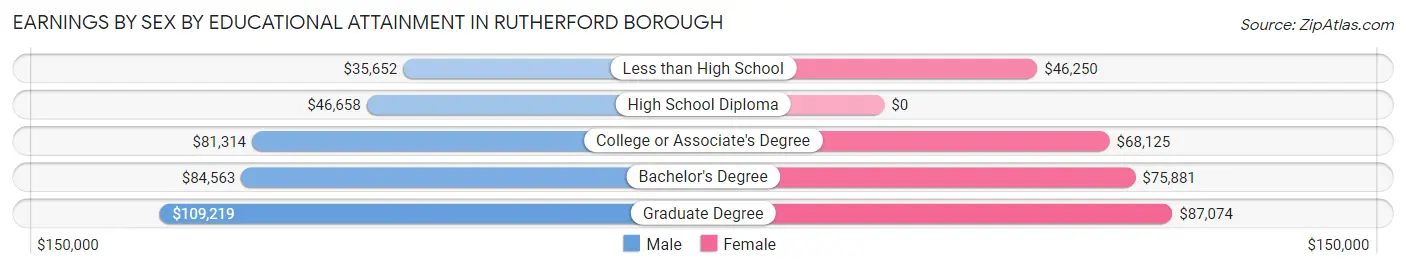
| Educational Attainment | Male Income | Female Income |
| Less than High School | $35,652 | $46,250 |
| High School Diploma | $46,658 | $0 |
| College or Associate's Degree | $81,314 | $68,125 |
| Bachelor's Degree | $84,563 | $75,881 |
| Graduate Degree | $109,219 | $87,074 |
| Total | $79,237 | $71,943 |
Family Income in Rutherford borough
Family Income Brackets in Rutherford borough
According to the Rutherford borough family income data, there are 1,689 families falling into the $200,000+ income range, which is the most common income bracket and makes up 35.3% of all families. Conversely, the less than $10,000 income bracket is the least frequent group with only 19 families (0.4%) belonging to this category.
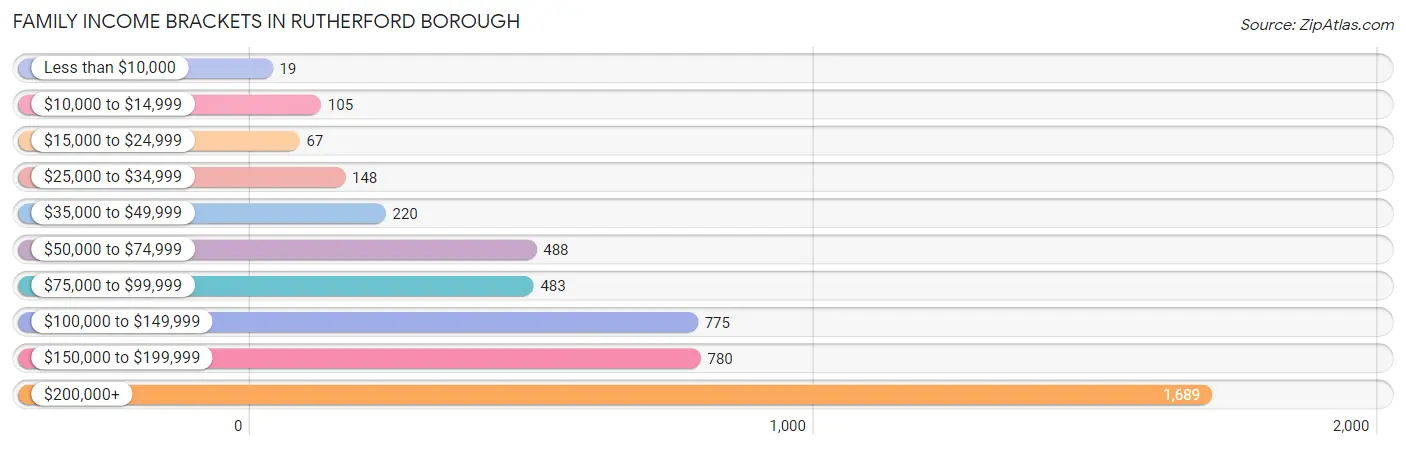
| Income Bracket | # Families | % Families |
| Less than $10,000 | 19 | 0.4% |
| $10,000 to $14,999 | 105 | 2.2% |
| $15,000 to $24,999 | 67 | 1.4% |
| $25,000 to $34,999 | 148 | 3.1% |
| $35,000 to $49,999 | 220 | 4.6% |
| $50,000 to $74,999 | 488 | 10.2% |
| $75,000 to $99,999 | 483 | 10.1% |
| $100,000 to $149,999 | 775 | 16.2% |
| $150,000 to $199,999 | 780 | 16.3% |
| $200,000+ | 1,689 | 35.3% |
Family Income by Famaliy Size in Rutherford borough
5-person families (493 | 10.3%) account for the highest median family income in Rutherford borough with $207,083 per family, while 3-person families (1,017 | 21.2%) have the highest median income of $51,973 per family member.
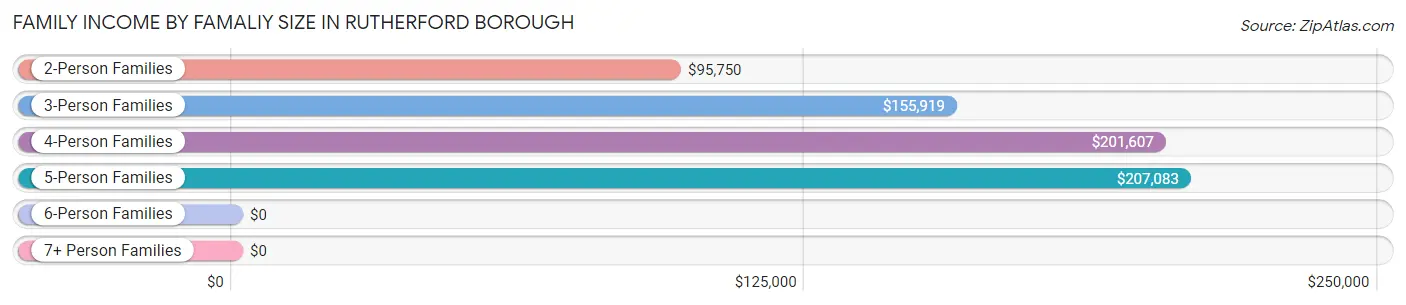
| Income Bracket | # Families | Median Income |
| 2-Person Families | 1,948 (40.7%) | $95,750 |
| 3-Person Families | 1,017 (21.2%) | $155,919 |
| 4-Person Families | 1,251 (26.1%) | $201,607 |
| 5-Person Families | 493 (10.3%) | $207,083 |
| 6-Person Families | 76 (1.6%) | $0 |
| 7+ Person Families | 1 (0.0%) | $0 |
| Total | 4,786 (100.0%) | $151,812 |
Family Income by Number of Earners in Rutherford borough
The median family income in Rutherford borough is $151,812, with families comprising 3+ earners (780) having the highest median family income of $226,618, while families with no earners (516) have the lowest median family income of $40,000, accounting for 16.3% and 10.8% of families, respectively.
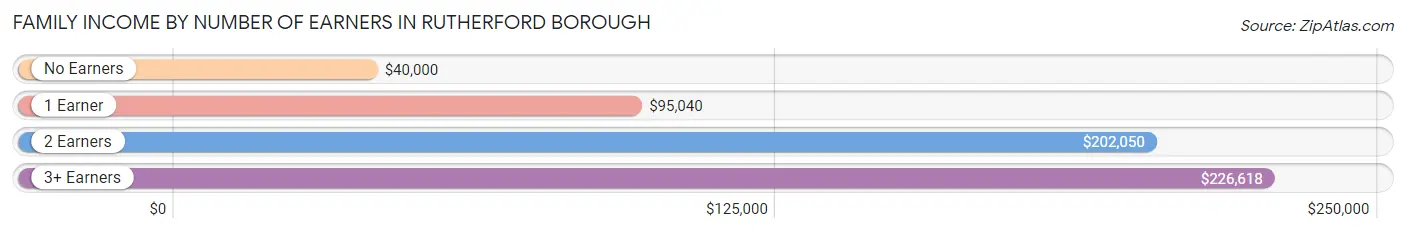
| Number of Earners | # Families | Median Income |
| No Earners | 516 (10.8%) | $40,000 |
| 1 Earner | 1,439 (30.1%) | $95,040 |
| 2 Earners | 2,051 (42.8%) | $202,050 |
| 3+ Earners | 780 (16.3%) | $226,618 |
| Total | 4,786 (100.0%) | $151,812 |
Household Income in Rutherford borough
Household Income Brackets in Rutherford borough
With 1,804 households falling in the category, the $200,000+ income range is the most frequent in Rutherford borough, accounting for 26.7% of all households. In contrast, only 95 households (1.4%) fall into the less than $10,000 income bracket, making it the least populous group.
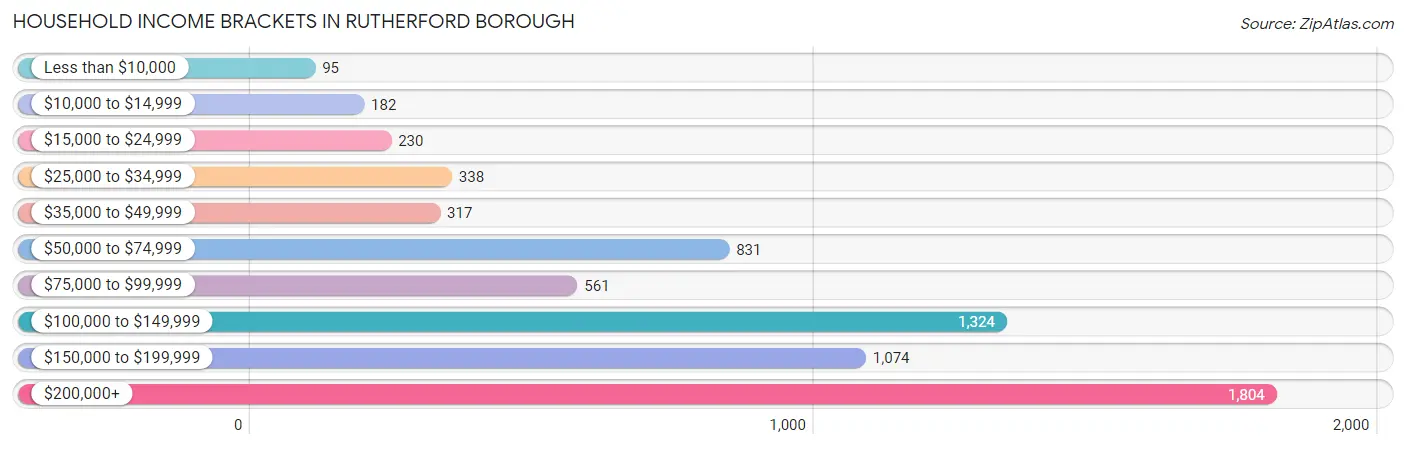
| Income Bracket | # Households | % Households |
| Less than $10,000 | 95 | 1.4% |
| $10,000 to $14,999 | 182 | 2.7% |
| $15,000 to $24,999 | 230 | 3.4% |
| $25,000 to $34,999 | 338 | 5.0% |
| $35,000 to $49,999 | 317 | 4.7% |
| $50,000 to $74,999 | 831 | 12.3% |
| $75,000 to $99,999 | 561 | 8.3% |
| $100,000 to $149,999 | 1,324 | 19.6% |
| $150,000 to $199,999 | 1,074 | 15.9% |
| $200,000+ | 1,804 | 26.7% |
Household Income by Householder Age in Rutherford borough
The median household income in Rutherford borough is $128,576, with the highest median household income of $166,200 found in the 45 to 64 years age bracket for the primary householder. A total of 2,831 households (41.9%) fall into this category. Meanwhile, the 15 to 24 years age bracket for the primary householder has the lowest median household income of $0, with 72 households (1.1%) in this group.
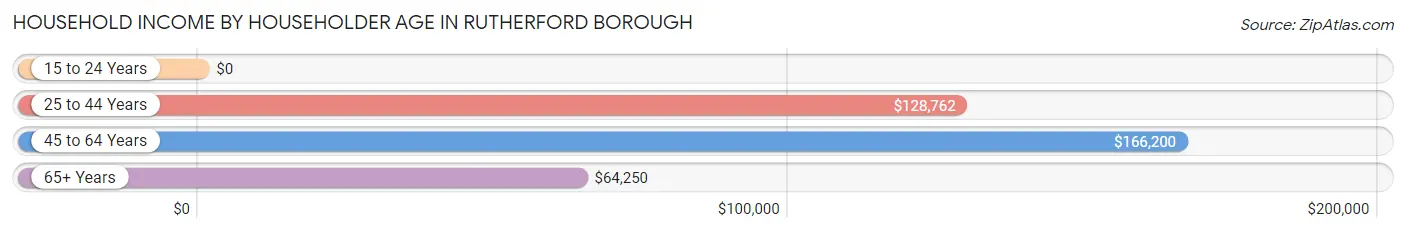
| Income Bracket | # Households | Median Income |
| 15 to 24 Years | 72 (1.1%) | $0 |
| 25 to 44 Years | 2,093 (31.0%) | $128,762 |
| 45 to 64 Years | 2,831 (41.9%) | $166,200 |
| 65+ Years | 1,759 (26.0%) | $64,250 |
| Total | 6,755 (100.0%) | $128,576 |
Poverty in Rutherford borough
Income Below Poverty by Sex and Age in Rutherford borough
With 3.7% poverty level for males and 4.5% for females among the residents of Rutherford borough, 16 and 17 year old males and 75 year old and over females are the most vulnerable to poverty, with 38 males (11.2%) and 140 females (16.0%) in their respective age groups living below the poverty level.
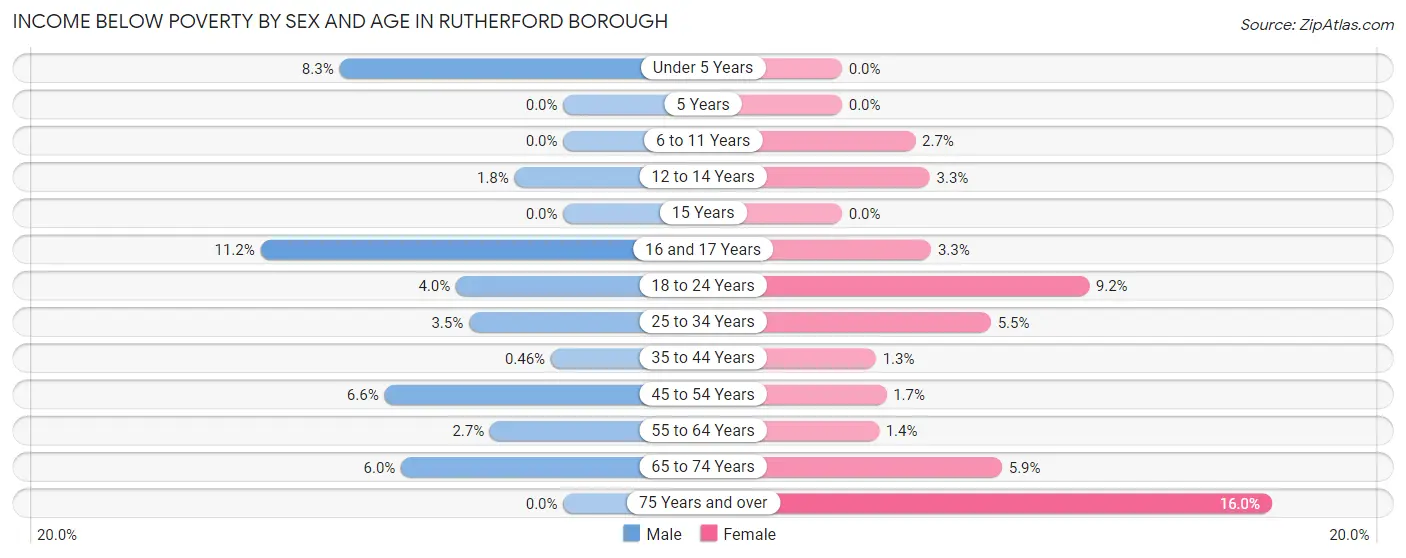
| Age Bracket | Male | Female |
| Under 5 Years | 30 (8.3%) | 0 (0.0%) |
| 5 Years | 0 (0.0%) | 0 (0.0%) |
| 6 to 11 Years | 0 (0.0%) | 17 (2.7%) |
| 12 to 14 Years | 7 (1.8%) | 9 (3.3%) |
| 15 Years | 0 (0.0%) | 0 (0.0%) |
| 16 and 17 Years | 38 (11.2%) | 9 (3.3%) |
| 18 to 24 Years | 38 (4.0%) | 77 (9.2%) |
| 25 to 34 Years | 43 (3.5%) | 51 (5.5%) |
| 35 to 44 Years | 6 (0.5%) | 17 (1.3%) |
| 45 to 54 Years | 106 (6.6%) | 25 (1.7%) |
| 55 to 64 Years | 27 (2.7%) | 16 (1.4%) |
| 65 to 74 Years | 40 (6.0%) | 52 (5.9%) |
| 75 Years and over | 0 (0.0%) | 140 (16.0%) |
| Total | 335 (3.7%) | 413 (4.5%) |
Income Above Poverty by Sex and Age in Rutherford borough
According to the poverty statistics in Rutherford borough, males aged 5 years and females aged under 5 years are the age groups that are most secure financially, with 100.0% of males and 100.0% of females in these age groups living above the poverty line.
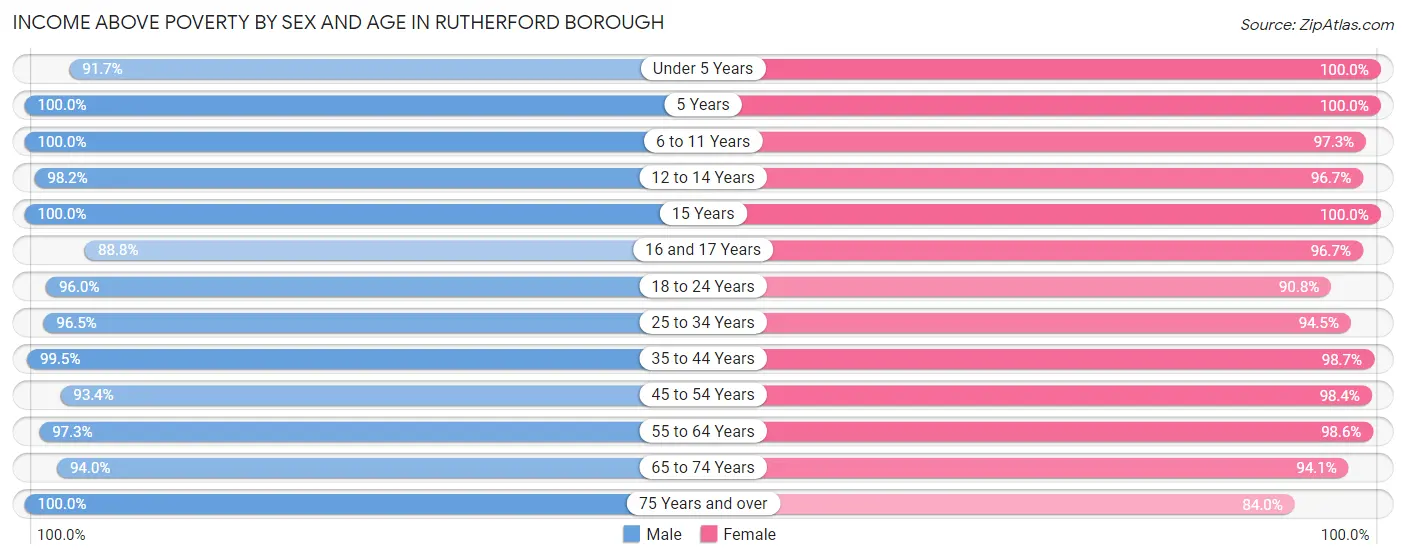
| Age Bracket | Male | Female |
| Under 5 Years | 331 (91.7%) | 291 (100.0%) |
| 5 Years | 41 (100.0%) | 114 (100.0%) |
| 6 to 11 Years | 553 (100.0%) | 607 (97.3%) |
| 12 to 14 Years | 380 (98.2%) | 267 (96.7%) |
| 15 Years | 211 (100.0%) | 77 (100.0%) |
| 16 and 17 Years | 300 (88.8%) | 263 (96.7%) |
| 18 to 24 Years | 916 (96.0%) | 763 (90.8%) |
| 25 to 34 Years | 1,187 (96.5%) | 871 (94.5%) |
| 35 to 44 Years | 1,302 (99.5%) | 1,330 (98.7%) |
| 45 to 54 Years | 1,490 (93.4%) | 1,490 (98.4%) |
| 55 to 64 Years | 966 (97.3%) | 1,153 (98.6%) |
| 65 to 74 Years | 624 (94.0%) | 824 (94.1%) |
| 75 Years and over | 493 (100.0%) | 737 (84.0%) |
| Total | 8,794 (96.3%) | 8,787 (95.5%) |
Income Below Poverty Among Married-Couple Families in Rutherford borough
The poverty statistics for married-couple families in Rutherford borough show that 0.8% or 28 of the total 3,670 families live below the poverty line. Families with 3 or 4 children have the highest poverty rate of 11.3%, comprising of 20 families. On the other hand, families with no children have the lowest poverty rate of 0.0%, which includes 0 families.
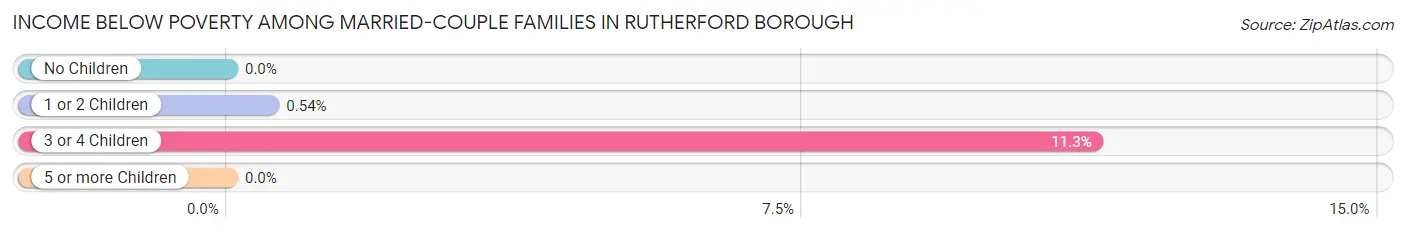
| Children | Above Poverty | Below Poverty |
| No Children | 2,020 (100.0%) | 0 (0.0%) |
| 1 or 2 Children | 1,464 (99.5%) | 8 (0.5%) |
| 3 or 4 Children | 157 (88.7%) | 20 (11.3%) |
| 5 or more Children | 1 (100.0%) | 0 (0.0%) |
| Total | 3,642 (99.2%) | 28 (0.8%) |
Income Below Poverty Among Single-Parent Households in Rutherford borough
According to the poverty data in Rutherford borough, 11.6% or 32 single-father households and 14.1% or 118 single-mother households are living below the poverty line. Among single-father households, those with no children have the highest poverty rate, with 18 households (17.1%) experiencing poverty. Likewise, among single-mother households, those with no children have the highest poverty rate, with 107 households (27.4%) falling below the poverty line.
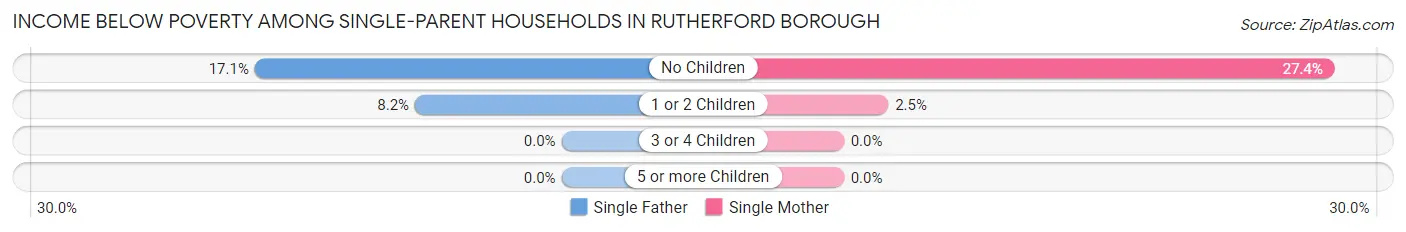
| Children | Single Father | Single Mother |
| No Children | 18 (17.1%) | 107 (27.4%) |
| 1 or 2 Children | 14 (8.2%) | 11 (2.5%) |
| 3 or 4 Children | 0 (0.0%) | 0 (0.0%) |
| 5 or more Children | 0 (0.0%) | 0 (0.0%) |
| Total | 32 (11.6%) | 118 (14.1%) |
Income Below Poverty Among Married-Couple vs Single-Parent Households in Rutherford borough
The poverty data for Rutherford borough shows that 28 of the married-couple family households (0.8%) and 150 of the single-parent households (13.4%) are living below the poverty level. Within the married-couple family households, those with 3 or 4 children have the highest poverty rate, with 20 households (11.3%) falling below the poverty line. Among the single-parent households, those with no children have the highest poverty rate, with 125 household (25.3%) living below poverty.
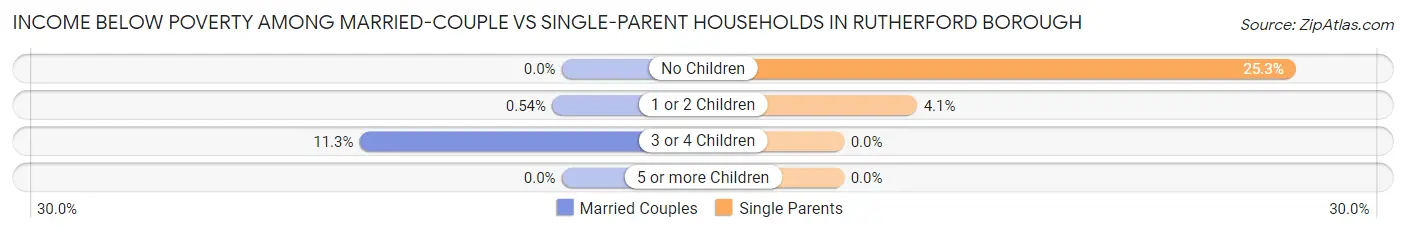
| Children | Married-Couple Families | Single-Parent Households |
| No Children | 0 (0.0%) | 125 (25.3%) |
| 1 or 2 Children | 8 (0.5%) | 25 (4.1%) |
| 3 or 4 Children | 20 (11.3%) | 0 (0.0%) |
| 5 or more Children | 0 (0.0%) | 0 (0.0%) |
| Total | 28 (0.8%) | 150 (13.4%) |
Race in Rutherford borough
The most populous races in Rutherford borough are White / Caucasian (12,658 | 67.5%), Hispanic or Latino (3,973 | 21.2%), and Asian (2,951 | 15.7%).
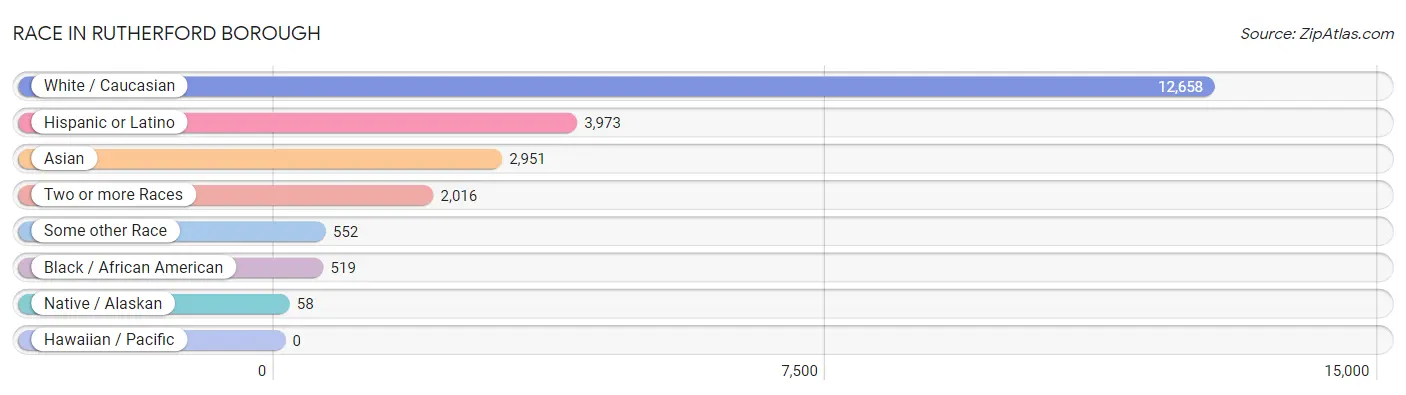
| Race | # Population | % Population |
| Asian | 2,951 | 15.7% |
| Black / African American | 519 | 2.8% |
| Hawaiian / Pacific | 0 | 0.0% |
| Hispanic or Latino | 3,973 | 21.2% |
| Native / Alaskan | 58 | 0.3% |
| White / Caucasian | 12,658 | 67.5% |
| Two or more Races | 2,016 | 10.7% |
| Some other Race | 552 | 2.9% |
| Total | 18,754 | 100.0% |
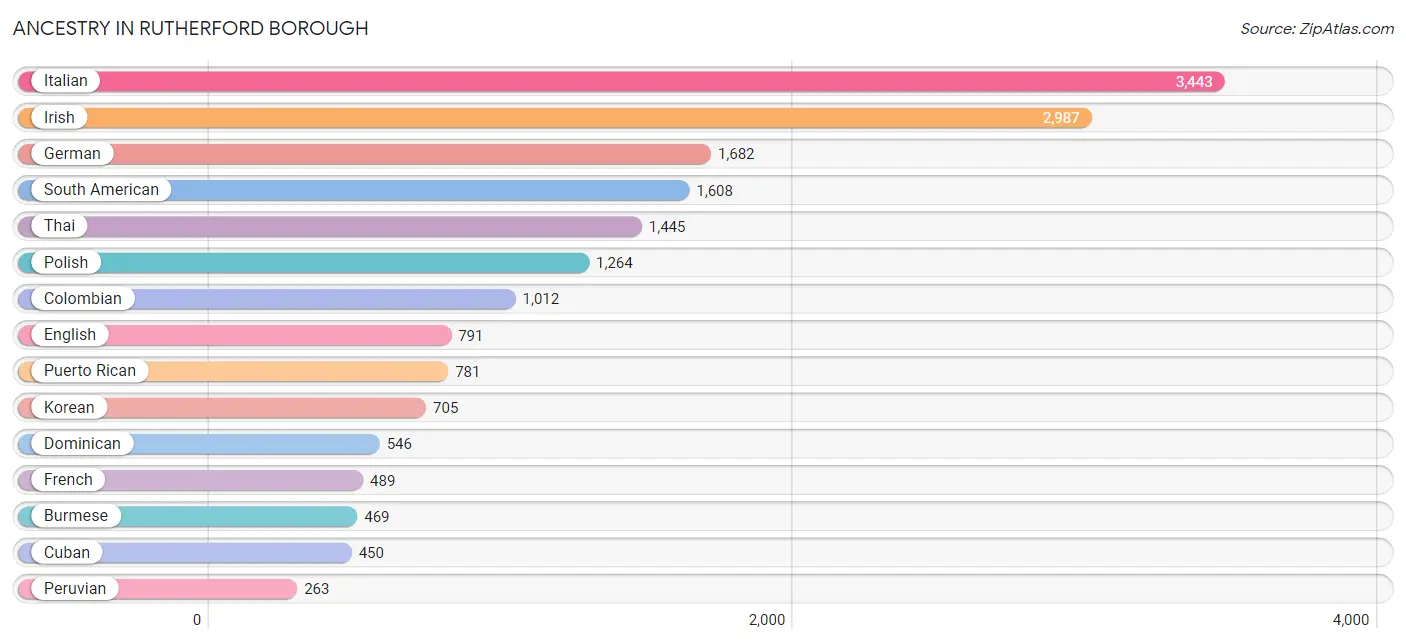
Ancestry in Rutherford borough
The most populous ancestries reported in Rutherford borough are Italian (3,443 | 18.4%), Irish (2,987 | 15.9%), German (1,682 | 9.0%), South American (1,608 | 8.6%), and Thai (1,445 | 7.7%), together accounting for 59.5% of all Rutherford borough residents.
| Ancestry | # Population | % Population |
| African | 79 | 0.4% |
| Albanian | 17 | 0.1% |
| American | 260 | 1.4% |
| Arab | 128 | 0.7% |
| Argentinean | 46 | 0.3% |
| Armenian | 15 | 0.1% |
| Australian | 64 | 0.3% |
| Austrian | 43 | 0.2% |
| Bahamian | 51 | 0.3% |
| Belgian | 12 | 0.1% |
| Bhutanese | 132 | 0.7% |
| Bolivian | 74 | 0.4% |
| British | 39 | 0.2% |
| British West Indian | 18 | 0.1% |
| Burmese | 469 | 2.5% |
| Central American | 246 | 1.3% |
| Cherokee | 6 | 0.0% |
| Chickasaw | 47 | 0.3% |
| Chilean | 10 | 0.1% |
| Colombian | 1,012 | 5.4% |
| Costa Rican | 57 | 0.3% |
| Croatian | 51 | 0.3% |
| Cuban | 450 | 2.4% |
| Cypriot | 20 | 0.1% |
| Czech | 38 | 0.2% |
| Czechoslovakian | 18 | 0.1% |
| Danish | 21 | 0.1% |
| Dominican | 546 | 2.9% |
| Dutch | 181 | 1.0% |
| Eastern European | 49 | 0.3% |
| Ecuadorian | 151 | 0.8% |
| Egyptian | 62 | 0.3% |
| English | 791 | 4.2% |
| Ethiopian | 12 | 0.1% |
| European | 121 | 0.6% |
| French | 489 | 2.6% |
| German | 1,682 | 9.0% |
| Greek | 90 | 0.5% |
| Guatemalan | 53 | 0.3% |
| Haitian | 11 | 0.1% |
| Honduran | 94 | 0.5% |
| Hungarian | 56 | 0.3% |
| Indian (Asian) | 247 | 1.3% |
| Iranian | 44 | 0.2% |
| Irish | 2,987 | 15.9% |
| Israeli | 64 | 0.3% |
| Italian | 3,443 | 18.4% |
| Jamaican | 25 | 0.1% |
| Japanese | 21 | 0.1% |
| Korean | 705 | 3.8% |
| Lebanese | 45 | 0.2% |
| Lithuanian | 85 | 0.4% |
| Macedonian | 23 | 0.1% |
| Mexican | 57 | 0.3% |
| Mexican American Indian | 35 | 0.2% |
| Nigerian | 3 | 0.0% |
| Northern European | 18 | 0.1% |
| Norwegian | 40 | 0.2% |
| Okinawan | 12 | 0.1% |
| Pakistani | 117 | 0.6% |
| Peruvian | 263 | 1.4% |
| Polish | 1,264 | 6.7% |
| Portuguese | 204 | 1.1% |
| Puerto Rican | 781 | 4.2% |
| Romanian | 13 | 0.1% |
| Russian | 231 | 1.2% |
| Salvadoran | 42 | 0.2% |
| Scotch-Irish | 102 | 0.5% |
| Scottish | 103 | 0.5% |
| Serbian | 63 | 0.3% |
| Slavic | 13 | 0.1% |
| Slovak | 9 | 0.1% |
| South American | 1,608 | 8.6% |
| Spaniard | 232 | 1.2% |
| Spanish | 35 | 0.2% |
| Sri Lankan | 95 | 0.5% |
| Subsaharan African | 94 | 0.5% |
| Swedish | 117 | 0.6% |
| Swiss | 26 | 0.1% |
| Syrian | 31 | 0.2% |
| Thai | 1,445 | 7.7% |
| Turkish | 172 | 0.9% |
| Ugandan | 40 | 0.2% |
| Ukrainian | 153 | 0.8% |
| Uruguayan | 52 | 0.3% |
| Welsh | 59 | 0.3% |
| West Indian | 6 | 0.0% | View All 87 Rows |
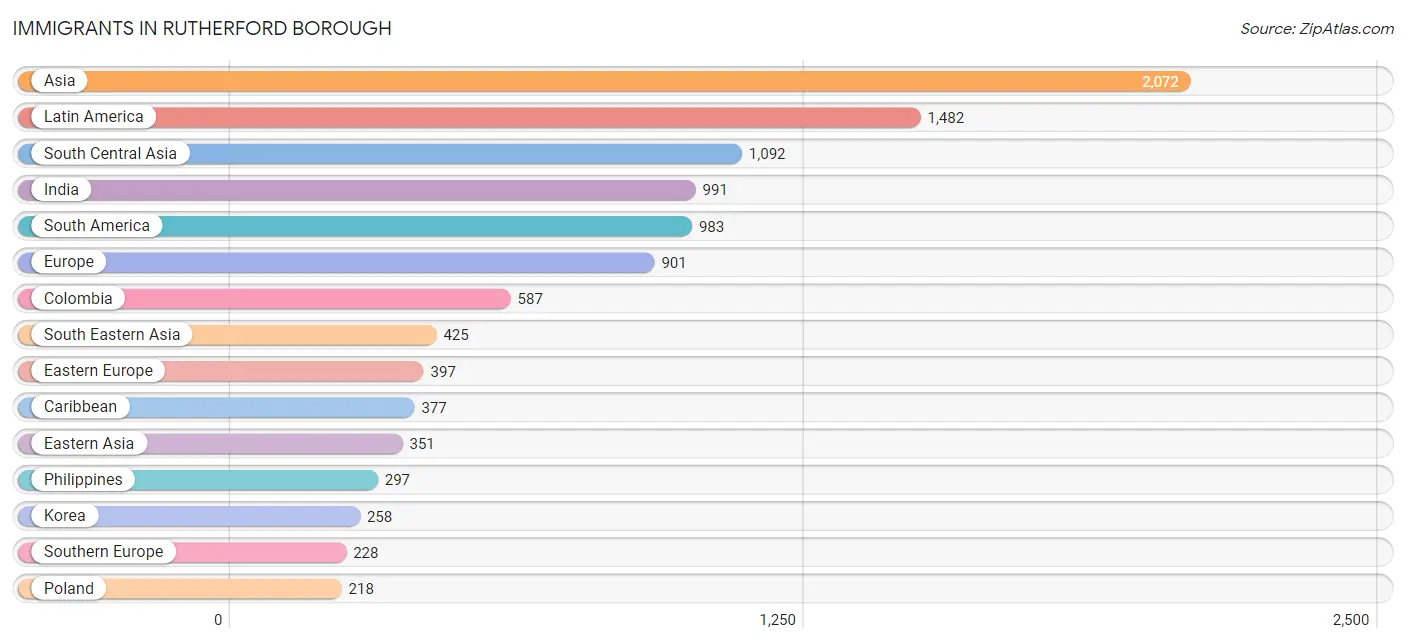
Immigrants in Rutherford borough
The most numerous immigrant groups reported in Rutherford borough came from Asia (2,072 | 11.1%), Latin America (1,482 | 7.9%), South Central Asia (1,092 | 5.8%), India (991 | 5.3%), and South America (983 | 5.2%), together accounting for 35.3% of all Rutherford borough residents.
| Immigration Origin | # Population | % Population |
| Afghanistan | 17 | 0.1% |
| Africa | 114 | 0.6% |
| Albania | 17 | 0.1% |
| Argentina | 51 | 0.3% |
| Asia | 2,072 | 11.1% |
| Australia | 39 | 0.2% |
| Austria | 7 | 0.0% |
| Bahamas | 13 | 0.1% |
| Bolivia | 40 | 0.2% |
| Cambodia | 44 | 0.2% |
| Canada | 20 | 0.1% |
| Caribbean | 377 | 2.0% |
| Central America | 122 | 0.6% |
| Chile | 87 | 0.5% |
| China | 73 | 0.4% |
| Colombia | 587 | 3.1% |
| Costa Rica | 41 | 0.2% |
| Cuba | 183 | 1.0% |
| Dominican Republic | 142 | 0.8% |
| Eastern Africa | 58 | 0.3% |
| Eastern Asia | 351 | 1.9% |
| Eastern Europe | 397 | 2.1% |
| Ecuador | 105 | 0.6% |
| Egypt | 46 | 0.3% |
| El Salvador | 9 | 0.1% |
| England | 1 | 0.0% |
| Europe | 901 | 4.8% |
| France | 47 | 0.3% |
| Germany | 12 | 0.1% |
| Grenada | 29 | 0.2% |
| Honduras | 31 | 0.2% |
| Hong Kong | 31 | 0.2% |
| India | 991 | 5.3% |
| Iran | 50 | 0.3% |
| Ireland | 171 | 0.9% |
| Israel | 51 | 0.3% |
| Italy | 105 | 0.6% |
| Japan | 20 | 0.1% |
| Korea | 258 | 1.4% |
| Kuwait | 10 | 0.1% |
| Latin America | 1,482 | 7.9% |
| Mexico | 29 | 0.2% |
| Nepal | 17 | 0.1% |
| North Macedonia | 23 | 0.1% |
| Northern Africa | 46 | 0.3% |
| Northern Europe | 210 | 1.1% |
| Oceania | 39 | 0.2% |
| Panama | 12 | 0.1% |
| Peru | 113 | 0.6% |
| Philippines | 297 | 1.6% |
| Poland | 218 | 1.2% |
| Portugal | 29 | 0.2% |
| Russia | 38 | 0.2% |
| Scotland | 11 | 0.1% |
| Singapore | 16 | 0.1% |
| South America | 983 | 5.2% |
| South Central Asia | 1,092 | 5.8% |
| South Eastern Asia | 425 | 2.3% |
| Southern Europe | 228 | 1.2% |
| Spain | 94 | 0.5% |
| Sri Lanka | 17 | 0.1% |
| Syria | 18 | 0.1% |
| Taiwan | 10 | 0.1% |
| Thailand | 56 | 0.3% |
| Turkey | 110 | 0.6% |
| Uganda | 49 | 0.3% |
| Ukraine | 94 | 0.5% |
| Vietnam | 12 | 0.1% |
| Western Asia | 204 | 1.1% |
| Western Europe | 66 | 0.4% |
| Zimbabwe | 9 | 0.1% | View All 71 Rows |
Sex and Age in Rutherford borough
Sex and Age in Rutherford borough
The most populous age groups in Rutherford borough are 15 to 19 Years (979 | 10.5%) for men and 55 to 59 Years (867 | 9.2%) for women.
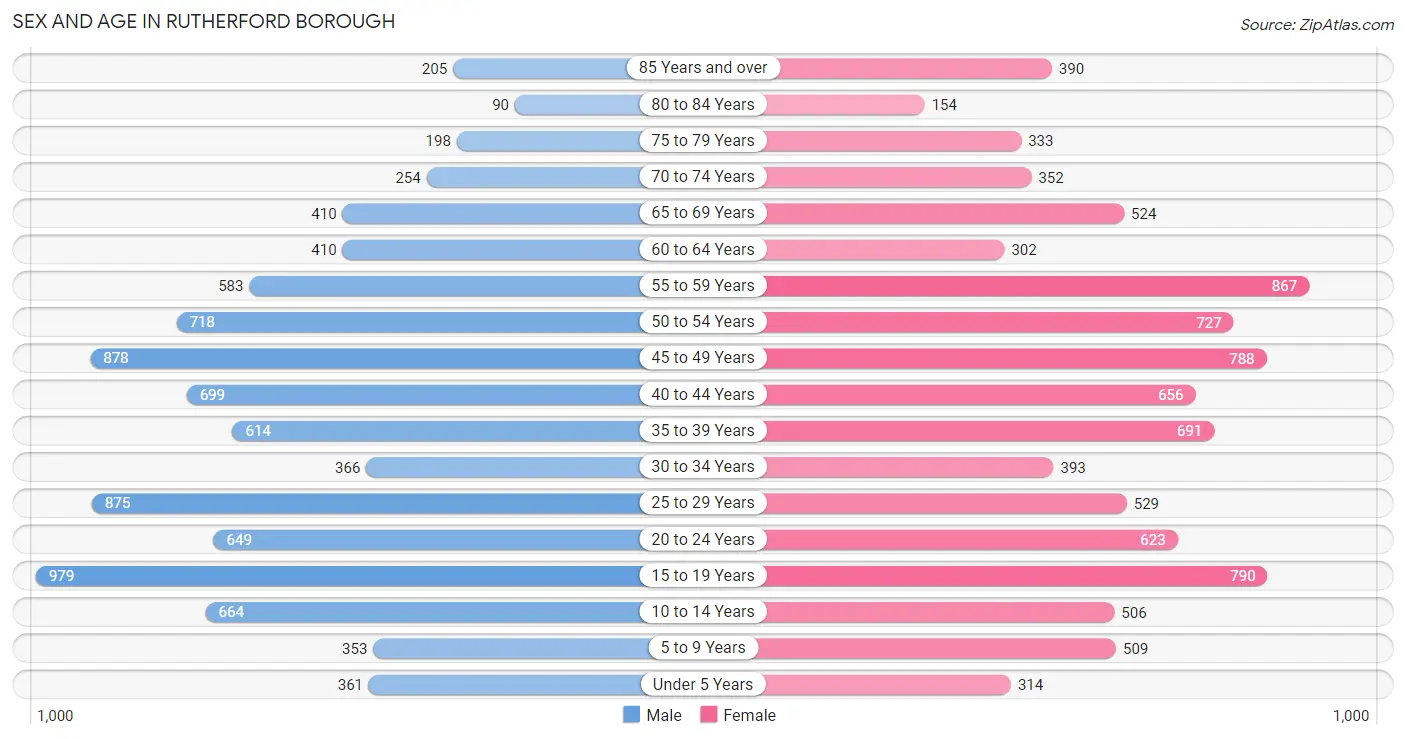
| Age Bracket | Male | Female |
| Under 5 Years | 361 (3.9%) | 314 (3.3%) |
| 5 to 9 Years | 353 (3.8%) | 509 (5.4%) |
| 10 to 14 Years | 664 (7.1%) | 506 (5.4%) |
| 15 to 19 Years | 979 (10.5%) | 790 (8.4%) |
| 20 to 24 Years | 649 (7.0%) | 623 (6.6%) |
| 25 to 29 Years | 875 (9.4%) | 529 (5.6%) |
| 30 to 34 Years | 366 (3.9%) | 393 (4.2%) |
| 35 to 39 Years | 614 (6.6%) | 691 (7.3%) |
| 40 to 44 Years | 699 (7.5%) | 656 (6.9%) |
| 45 to 49 Years | 878 (9.4%) | 788 (8.3%) |
| 50 to 54 Years | 718 (7.7%) | 727 (7.7%) |
| 55 to 59 Years | 583 (6.3%) | 867 (9.2%) |
| 60 to 64 Years | 410 (4.4%) | 302 (3.2%) |
| 65 to 69 Years | 410 (4.4%) | 524 (5.6%) |
| 70 to 74 Years | 254 (2.7%) | 352 (3.7%) |
| 75 to 79 Years | 198 (2.1%) | 333 (3.5%) |
| 80 to 84 Years | 90 (1.0%) | 154 (1.6%) |
| 85 Years and over | 205 (2.2%) | 390 (4.1%) |
| Total | 9,306 (100.0%) | 9,448 (100.0%) |
Families and Households in Rutherford borough
Median Family Size in Rutherford borough
The median family size in Rutherford borough is 3.20 persons per family, with married-couple families (3,670 | 76.7%) accounting for the largest median family size of 3.46 persons per family. On the other hand, single female/mother families (840 | 17.5%) represent the smallest median family size with 2.30 persons per family.
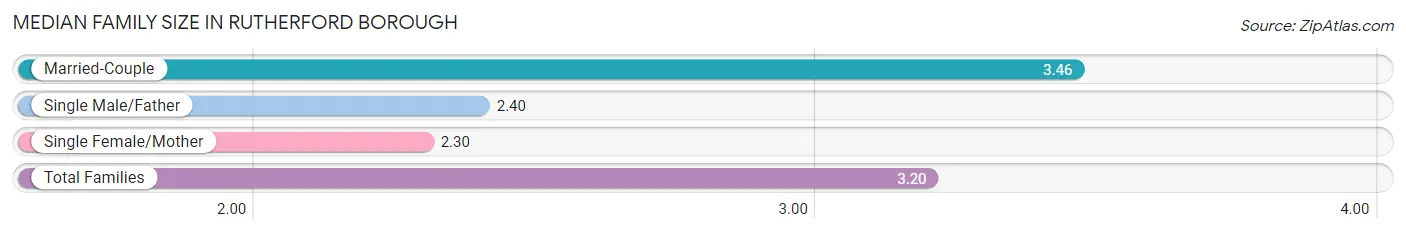
| Family Type | # Families | Family Size |
| Married-Couple | 3,670 (76.7%) | 3.46 |
| Single Male/Father | 276 (5.8%) | 2.40 |
| Single Female/Mother | 840 (17.5%) | 2.30 |
| Total Families | 4,786 (100.0%) | 3.20 |
Median Household Size in Rutherford borough
The median household size in Rutherford borough is 2.72 persons per household, with married-couple households (3,670 | 54.3%) accounting for the largest median household size of 3.51 persons per household. non-family households (1,969 | 29.1%) represent the smallest median household size with 1.28 persons per household.
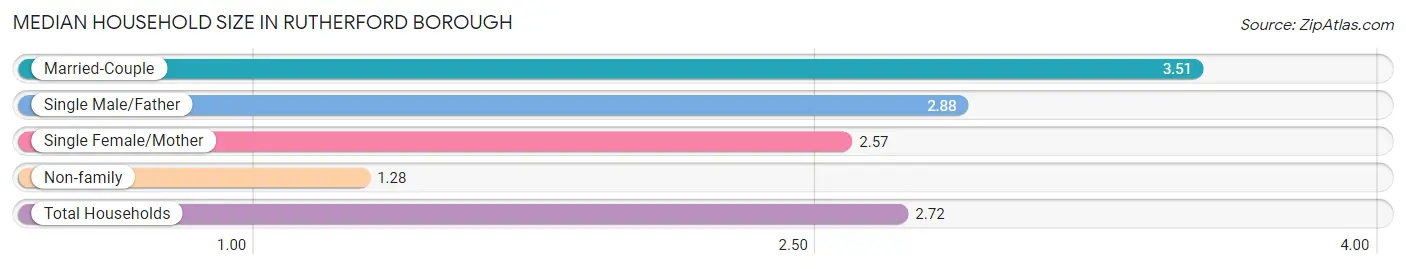
| Household Type | # Households | Household Size |
| Married-Couple | 3,670 (54.3%) | 3.51 |
| Single Male/Father | 276 (4.1%) | 2.88 |
| Single Female/Mother | 840 (12.4%) | 2.57 |
| Non-family | 1,969 (29.1%) | 1.28 |
| Total Households | 6,755 (100.0%) | 2.72 |
Household Size by Marriage Status in Rutherford borough
Out of a total of 6,755 households in Rutherford borough, 4,786 (70.9%) are family households, while 1,969 (29.1%) are nonfamily households. The most numerous type of family households are 2-person households, comprising 1,582, and the most common type of nonfamily households are 1-person households, comprising 1,571.
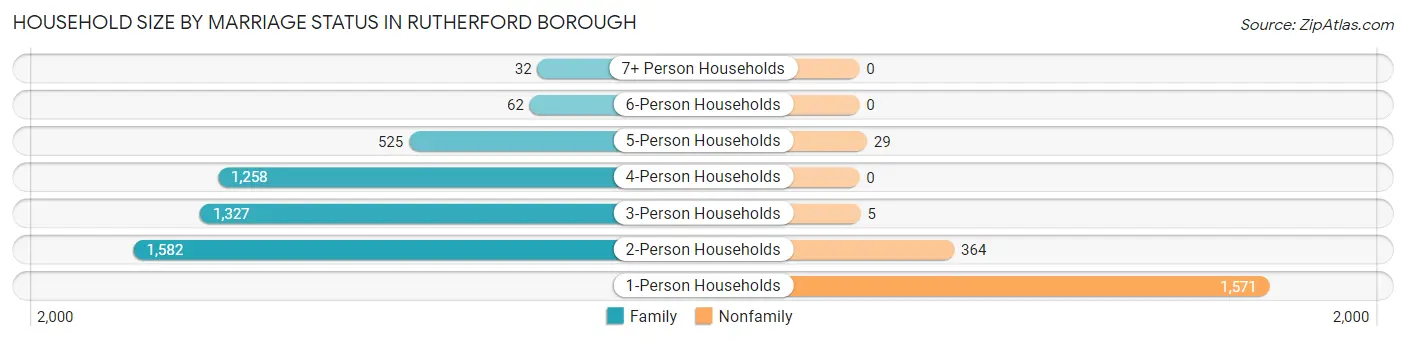
| Household Size | Family Households | Nonfamily Households |
| 1-Person Households | - | 1,571 (23.3%) |
| 2-Person Households | 1,582 (23.4%) | 364 (5.4%) |
| 3-Person Households | 1,327 (19.6%) | 5 (0.1%) |
| 4-Person Households | 1,258 (18.6%) | 0 (0.0%) |
| 5-Person Households | 525 (7.8%) | 29 (0.4%) |
| 6-Person Households | 62 (0.9%) | 0 (0.0%) |
| 7+ Person Households | 32 (0.5%) | 0 (0.0%) |
| Total | 4,786 (70.9%) | 1,969 (29.1%) |
Female Fertility in Rutherford borough
Fertility by Age in Rutherford borough
Average fertility rate in Rutherford borough is 39.0 births per 1,000 women. Women in the age bracket of 35 to 50 years have the highest fertility rate with 54.0 births per 1,000 women. Women in the age bracket of 35 to 50 years acount for 69.0% of all women with births.
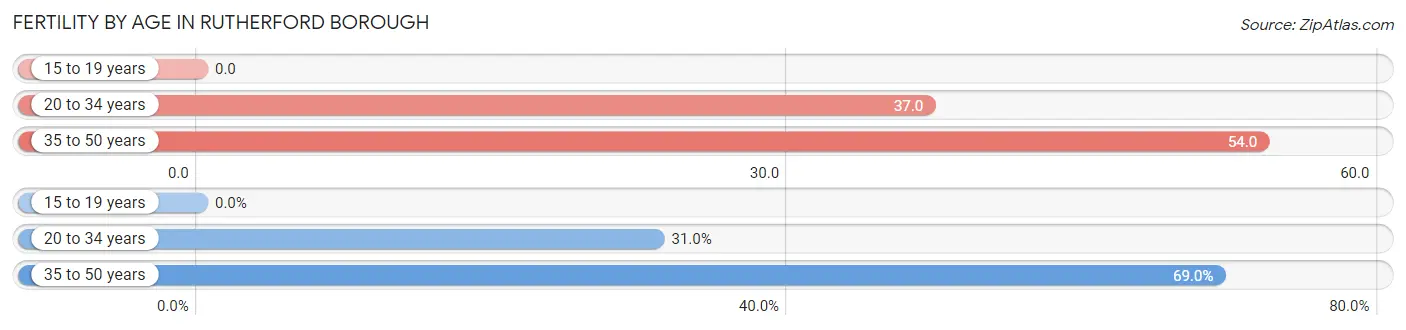
| Age Bracket | Women with Births | Births / 1,000 Women |
| 15 to 19 years | 0 (0.0%) | 0.0 |
| 20 to 34 years | 57 (31.0%) | 37.0 |
| 35 to 50 years | 127 (69.0%) | 54.0 |
| Total | 184 (100.0%) | 39.0 |
Fertility by Age by Marriage Status in Rutherford borough
73.9% of women with births (184) in Rutherford borough are married. The highest percentage of unmarried women with births falls into 20 to 34 years age bracket with 29.8% of them unmarried at the time of birth, while the lowest percentage of unmarried women with births belong to 35 to 50 years age bracket with 24.4% of them unmarried.
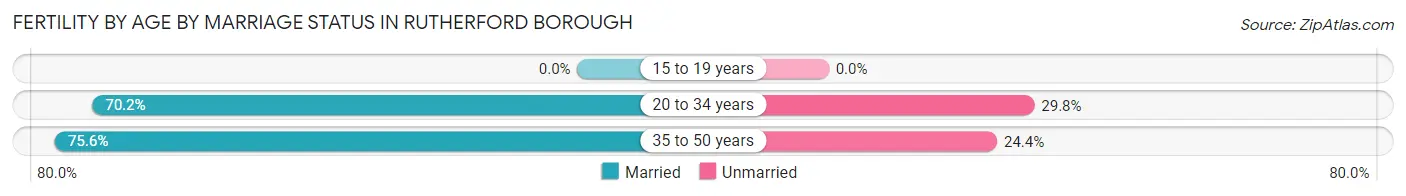
| Age Bracket | Married | Unmarried |
| 15 to 19 years | 0 (0.0%) | 0 (0.0%) |
| 20 to 34 years | 40 (70.2%) | 17 (29.8%) |
| 35 to 50 years | 96 (75.6%) | 31 (24.4%) |
| Total | 136 (73.9%) | 48 (26.1%) |
Fertility by Education in Rutherford borough
Average fertility rate in Rutherford borough is 39.0 births per 1,000 women. Women with the education attainment of graduate degree have the highest fertility rate of 78.0 births per 1,000 women, while women with the education attainment of college or associate's degree have the lowest fertility at 12.0 births per 1,000 women. Women with the education attainment of bachelor's degree represent 36.4% of all women with births.
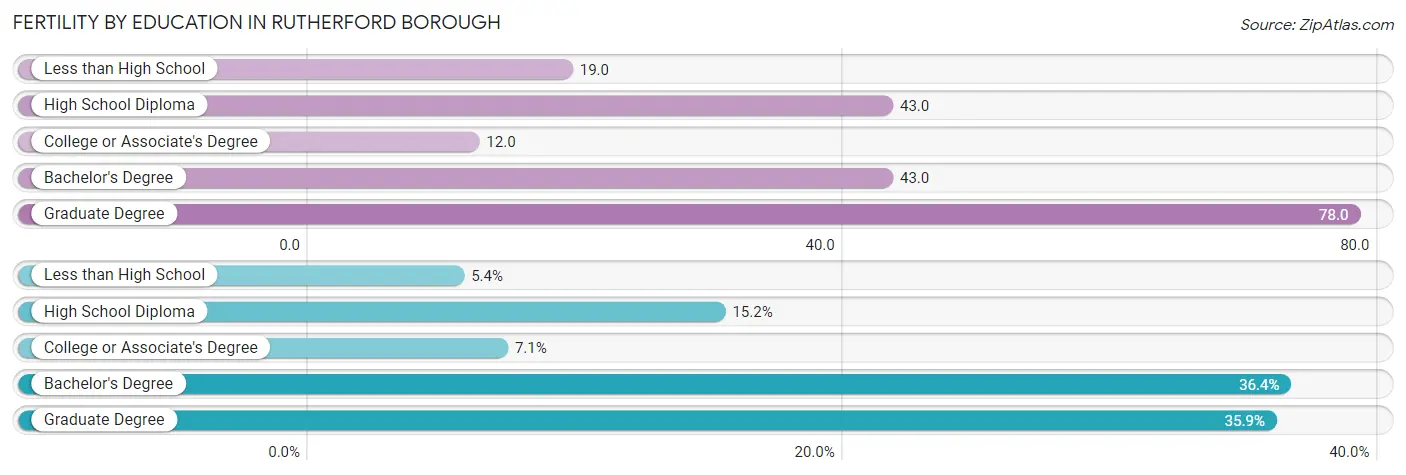
| Educational Attainment | Women with Births | Births / 1,000 Women |
| Less than High School | 10 (5.4%) | 19.0 |
| High School Diploma | 28 (15.2%) | 43.0 |
| College or Associate's Degree | 13 (7.1%) | 12.0 |
| Bachelor's Degree | 67 (36.4%) | 43.0 |
| Graduate Degree | 66 (35.9%) | 78.0 |
| Total | 184 (100.0%) | 39.0 |
Fertility by Education by Marriage Status in Rutherford borough
26.1% of women with births in Rutherford borough are unmarried. Women with the educational attainment of high school diploma are most likely to be married with 100.0% of them married at childbirth, while women with the educational attainment of less than high school are least likely to be married with 100.0% of them unmarried at childbirth.
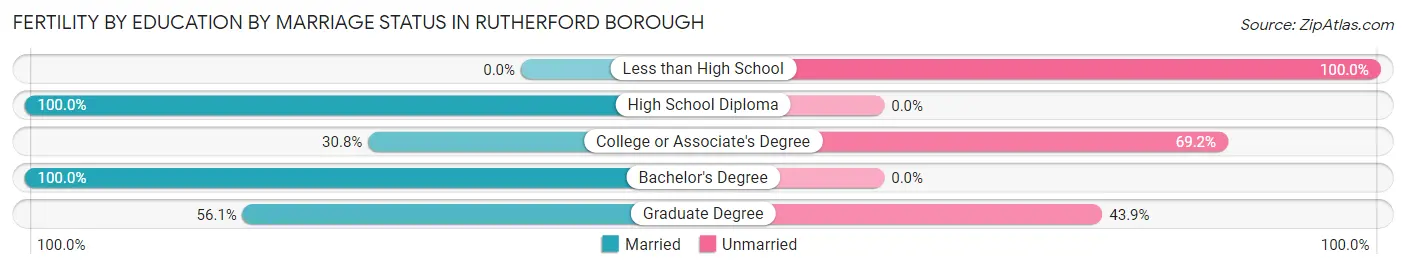
| Educational Attainment | Married | Unmarried |
| Less than High School | 0 (0.0%) | 10 (100.0%) |
| High School Diploma | 28 (100.0%) | 0 (0.0%) |
| College or Associate's Degree | 4 (30.8%) | 9 (69.2%) |
| Bachelor's Degree | 67 (100.0%) | 0 (0.0%) |
| Graduate Degree | 37 (56.1%) | 29 (43.9%) |
| Total | 136 (73.9%) | 48 (26.1%) |
Employment Characteristics in Rutherford borough
Employment by Class of Employer in Rutherford borough
Among the 10,046 employed individuals in Rutherford borough, private company employees (6,982 | 69.5%), local government employees (904 | 9.0%), and not-for-profit organizations (776 | 7.7%) make up the most common classes of employment.
| Employer Class | # Employees | % Employees |
| Private Company Employees | 6,982 | 69.5% |
| Self-Employed (Incorporated) | 542 | 5.4% |
| Self-Employed (Not Incorporated) | 353 | 3.5% |
| Not-for-profit Organizations | 776 | 7.7% |
| Local Government Employees | 904 | 9.0% |
| State Government Employees | 284 | 2.8% |
| Federal Government Employees | 193 | 1.9% |
| Unpaid Family Workers | 12 | 0.1% |
| Total | 10,046 | 100.0% |
Employment Status by Age in Rutherford borough
According to the labor force statistics for Rutherford borough, out of the total population over 16 years of age (15,759), 67.1% or 10,574 individuals are in the labor force, with 3.3% or 349 of them unemployed. The age group with the highest labor force participation rate is 35 to 44 years, with 92.0% or 2,447 individuals in the labor force. Within the labor force, the 16 to 19 years age range has the highest percentage of unemployed individuals, with 9.6% or 34 of them being unemployed.
| Age Bracket | In Labor Force | Unemployed |
| 16 to 19 Years | 352 (23.8%) | 34 (9.6%) |
| 20 to 24 Years | 782 (61.5%) | 33 (4.2%) |
| 25 to 29 Years | 1,258 (89.6%) | 9 (0.7%) |
| 30 to 34 Years | 660 (87.0%) | 51 (7.7%) |
| 35 to 44 Years | 2,447 (92.0%) | 88 (3.6%) |
| 45 to 54 Years | 2,750 (88.4%) | 25 (0.9%) |
| 55 to 59 Years | 1,196 (82.5%) | 28 (2.3%) |
| 60 to 64 Years | 522 (73.3%) | 50 (9.6%) |
| 65 to 74 Years | 553 (35.9%) | 35 (6.3%) |
| 75 Years and over | 56 (4.1%) | 0 (0.0%) |
| Total | 10,574 (67.1%) | 349 (3.3%) |
Employment Status by Educational Attainment in Rutherford borough
According to labor force statistics for Rutherford borough, 87.5% of individuals (8,834) out of the total population between 25 and 64 years of age (10,096) are in the labor force, with 2.8% or 247 of them being unemployed. The group with the highest labor force participation rate are those with the educational attainment of bachelor's degree or higher, with 91.6% or 5,663 individuals in the labor force. Within the labor force, individuals with less than high school education have the highest percentage of unemployment, with 12.6% or 24 of them being unemployed.
| Educational Attainment | In Labor Force | Unemployed |
| Less than High School | 191 (83.8%) | 29 (12.6%) |
| High School Diploma | 1,161 (75.9%) | 34 (2.2%) |
| College / Associate Degree | 1,814 (84.1%) | 63 (2.9%) |
| Bachelor's Degree or higher | 5,663 (91.6%) | 161 (2.6%) |
| Total | 8,834 (87.5%) | 283 (2.8%) |
Employment Occupations by Sex in Rutherford borough
Management, Business, Science and Arts Occupations
The most common Management, Business, Science and Arts occupations in Rutherford borough are Management (1,699 | 16.6%), Community & Social Service (1,522 | 14.9%), Business & Financial (1,408 | 13.8%), Computers, Engineering & Science (706 | 6.9%), and Education Instruction & Library (700 | 6.9%).
Management, Business, Science and Arts Occupations by Sex
Within the Management, Business, Science and Arts occupations in Rutherford borough, the most male-oriented occupations are Architecture & Engineering (100.0%), Computers, Engineering & Science (86.1%), and Computers & Mathematics (79.9%), while the most female-oriented occupations are Health Diagnosing & Treating (74.3%), Education Instruction & Library (74.3%), and Health Technologists (68.6%).
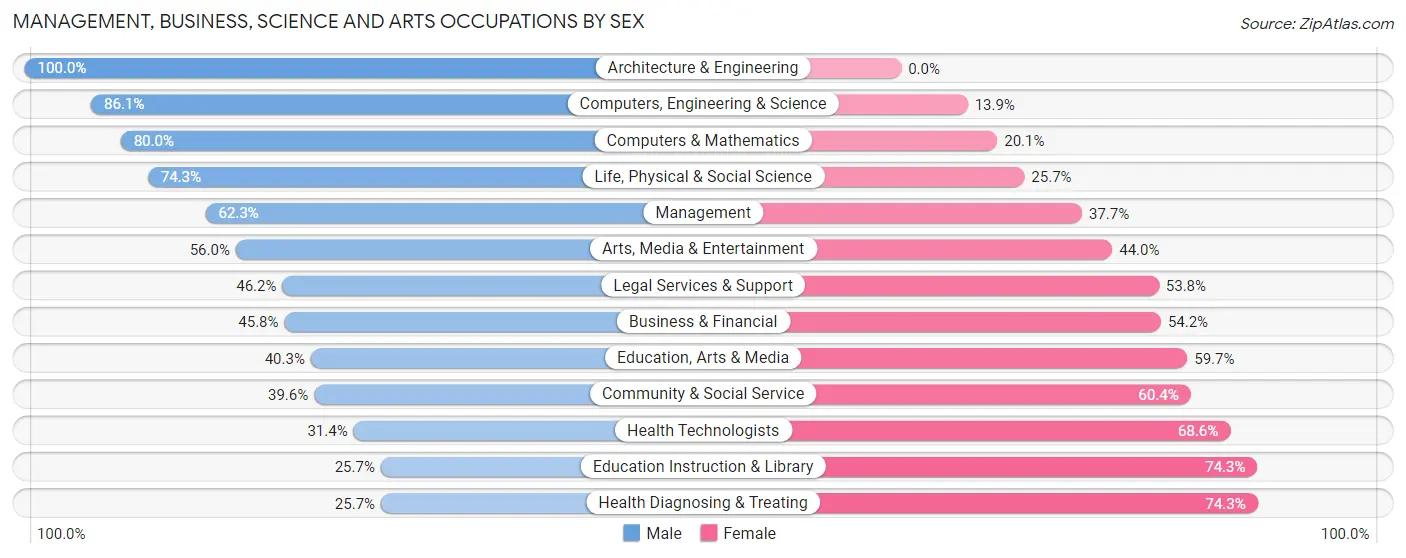
| Occupation | Male | Female |
| Management | 1,058 (62.3%) | 641 (37.7%) |
| Business & Financial | 645 (45.8%) | 763 (54.2%) |
| Computers, Engineering & Science | 608 (86.1%) | 98 (13.9%) |
| Computers & Mathematics | 319 (79.9%) | 80 (20.1%) |
| Architecture & Engineering | 237 (100.0%) | 0 (0.0%) |
| Life, Physical & Social Science | 52 (74.3%) | 18 (25.7%) |
| Community & Social Service | 603 (39.6%) | 919 (60.4%) |
| Education, Arts & Media | 52 (40.3%) | 77 (59.7%) |
| Legal Services & Support | 80 (46.2%) | 93 (53.8%) |
| Education Instruction & Library | 180 (25.7%) | 520 (74.3%) |
| Arts, Media & Entertainment | 291 (56.0%) | 229 (44.0%) |
| Health Diagnosing & Treating | 144 (25.7%) | 417 (74.3%) |
| Health Technologists | 129 (31.4%) | 282 (68.6%) |
| Total (Category) | 3,058 (51.9%) | 2,838 (48.1%) |
| Total (Overall) | 5,447 (53.3%) | 4,777 (46.7%) |
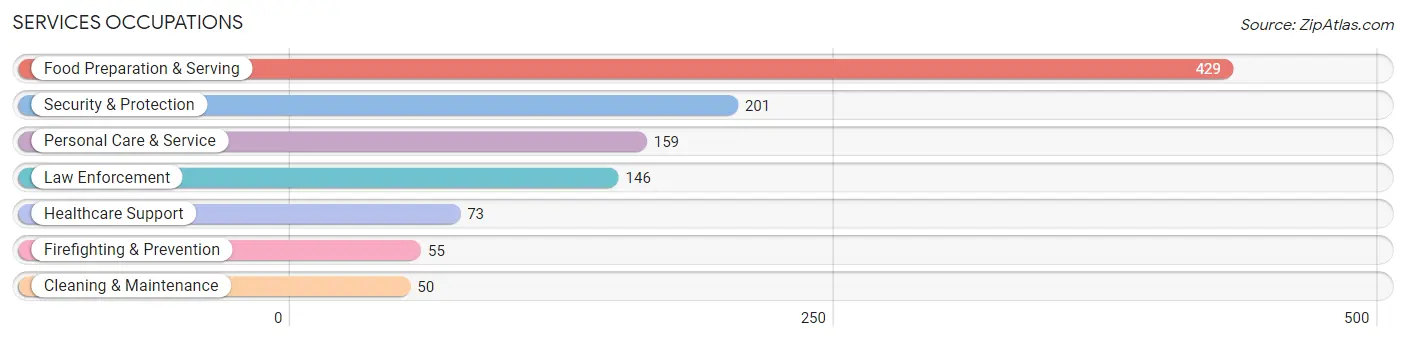
Services Occupations
The most common Services occupations in Rutherford borough are Food Preparation & Serving (429 | 4.2%), Security & Protection (201 | 2.0%), Personal Care & Service (159 | 1.6%), Law Enforcement (146 | 1.4%), and Healthcare Support (73 | 0.7%).
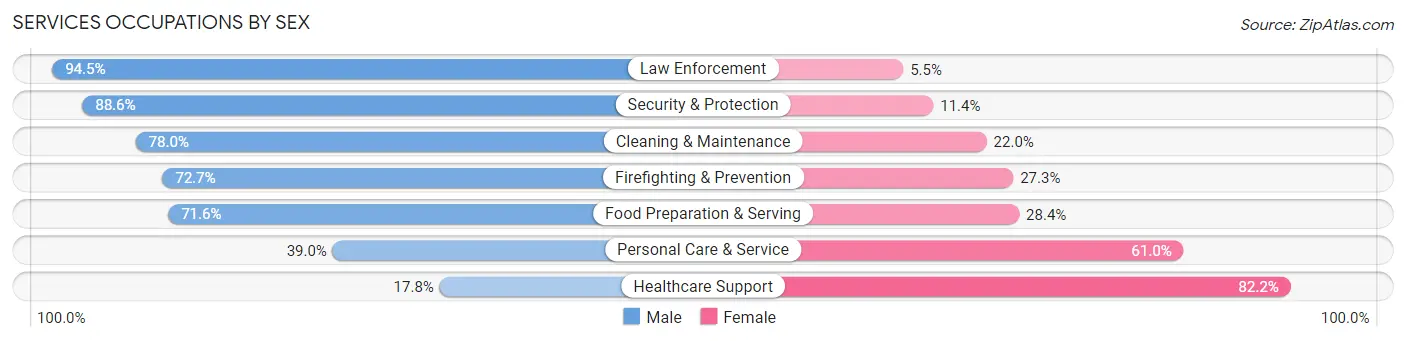
Services Occupations by Sex
Within the Services occupations in Rutherford borough, the most male-oriented occupations are Law Enforcement (94.5%), Security & Protection (88.6%), and Cleaning & Maintenance (78.0%), while the most female-oriented occupations are Healthcare Support (82.2%), Personal Care & Service (61.0%), and Food Preparation & Serving (28.4%).
| Occupation | Male | Female |
| Healthcare Support | 13 (17.8%) | 60 (82.2%) |
| Security & Protection | 178 (88.6%) | 23 (11.4%) |
| Firefighting & Prevention | 40 (72.7%) | 15 (27.3%) |
| Law Enforcement | 138 (94.5%) | 8 (5.5%) |
| Food Preparation & Serving | 307 (71.6%) | 122 (28.4%) |
| Cleaning & Maintenance | 39 (78.0%) | 11 (22.0%) |
| Personal Care & Service | 62 (39.0%) | 97 (61.0%) |
| Total (Category) | 599 (65.7%) | 313 (34.3%) |
| Total (Overall) | 5,447 (53.3%) | 4,777 (46.7%) |
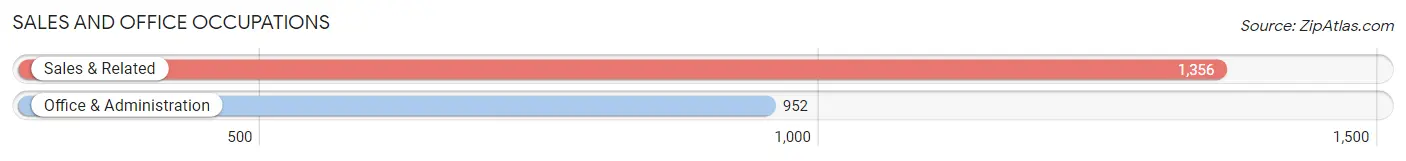
Sales and Office Occupations
The most common Sales and Office occupations in Rutherford borough are Sales & Related (1,356 | 13.3%), and Office & Administration (952 | 9.3%).
Sales and Office Occupations by Sex
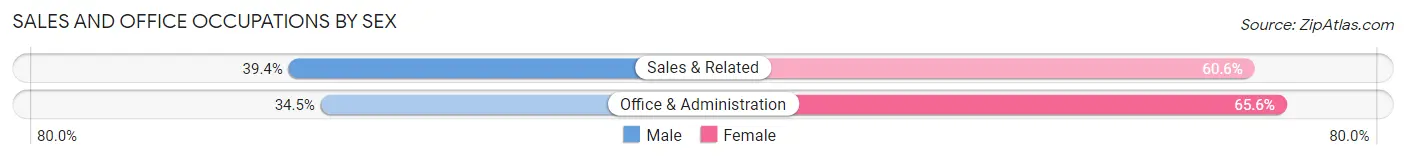
| Occupation | Male | Female |
| Sales & Related | 534 (39.4%) | 822 (60.6%) |
| Office & Administration | 328 (34.4%) | 624 (65.5%) |
| Total (Category) | 862 (37.3%) | 1,446 (62.6%) |
| Total (Overall) | 5,447 (53.3%) | 4,777 (46.7%) |
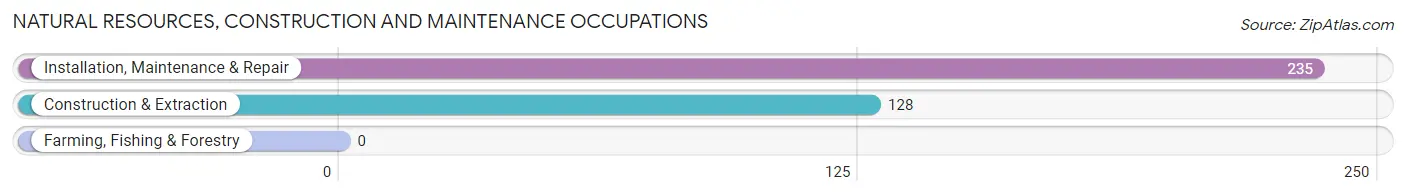
Natural Resources, Construction and Maintenance Occupations
The most common Natural Resources, Construction and Maintenance occupations in Rutherford borough are Installation, Maintenance & Repair (235 | 2.3%), and Construction & Extraction (128 | 1.3%).
Natural Resources, Construction and Maintenance Occupations by Sex
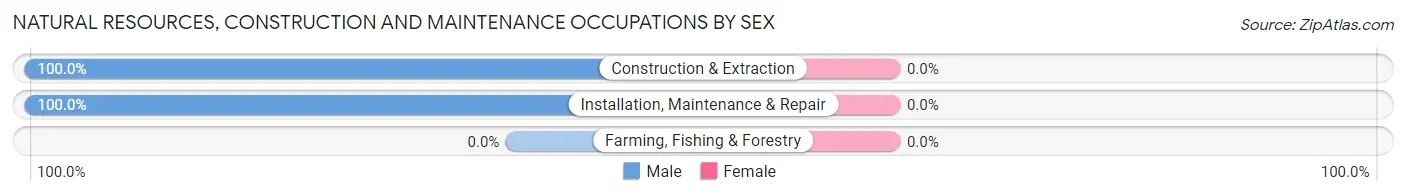
| Occupation | Male | Female |
| Farming, Fishing & Forestry | 0 (0.0%) | 0 (0.0%) |
| Construction & Extraction | 128 (100.0%) | 0 (0.0%) |
| Installation, Maintenance & Repair | 235 (100.0%) | 0 (0.0%) |
| Total (Category) | 363 (100.0%) | 0 (0.0%) |
| Total (Overall) | 5,447 (53.3%) | 4,777 (46.7%) |
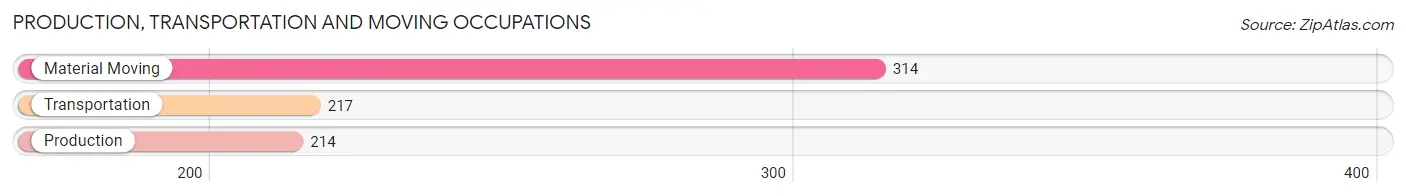
Production, Transportation and Moving Occupations
The most common Production, Transportation and Moving occupations in Rutherford borough are Material Moving (314 | 3.1%), Transportation (217 | 2.1%), and Production (214 | 2.1%).
Production, Transportation and Moving Occupations by Sex
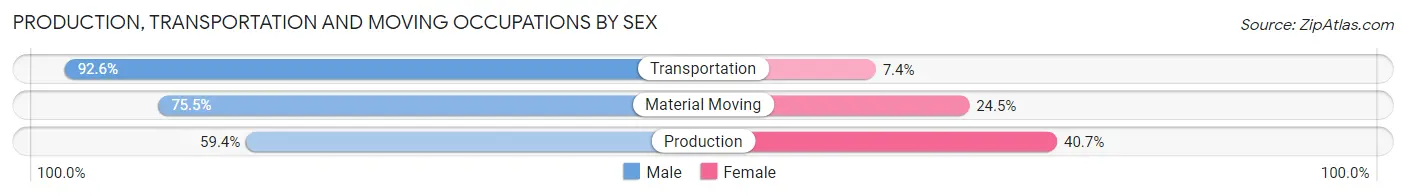
| Occupation | Male | Female |
| Production | 127 (59.4%) | 87 (40.6%) |
| Transportation | 201 (92.6%) | 16 (7.4%) |
| Material Moving | 237 (75.5%) | 77 (24.5%) |
| Total (Category) | 565 (75.8%) | 180 (24.2%) |
| Total (Overall) | 5,447 (53.3%) | 4,777 (46.7%) |
Employment Industries by Sex in Rutherford borough
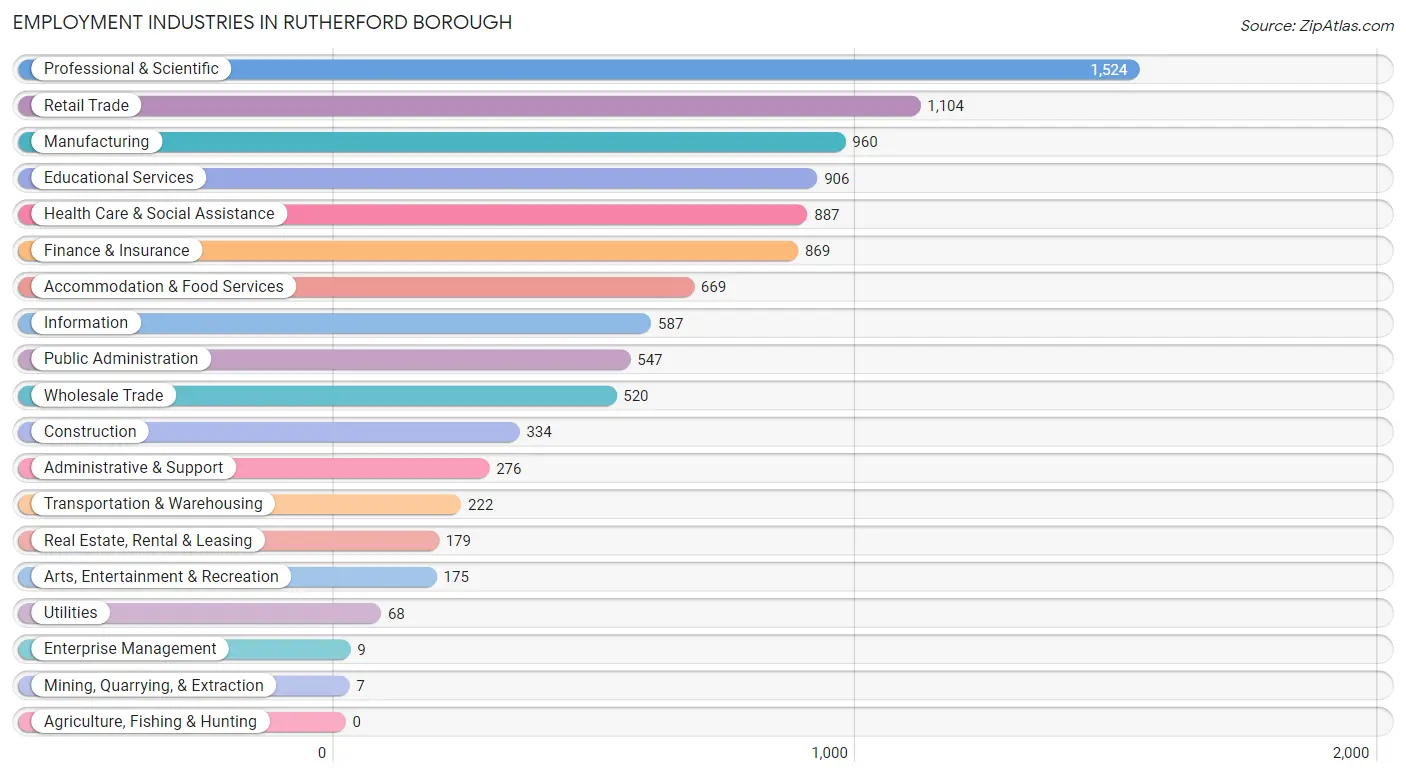
Employment Industries in Rutherford borough
The major employment industries in Rutherford borough include Professional & Scientific (1,524 | 14.9%), Retail Trade (1,104 | 10.8%), Manufacturing (960 | 9.4%), Educational Services (906 | 8.9%), and Health Care & Social Assistance (887 | 8.7%).
Employment Industries by Sex in Rutherford borough
The Rutherford borough industries that see more men than women are Mining, Quarrying, & Extraction (100.0%), Utilities (97.1%), and Construction (92.5%), whereas the industries that tend to have a higher number of women are Enterprise Management (100.0%), Educational Services (70.8%), and Health Care & Social Assistance (68.0%).
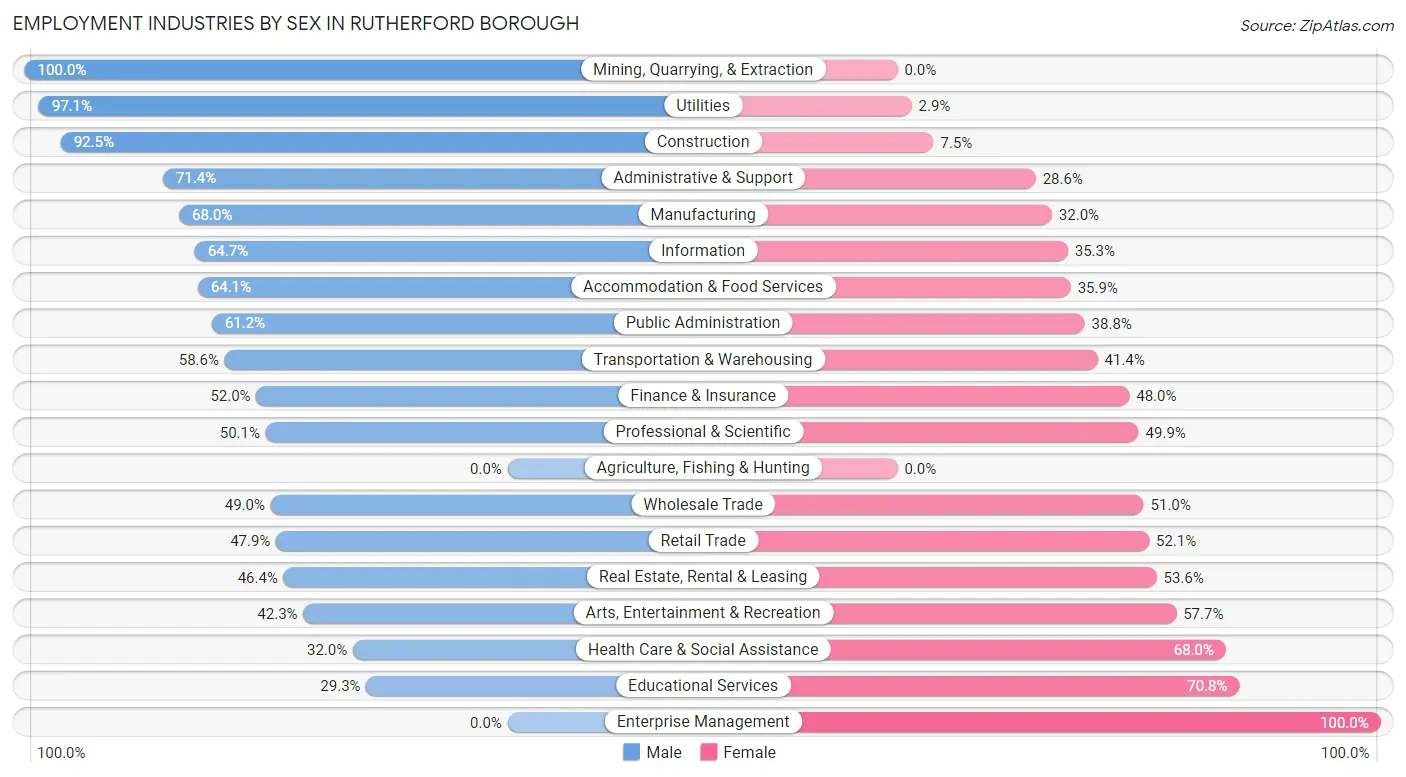
| Industry | Male | Female |
| Agriculture, Fishing & Hunting | 0 (0.0%) | 0 (0.0%) |
| Mining, Quarrying, & Extraction | 7 (100.0%) | 0 (0.0%) |
| Construction | 309 (92.5%) | 25 (7.5%) |
| Manufacturing | 653 (68.0%) | 307 (32.0%) |
| Wholesale Trade | 255 (49.0%) | 265 (51.0%) |
| Retail Trade | 529 (47.9%) | 575 (52.1%) |
| Transportation & Warehousing | 130 (58.6%) | 92 (41.4%) |
| Utilities | 66 (97.1%) | 2 (2.9%) |
| Information | 380 (64.7%) | 207 (35.3%) |
| Finance & Insurance | 452 (52.0%) | 417 (48.0%) |
| Real Estate, Rental & Leasing | 83 (46.4%) | 96 (53.6%) |
| Professional & Scientific | 763 (50.1%) | 761 (49.9%) |
| Enterprise Management | 0 (0.0%) | 9 (100.0%) |
| Administrative & Support | 197 (71.4%) | 79 (28.6%) |
| Educational Services | 265 (29.2%) | 641 (70.8%) |
| Health Care & Social Assistance | 284 (32.0%) | 603 (68.0%) |
| Arts, Entertainment & Recreation | 74 (42.3%) | 101 (57.7%) |
| Accommodation & Food Services | 429 (64.1%) | 240 (35.9%) |
| Public Administration | 335 (61.2%) | 212 (38.8%) |
| Total | 5,447 (53.3%) | 4,777 (46.7%) |
Education in Rutherford borough
School Enrollment in Rutherford borough
The most common levels of schooling among the 5,175 students in Rutherford borough are college / undergraduate (1,601 | 30.9%), high school (1,164 | 22.5%), and middle school (882 | 17.0%).
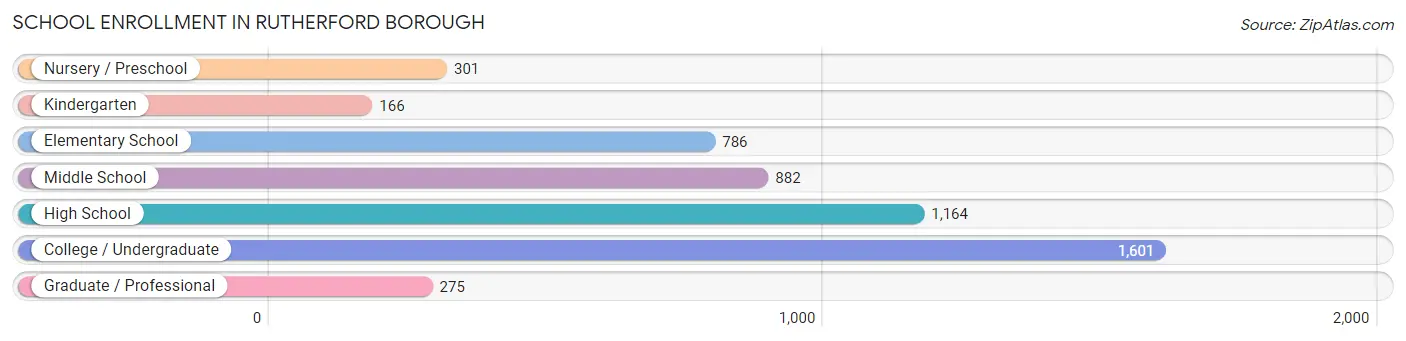
| School Level | # Students | % Students |
| Nursery / Preschool | 301 | 5.8% |
| Kindergarten | 166 | 3.2% |
| Elementary School | 786 | 15.2% |
| Middle School | 882 | 17.0% |
| High School | 1,164 | 22.5% |
| College / Undergraduate | 1,601 | 30.9% |
| Graduate / Professional | 275 | 5.3% |
| Total | 5,175 | 100.0% |
School Enrollment by Age by Funding Source in Rutherford borough
Out of a total of 5,175 students who are enrolled in schools in Rutherford borough, 1,045 (20.2%) attend a private institution, while the remaining 4,130 (79.8%) are enrolled in public schools. The age group of 25 to 34 year olds has the highest likelihood of being enrolled in private schools, with 138 (60.3% in the age bracket) enrolled. Conversely, the age group of 10 to 14 year olds has the lowest likelihood of being enrolled in a private school, with 1,118 (97.3% in the age bracket) attending a public institution.
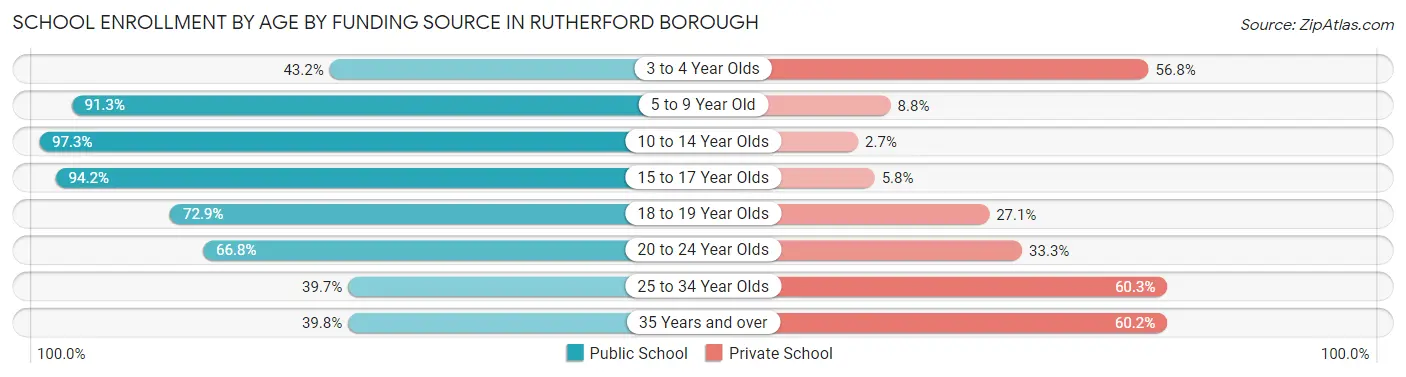
| Age Bracket | Public School | Private School |
| 3 to 4 Year Olds | 121 (43.2%) | 159 (56.8%) |
| 5 to 9 Year Old | 761 (91.2%) | 73 (8.7%) |
| 10 to 14 Year Olds | 1,118 (97.3%) | 31 (2.7%) |
| 15 to 17 Year Olds | 846 (94.2%) | 52 (5.8%) |
| 18 to 19 Year Olds | 605 (72.9%) | 225 (27.1%) |
| 20 to 24 Year Olds | 520 (66.7%) | 259 (33.3%) |
| 25 to 34 Year Olds | 91 (39.7%) | 138 (60.3%) |
| 35 Years and over | 70 (39.8%) | 106 (60.2%) |
| Total | 4,130 (79.8%) | 1,045 (20.2%) |
Educational Attainment by Field of Study in Rutherford borough
Business (1,806 | 22.3%), engineering (719 | 8.9%), science & technology (630 | 7.8%), communications (622 | 7.7%), and visual & performing arts (617 | 7.6%) are the most common fields of study among 8,108 individuals in Rutherford borough who have obtained a bachelor's degree or higher.
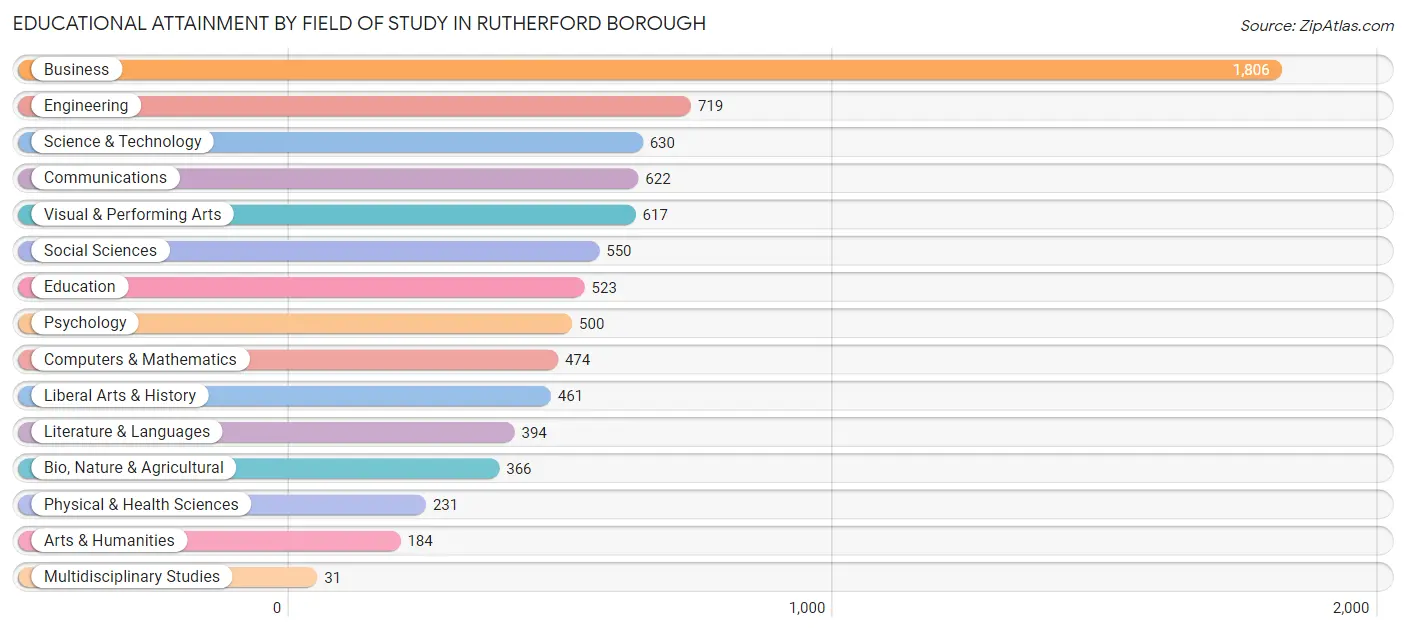
| Field of Study | # Graduates | % Graduates |
| Computers & Mathematics | 474 | 5.9% |
| Bio, Nature & Agricultural | 366 | 4.5% |
| Physical & Health Sciences | 231 | 2.9% |
| Psychology | 500 | 6.2% |
| Social Sciences | 550 | 6.8% |
| Engineering | 719 | 8.9% |
| Multidisciplinary Studies | 31 | 0.4% |
| Science & Technology | 630 | 7.8% |
| Business | 1,806 | 22.3% |
| Education | 523 | 6.5% |
| Literature & Languages | 394 | 4.9% |
| Liberal Arts & History | 461 | 5.7% |
| Visual & Performing Arts | 617 | 7.6% |
| Communications | 622 | 7.7% |
| Arts & Humanities | 184 | 2.3% |
| Total | 8,108 | 100.0% |
Transportation & Commute in Rutherford borough
Vehicle Availability by Sex in Rutherford borough
The most prevalent vehicle ownership categories in Rutherford borough are males with 2 vehicles (2,221, accounting for 41.6%) and females with 2 vehicles (1,751, making up 48.7%).
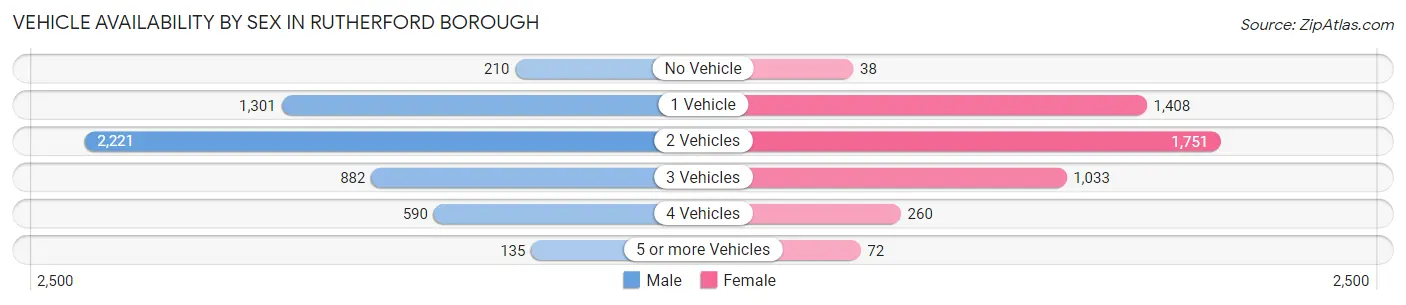
| Vehicles Available | Male | Female |
| No Vehicle | 210 (3.9%) | 38 (0.8%) |
| 1 Vehicle | 1,301 (24.4%) | 1,408 (30.9%) |
| 2 Vehicles | 2,221 (41.6%) | 1,751 (38.4%) |
| 3 Vehicles | 882 (16.5%) | 1,033 (22.6%) |
| 4 Vehicles | 590 (11.1%) | 260 (5.7%) |
| 5 or more Vehicles | 135 (2.5%) | 72 (1.6%) |
| Total | 5,339 (100.0%) | 4,562 (100.0%) |
Commute Time in Rutherford borough
The most frequently occuring commute durations in Rutherford borough are 60 to 89 minutes (1,593 commuters, 19.0%), 15 to 19 minutes (1,161 commuters, 13.9%), and 10 to 14 minutes (1,019 commuters, 12.1%).
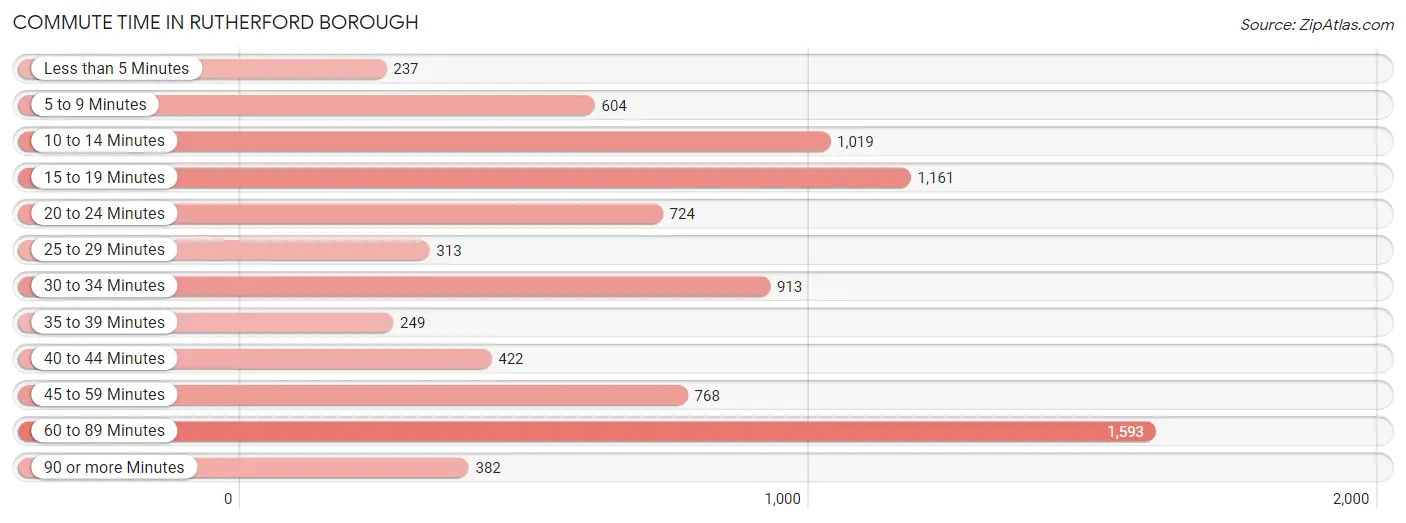
| Commute Time | # Commuters | % Commuters |
| Less than 5 Minutes | 237 | 2.8% |
| 5 to 9 Minutes | 604 | 7.2% |
| 10 to 14 Minutes | 1,019 | 12.1% |
| 15 to 19 Minutes | 1,161 | 13.9% |
| 20 to 24 Minutes | 724 | 8.6% |
| 25 to 29 Minutes | 313 | 3.7% |
| 30 to 34 Minutes | 913 | 10.9% |
| 35 to 39 Minutes | 249 | 3.0% |
| 40 to 44 Minutes | 422 | 5.0% |
| 45 to 59 Minutes | 768 | 9.2% |
| 60 to 89 Minutes | 1,593 | 19.0% |
| 90 or more Minutes | 382 | 4.6% |
Commute Time by Sex in Rutherford borough
The most common commute times in Rutherford borough are 60 to 89 minutes (847 commuters, 18.4%) for males and 60 to 89 minutes (746 commuters, 19.7%) for females.
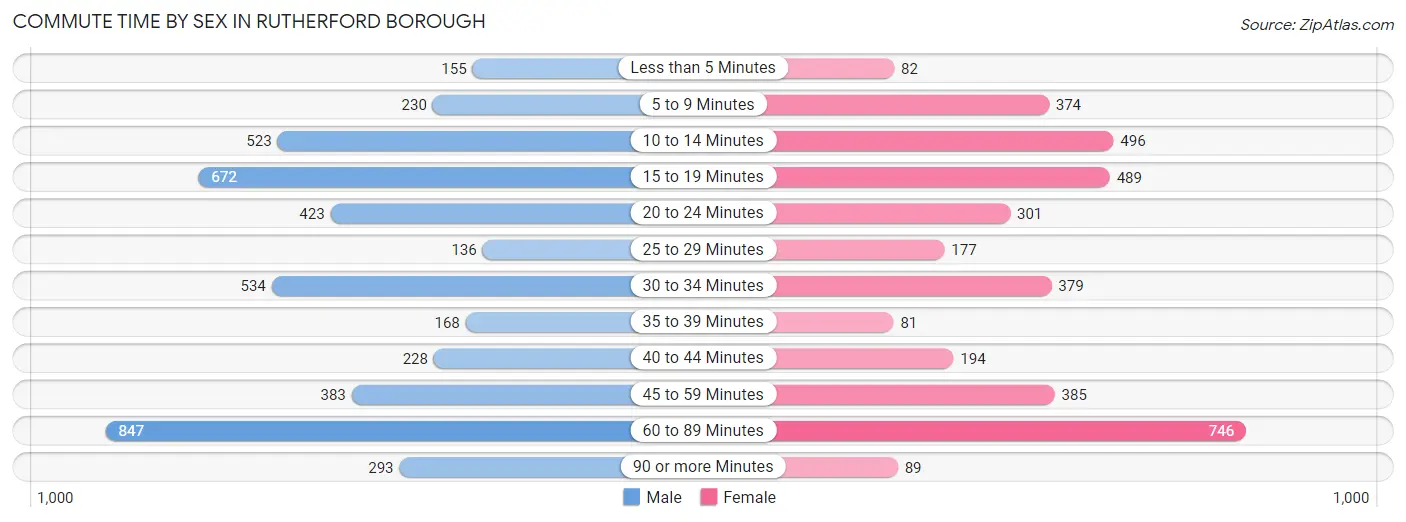
| Commute Time | Male | Female |
| Less than 5 Minutes | 155 (3.4%) | 82 (2.2%) |
| 5 to 9 Minutes | 230 (5.0%) | 374 (9.9%) |
| 10 to 14 Minutes | 523 (11.4%) | 496 (13.1%) |
| 15 to 19 Minutes | 672 (14.6%) | 489 (12.9%) |
| 20 to 24 Minutes | 423 (9.2%) | 301 (7.9%) |
| 25 to 29 Minutes | 136 (3.0%) | 177 (4.7%) |
| 30 to 34 Minutes | 534 (11.6%) | 379 (10.0%) |
| 35 to 39 Minutes | 168 (3.7%) | 81 (2.1%) |
| 40 to 44 Minutes | 228 (5.0%) | 194 (5.1%) |
| 45 to 59 Minutes | 383 (8.3%) | 385 (10.2%) |
| 60 to 89 Minutes | 847 (18.4%) | 746 (19.7%) |
| 90 or more Minutes | 293 (6.4%) | 89 (2.4%) |
Time of Departure to Work by Sex in Rutherford borough
The most frequent times of departure to work in Rutherford borough are 8:00 AM to 8:29 AM (789, 17.2%) for males and 8:00 AM to 8:29 AM (935, 24.6%) for females.
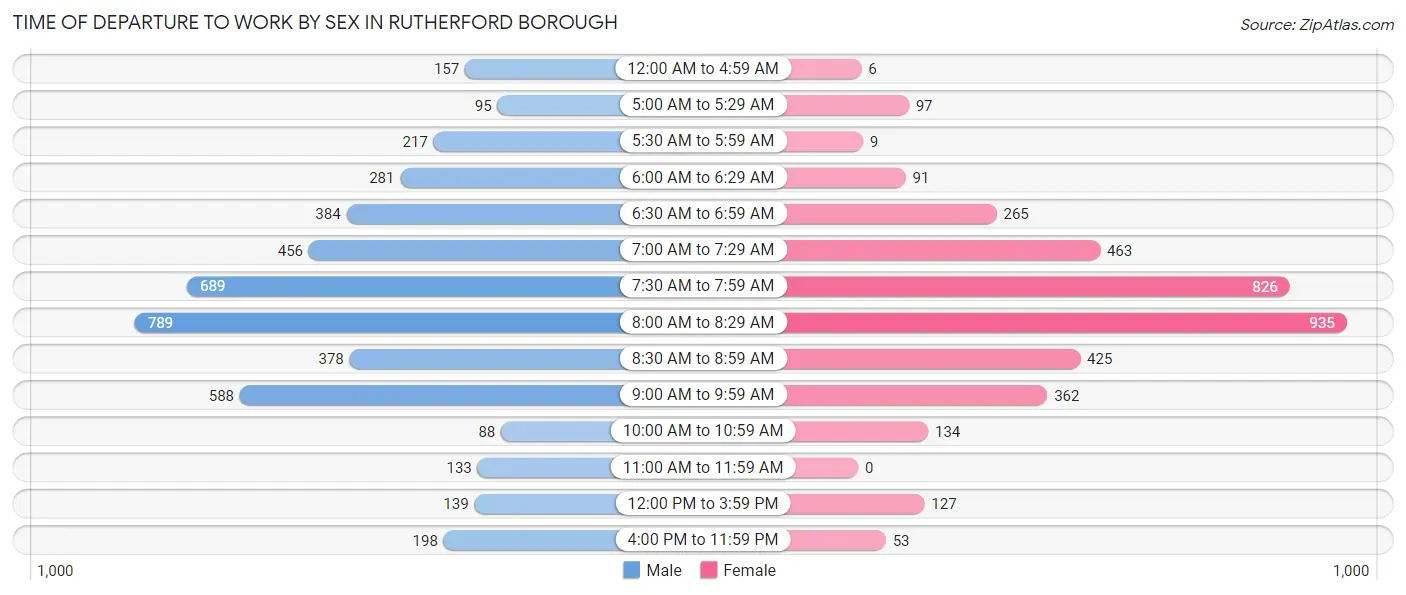
| Time of Departure | Male | Female |
| 12:00 AM to 4:59 AM | 157 (3.4%) | 6 (0.2%) |
| 5:00 AM to 5:29 AM | 95 (2.1%) | 97 (2.6%) |
| 5:30 AM to 5:59 AM | 217 (4.7%) | 9 (0.2%) |
| 6:00 AM to 6:29 AM | 281 (6.1%) | 91 (2.4%) |
| 6:30 AM to 6:59 AM | 384 (8.4%) | 265 (7.0%) |
| 7:00 AM to 7:29 AM | 456 (9.9%) | 463 (12.2%) |
| 7:30 AM to 7:59 AM | 689 (15.0%) | 826 (21.8%) |
| 8:00 AM to 8:29 AM | 789 (17.2%) | 935 (24.6%) |
| 8:30 AM to 8:59 AM | 378 (8.2%) | 425 (11.2%) |
| 9:00 AM to 9:59 AM | 588 (12.8%) | 362 (9.5%) |
| 10:00 AM to 10:59 AM | 88 (1.9%) | 134 (3.5%) |
| 11:00 AM to 11:59 AM | 133 (2.9%) | 0 (0.0%) |
| 12:00 PM to 3:59 PM | 139 (3.0%) | 127 (3.4%) |
| 4:00 PM to 11:59 PM | 198 (4.3%) | 53 (1.4%) |
| Total | 4,592 (100.0%) | 3,793 (100.0%) |
Housing Occupancy in Rutherford borough
Occupancy by Ownership in Rutherford borough
Of the total 6,755 dwellings in Rutherford borough, owner-occupied units account for 4,211 (62.3%), while renter-occupied units make up 2,544 (37.7%).
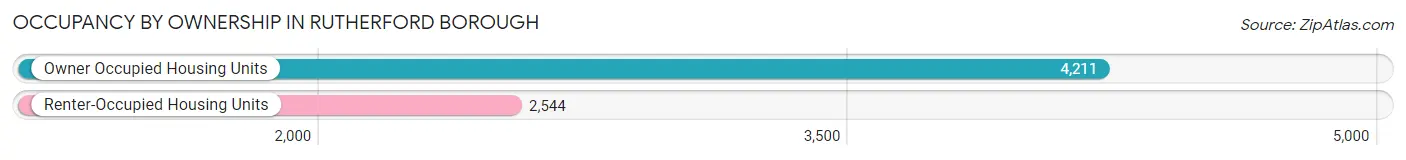
| Occupancy | # Housing Units | % Housing Units |
| Owner Occupied Housing Units | 4,211 | 62.3% |
| Renter-Occupied Housing Units | 2,544 | 37.7% |
| Total Occupied Housing Units | 6,755 | 100.0% |
Occupancy by Household Size in Rutherford borough
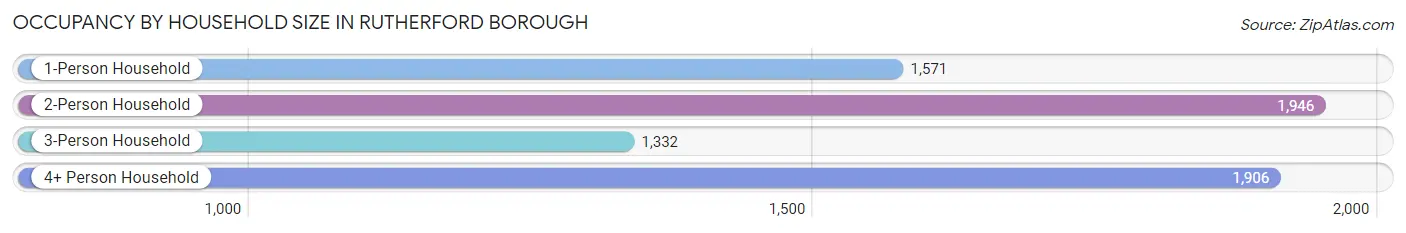
| Household Size | # Housing Units | % Housing Units |
| 1-Person Household | 1,571 | 23.3% |
| 2-Person Household | 1,946 | 28.8% |
| 3-Person Household | 1,332 | 19.7% |
| 4+ Person Household | 1,906 | 28.2% |
| Total Housing Units | 6,755 | 100.0% |
Occupancy by Ownership by Household Size in Rutherford borough
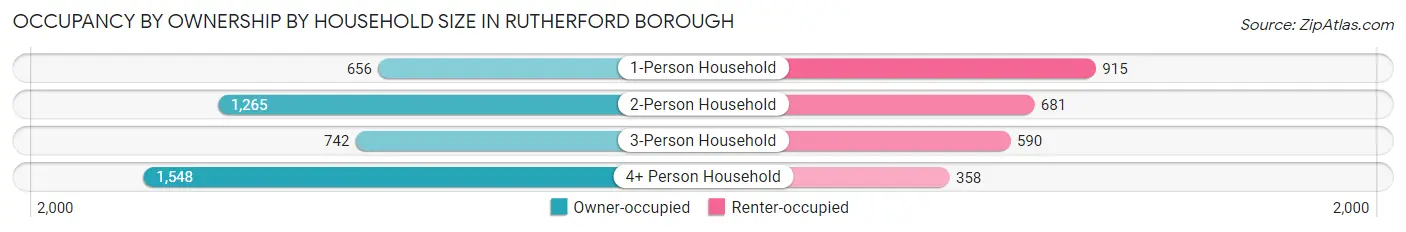
| Household Size | Owner-occupied | Renter-occupied |
| 1-Person Household | 656 (41.8%) | 915 (58.2%) |
| 2-Person Household | 1,265 (65.0%) | 681 (35.0%) |
| 3-Person Household | 742 (55.7%) | 590 (44.3%) |
| 4+ Person Household | 1,548 (81.2%) | 358 (18.8%) |
| Total Housing Units | 4,211 (62.3%) | 2,544 (37.7%) |
Occupancy by Educational Attainment in Rutherford borough
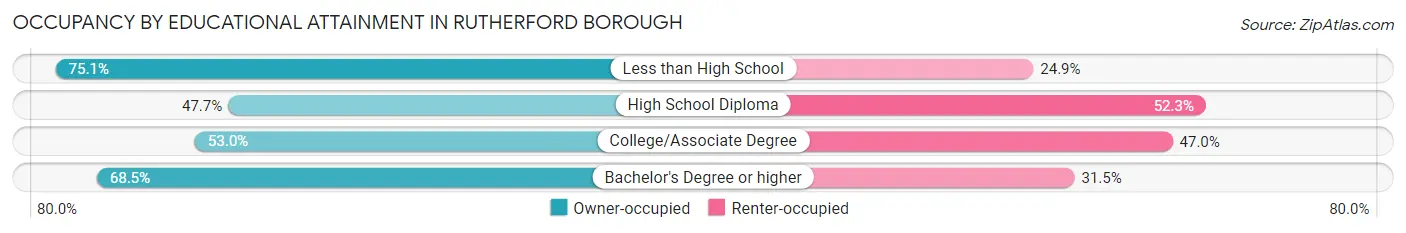
| Household Size | Owner-occupied | Renter-occupied |
| Less than High School | 253 (75.1%) | 84 (24.9%) |
| High School Diploma | 514 (47.7%) | 563 (52.3%) |
| College/Associate Degree | 737 (53.0%) | 654 (47.0%) |
| Bachelor's Degree or higher | 2,707 (68.5%) | 1,243 (31.5%) |
Occupancy by Age of Householder in Rutherford borough
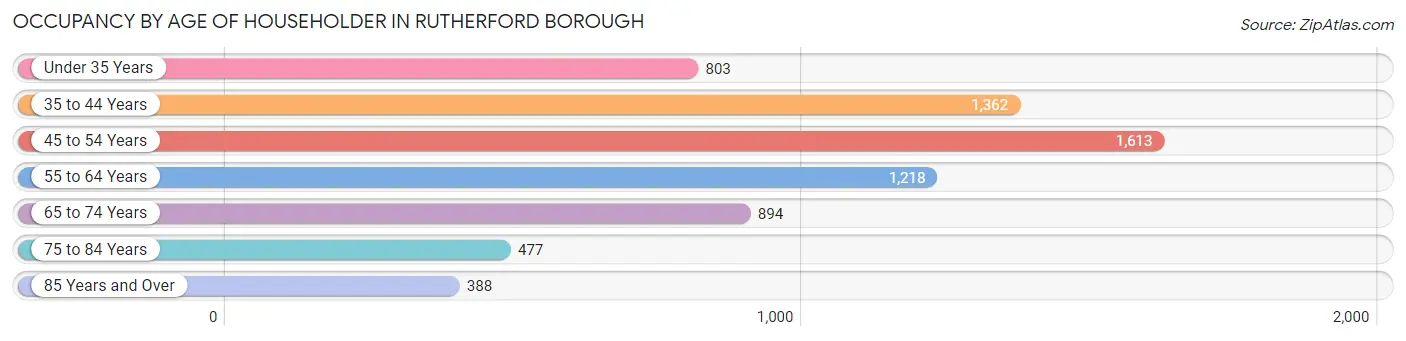
| Age Bracket | # Households | % Households |
| Under 35 Years | 803 | 11.9% |
| 35 to 44 Years | 1,362 | 20.2% |
| 45 to 54 Years | 1,613 | 23.9% |
| 55 to 64 Years | 1,218 | 18.0% |
| 65 to 74 Years | 894 | 13.2% |
| 75 to 84 Years | 477 | 7.1% |
| 85 Years and Over | 388 | 5.7% |
| Total | 6,755 | 100.0% |
Housing Finances in Rutherford borough
Median Income by Occupancy in Rutherford borough
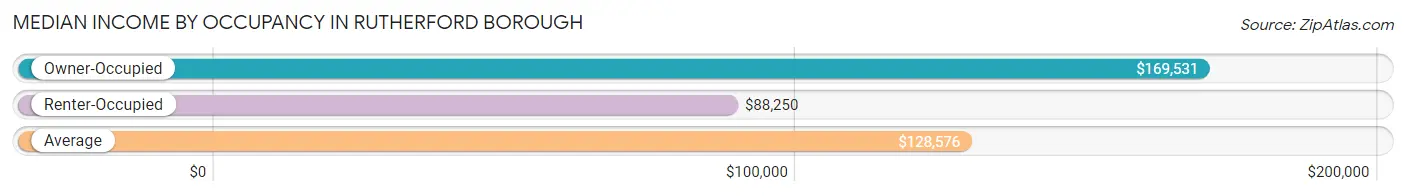
| Occupancy Type | # Households | Median Income |
| Owner-Occupied | 4,211 (62.3%) | $169,531 |
| Renter-Occupied | 2,544 (37.7%) | $88,250 |
| Average | 6,755 (100.0%) | $128,576 |
Occupancy by Householder Income Bracket in Rutherford borough
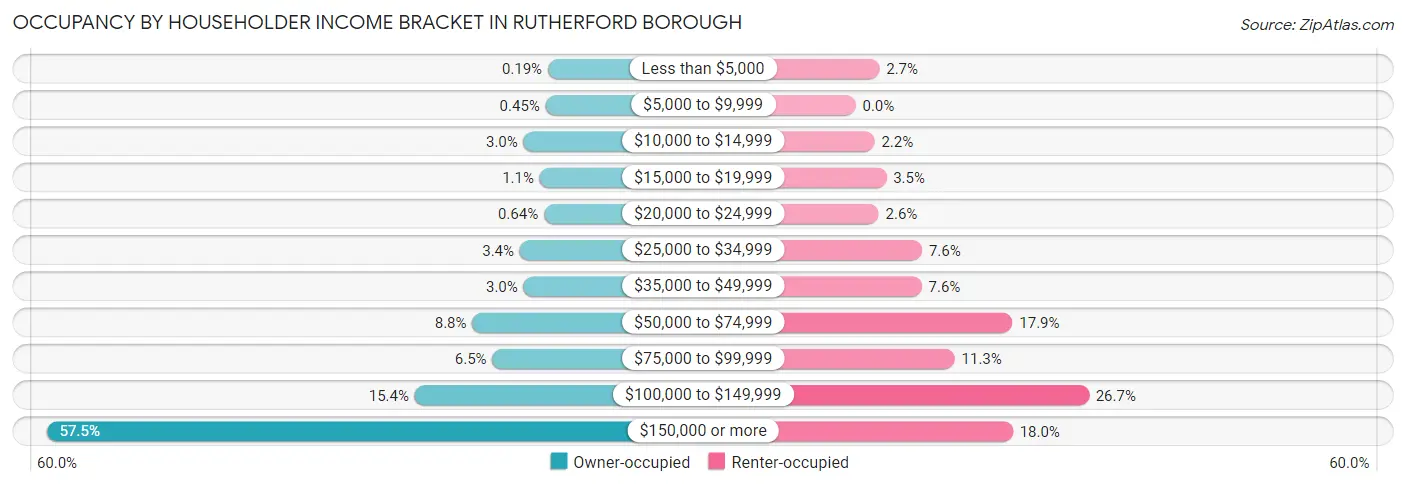
| Income Bracket | Owner-occupied | Renter-occupied |
| Less than $5,000 | 8 (0.2%) | 69 (2.7%) |
| $5,000 to $9,999 | 19 (0.4%) | 0 (0.0%) |
| $10,000 to $14,999 | 125 (3.0%) | 55 (2.2%) |
| $15,000 to $19,999 | 47 (1.1%) | 89 (3.5%) |
| $20,000 to $24,999 | 27 (0.6%) | 67 (2.6%) |
| $25,000 to $34,999 | 143 (3.4%) | 193 (7.6%) |
| $35,000 to $49,999 | 125 (3.0%) | 192 (7.5%) |
| $50,000 to $74,999 | 372 (8.8%) | 456 (17.9%) |
| $75,000 to $99,999 | 275 (6.5%) | 288 (11.3%) |
| $100,000 to $149,999 | 649 (15.4%) | 678 (26.7%) |
| $150,000 or more | 2,421 (57.5%) | 457 (18.0%) |
| Total | 4,211 (100.0%) | 2,544 (100.0%) |
Monthly Housing Cost Tiers in Rutherford borough
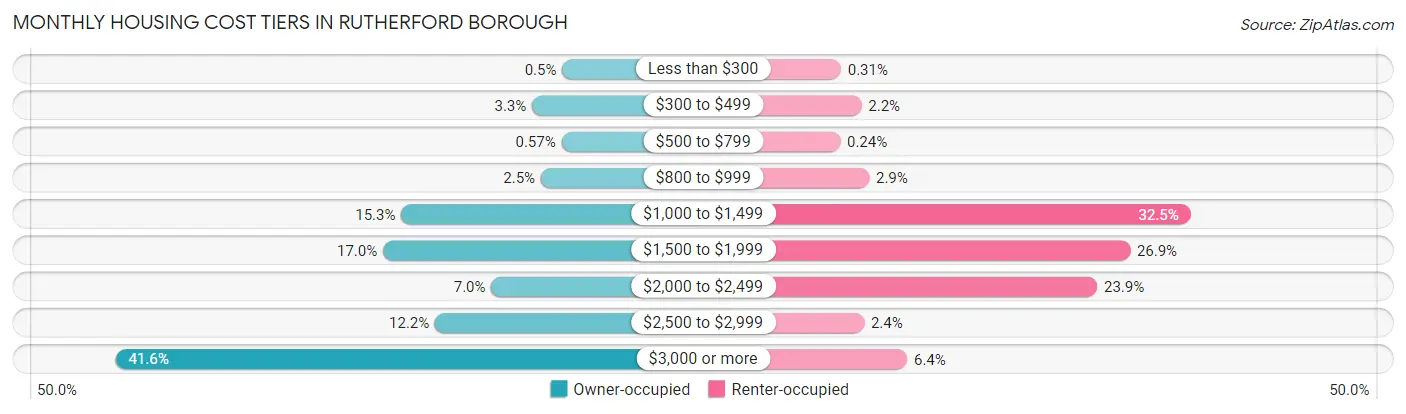
| Monthly Cost | Owner-occupied | Renter-occupied |
| Less than $300 | 21 (0.5%) | 8 (0.3%) |
| $300 to $499 | 138 (3.3%) | 56 (2.2%) |
| $500 to $799 | 24 (0.6%) | 6 (0.2%) |
| $800 to $999 | 104 (2.5%) | 74 (2.9%) |
| $1,000 to $1,499 | 645 (15.3%) | 827 (32.5%) |
| $1,500 to $1,999 | 716 (17.0%) | 685 (26.9%) |
| $2,000 to $2,499 | 296 (7.0%) | 608 (23.9%) |
| $2,500 to $2,999 | 514 (12.2%) | 62 (2.4%) |
| $3,000 or more | 1,753 (41.6%) | 163 (6.4%) |
| Total | 4,211 (100.0%) | 2,544 (100.0%) |
Physical Housing Characteristics in Rutherford borough
Housing Structures in Rutherford borough
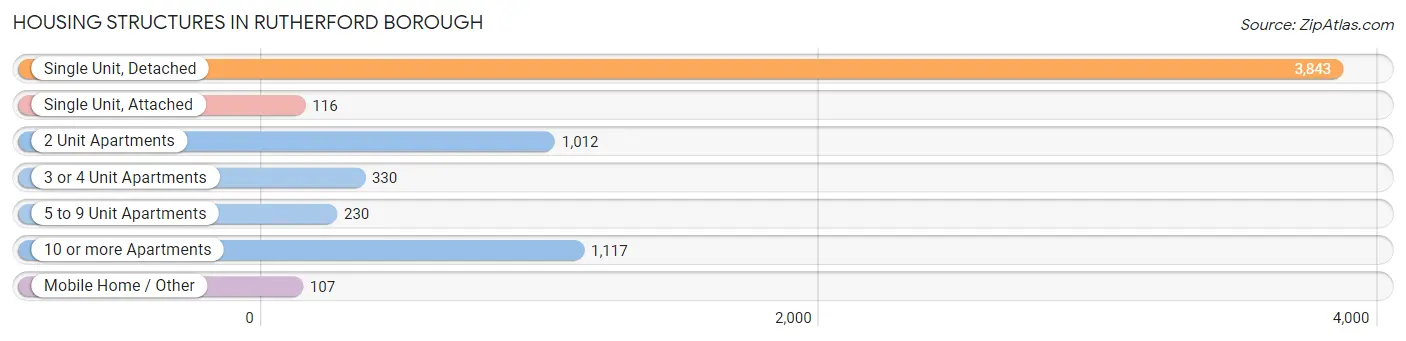
| Structure Type | # Housing Units | % Housing Units |
| Single Unit, Detached | 3,843 | 56.9% |
| Single Unit, Attached | 116 | 1.7% |
| 2 Unit Apartments | 1,012 | 15.0% |
| 3 or 4 Unit Apartments | 330 | 4.9% |
| 5 to 9 Unit Apartments | 230 | 3.4% |
| 10 or more Apartments | 1,117 | 16.5% |
| Mobile Home / Other | 107 | 1.6% |
| Total | 6,755 | 100.0% |
Housing Structures by Occupancy in Rutherford borough
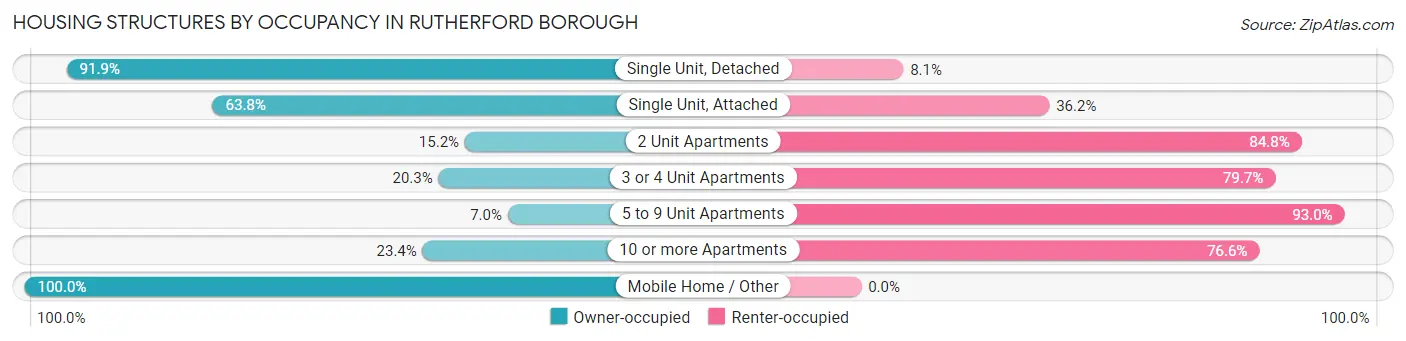
| Structure Type | Owner-occupied | Renter-occupied |
| Single Unit, Detached | 3,532 (91.9%) | 311 (8.1%) |
| Single Unit, Attached | 74 (63.8%) | 42 (36.2%) |
| 2 Unit Apartments | 154 (15.2%) | 858 (84.8%) |
| 3 or 4 Unit Apartments | 67 (20.3%) | 263 (79.7%) |
| 5 to 9 Unit Apartments | 16 (7.0%) | 214 (93.0%) |
| 10 or more Apartments | 261 (23.4%) | 856 (76.6%) |
| Mobile Home / Other | 107 (100.0%) | 0 (0.0%) |
| Total | 4,211 (62.3%) | 2,544 (37.7%) |
Housing Structures by Number of Rooms in Rutherford borough
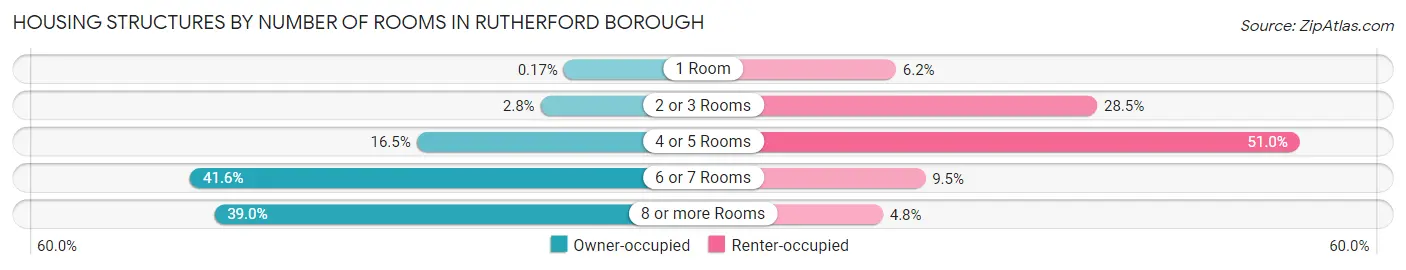
| Number of Rooms | Owner-occupied | Renter-occupied |
| 1 Room | 7 (0.2%) | 158 (6.2%) |
| 2 or 3 Rooms | 116 (2.8%) | 726 (28.5%) |
| 4 or 5 Rooms | 695 (16.5%) | 1,298 (51.0%) |
| 6 or 7 Rooms | 1,753 (41.6%) | 241 (9.5%) |
| 8 or more Rooms | 1,640 (39.0%) | 121 (4.8%) |
| Total | 4,211 (100.0%) | 2,544 (100.0%) |
Housing Structure by Heating Type in Rutherford borough
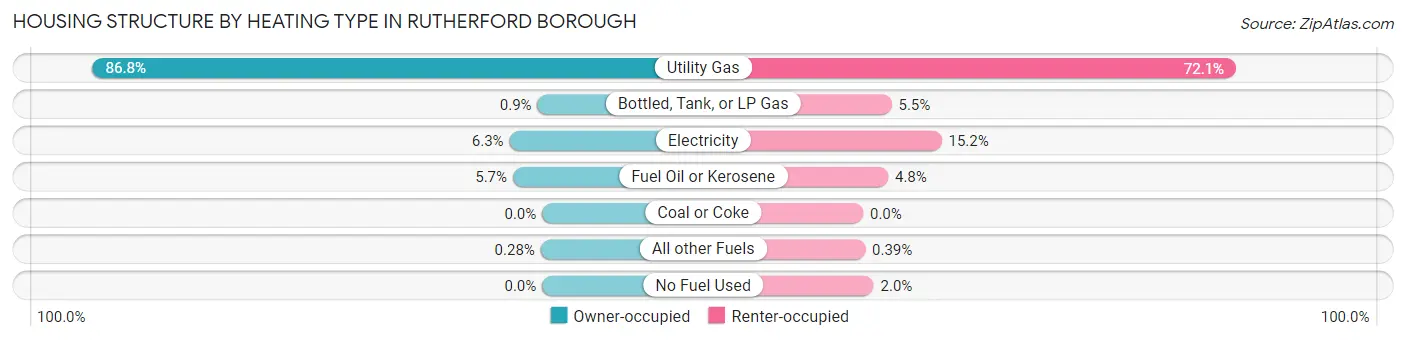
| Heating Type | Owner-occupied | Renter-occupied |
| Utility Gas | 3,657 (86.8%) | 1,833 (72.1%) |
| Bottled, Tank, or LP Gas | 38 (0.9%) | 140 (5.5%) |
| Electricity | 266 (6.3%) | 386 (15.2%) |
| Fuel Oil or Kerosene | 238 (5.7%) | 123 (4.8%) |
| Coal or Coke | 0 (0.0%) | 0 (0.0%) |
| All other Fuels | 12 (0.3%) | 10 (0.4%) |
| No Fuel Used | 0 (0.0%) | 52 (2.0%) |
| Total | 4,211 (100.0%) | 2,544 (100.0%) |
Household Vehicle Usage in Rutherford borough
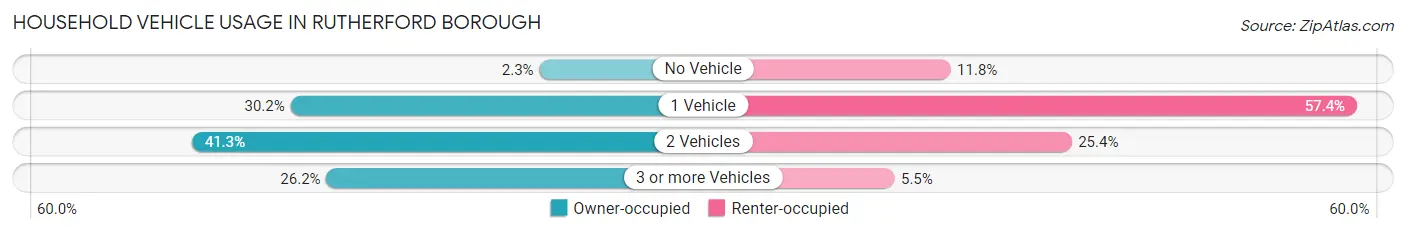
| Vehicles per Household | Owner-occupied | Renter-occupied |
| No Vehicle | 98 (2.3%) | 300 (11.8%) |
| 1 Vehicle | 1,272 (30.2%) | 1,459 (57.4%) |
| 2 Vehicles | 1,738 (41.3%) | 645 (25.4%) |
| 3 or more Vehicles | 1,103 (26.2%) | 140 (5.5%) |
| Total | 4,211 (100.0%) | 2,544 (100.0%) |
Real Estate & Mortgages in Rutherford borough
Real Estate and Mortgage Overview in Rutherford borough
| Characteristic | Without Mortgage | With Mortgage |
| Housing Units | 1,640 | 2,571 |
| Median Property Value | $509,200 | $608,400 |
| Median Household Income | $100,435 | $1,795 |
| Monthly Housing Costs | $1,460 | $1,753 |
| Real Estate Taxes | $10,001 | $9 |
Property Value by Mortgage Status in Rutherford borough
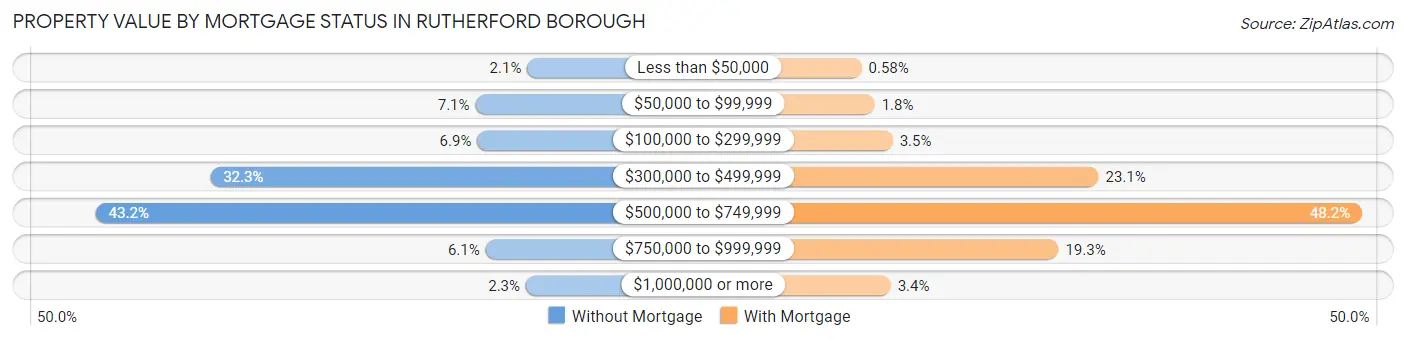
| Property Value | Without Mortgage | With Mortgage |
| Less than $50,000 | 35 (2.1%) | 15 (0.6%) |
| $50,000 to $99,999 | 116 (7.1%) | 47 (1.8%) |
| $100,000 to $299,999 | 113 (6.9%) | 91 (3.5%) |
| $300,000 to $499,999 | 530 (32.3%) | 595 (23.1%) |
| $500,000 to $749,999 | 709 (43.2%) | 1,240 (48.2%) |
| $750,000 to $999,999 | 100 (6.1%) | 497 (19.3%) |
| $1,000,000 or more | 37 (2.3%) | 86 (3.4%) |
| Total | 1,640 (100.0%) | 2,571 (100.0%) |
Household Income by Mortgage Status in Rutherford borough
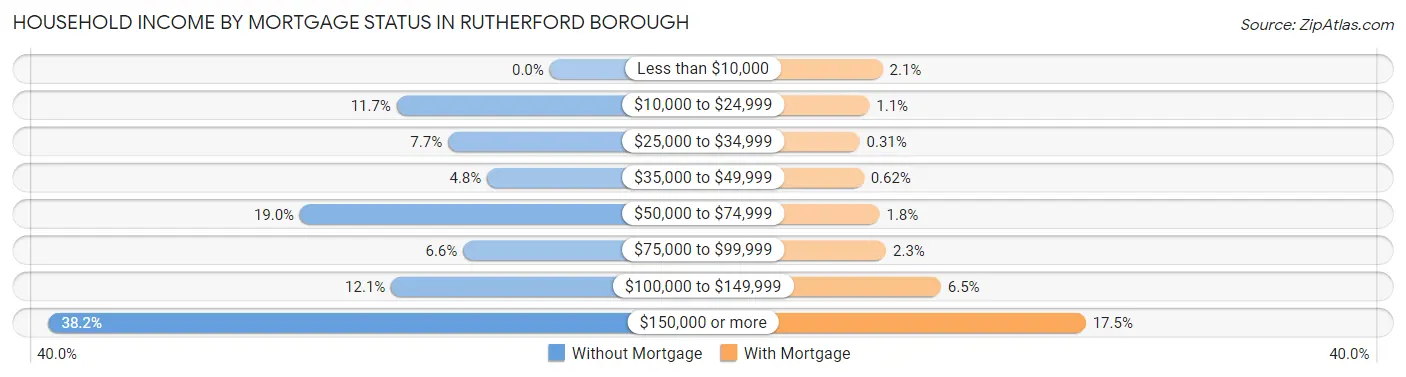
| Household Income | Without Mortgage | With Mortgage |
| Less than $10,000 | 0 (0.0%) | 53 (2.1%) |
| $10,000 to $24,999 | 191 (11.7%) | 27 (1.1%) |
| $25,000 to $34,999 | 127 (7.7%) | 8 (0.3%) |
| $35,000 to $49,999 | 78 (4.8%) | 16 (0.6%) |
| $50,000 to $74,999 | 312 (19.0%) | 47 (1.8%) |
| $75,000 to $99,999 | 108 (6.6%) | 60 (2.3%) |
| $100,000 to $149,999 | 198 (12.1%) | 167 (6.5%) |
| $150,000 or more | 626 (38.2%) | 451 (17.5%) |
| Total | 1,640 (100.0%) | 2,571 (100.0%) |
Property Value to Household Income Ratio in Rutherford borough
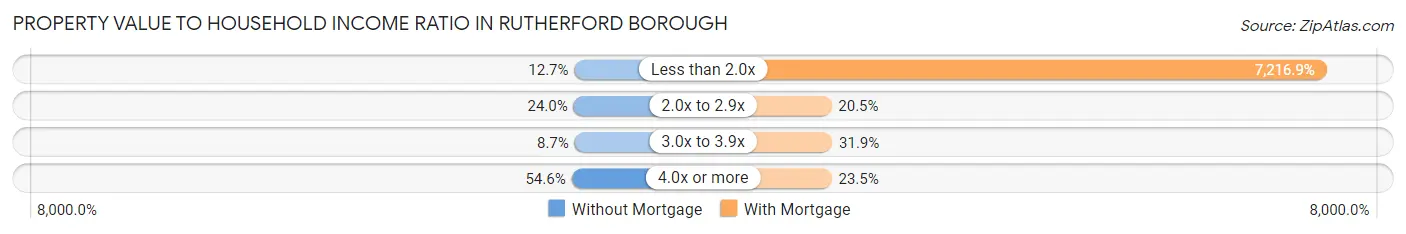
| Value-to-Income Ratio | Without Mortgage | With Mortgage |
| Less than 2.0x | 209 (12.7%) | 185,547 (7,216.9%) |
| 2.0x to 2.9x | 393 (24.0%) | 526 (20.5%) |
| 3.0x to 3.9x | 143 (8.7%) | 819 (31.9%) |
| 4.0x or more | 895 (54.6%) | 604 (23.5%) |
| Total | 1,640 (100.0%) | 2,571 (100.0%) |
Real Estate Taxes by Mortgage Status in Rutherford borough
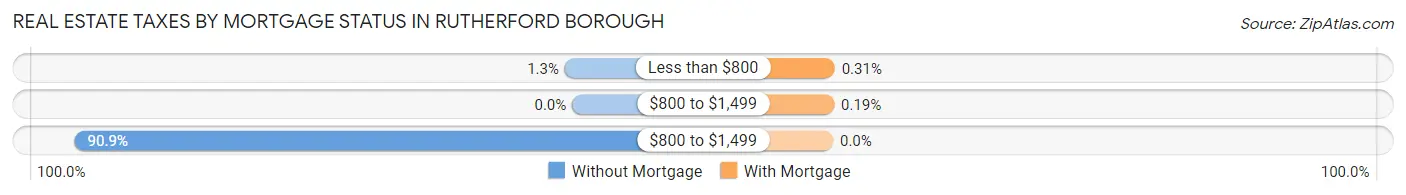
| Property Taxes | Without Mortgage | With Mortgage |
| Less than $800 | 22 (1.3%) | 8 (0.3%) |
| $800 to $1,499 | 0 (0.0%) | 5 (0.2%) |
| $800 to $1,499 | 1,490 (90.8%) | 0 (0.0%) |
| Total | 1,640 (100.0%) | 2,571 (100.0%) |
Health & Disability in Rutherford borough
Health Insurance Coverage by Age in Rutherford borough
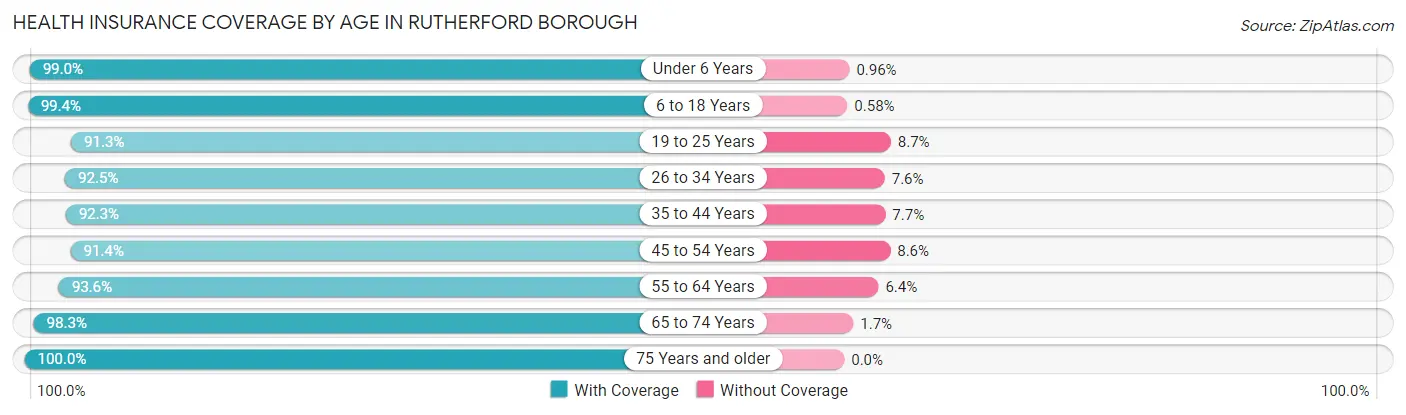
| Age Bracket | With Coverage | Without Coverage |
| Under 6 Years | 822 (99.0%) | 8 (1.0%) |
| 6 to 18 Years | 3,279 (99.4%) | 19 (0.6%) |
| 19 to 25 Years | 1,821 (91.3%) | 173 (8.7%) |
| 26 to 34 Years | 1,654 (92.4%) | 135 (7.5%) |
| 35 to 44 Years | 2,456 (92.3%) | 204 (7.7%) |
| 45 to 54 Years | 2,844 (91.4%) | 267 (8.6%) |
| 55 to 64 Years | 2,024 (93.6%) | 138 (6.4%) |
| 65 to 74 Years | 1,514 (98.3%) | 26 (1.7%) |
| 75 Years and older | 1,370 (100.0%) | 0 (0.0%) |
| Total | 17,784 (94.8%) | 970 (5.2%) |
Health Insurance Coverage by Citizenship Status in Rutherford borough
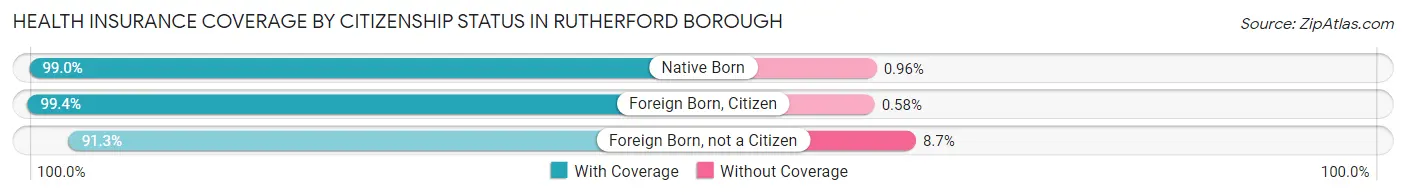
| Citizenship Status | With Coverage | Without Coverage |
| Native Born | 822 (99.0%) | 8 (1.0%) |
| Foreign Born, Citizen | 3,279 (99.4%) | 19 (0.6%) |
| Foreign Born, not a Citizen | 1,821 (91.3%) | 173 (8.7%) |
Health Insurance Coverage by Household Income in Rutherford borough
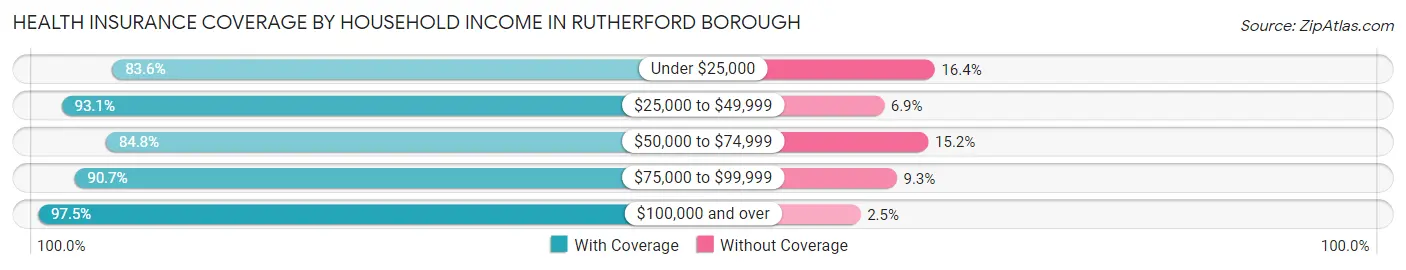
| Household Income | With Coverage | Without Coverage |
| Under $25,000 | 580 (83.6%) | 114 (16.4%) |
| $25,000 to $49,999 | 981 (93.1%) | 73 (6.9%) |
| $50,000 to $74,999 | 1,419 (84.8%) | 255 (15.2%) |
| $75,000 to $99,999 | 1,342 (90.7%) | 138 (9.3%) |
| $100,000 and over | 13,105 (97.5%) | 338 (2.5%) |
Public vs Private Health Insurance Coverage by Age in Rutherford borough
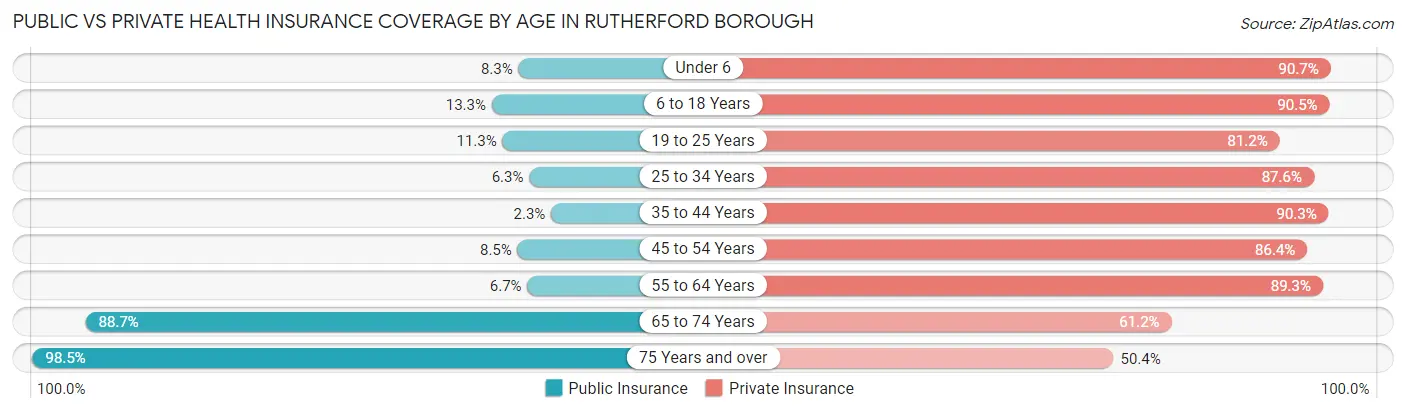
| Age Bracket | Public Insurance | Private Insurance |
| Under 6 | 69 (8.3%) | 753 (90.7%) |
| 6 to 18 Years | 438 (13.3%) | 2,985 (90.5%) |
| 19 to 25 Years | 225 (11.3%) | 1,620 (81.2%) |
| 25 to 34 Years | 113 (6.3%) | 1,567 (87.6%) |
| 35 to 44 Years | 60 (2.3%) | 2,403 (90.3%) |
| 45 to 54 Years | 264 (8.5%) | 2,687 (86.4%) |
| 55 to 64 Years | 144 (6.7%) | 1,930 (89.3%) |
| 65 to 74 Years | 1,366 (88.7%) | 942 (61.2%) |
| 75 Years and over | 1,350 (98.5%) | 691 (50.4%) |
| Total | 4,029 (21.5%) | 15,578 (83.1%) |
Disability Status by Sex by Age in Rutherford borough
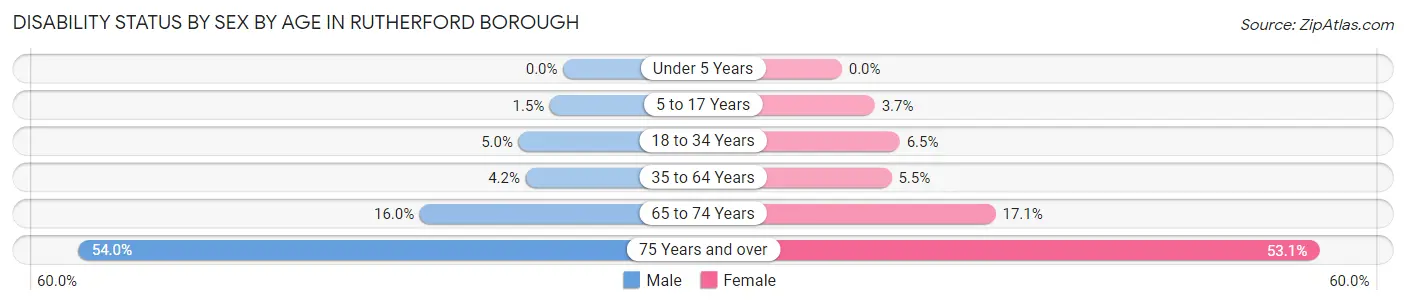
| Age Bracket | Male | Female |
| Under 5 Years | 0 (0.0%) | 0 (0.0%) |
| 5 to 17 Years | 23 (1.5%) | 50 (3.7%) |
| 18 to 34 Years | 115 (5.0%) | 128 (6.5%) |
| 35 to 64 Years | 163 (4.2%) | 223 (5.5%) |
| 65 to 74 Years | 106 (16.0%) | 150 (17.1%) |
| 75 Years and over | 266 (54.0%) | 466 (53.1%) |
Disability Class by Sex by Age in Rutherford borough
Disability Class: Hearing Difficulty
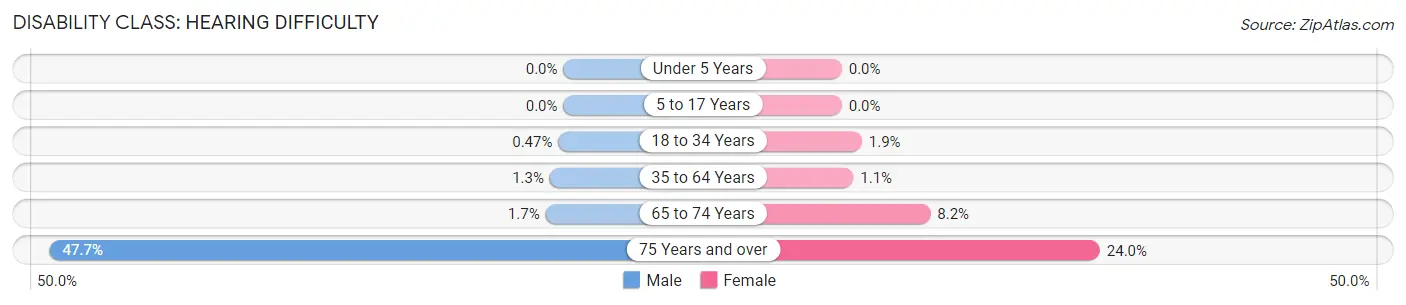
| Age Bracket | Male | Female |
| Under 5 Years | 0 (0.0%) | 0 (0.0%) |
| 5 to 17 Years | 0 (0.0%) | 0 (0.0%) |
| 18 to 34 Years | 11 (0.5%) | 37 (1.9%) |
| 35 to 64 Years | 49 (1.3%) | 43 (1.1%) |
| 65 to 74 Years | 11 (1.7%) | 72 (8.2%) |
| 75 Years and over | 235 (47.7%) | 210 (23.9%) |
Disability Class: Vision Difficulty
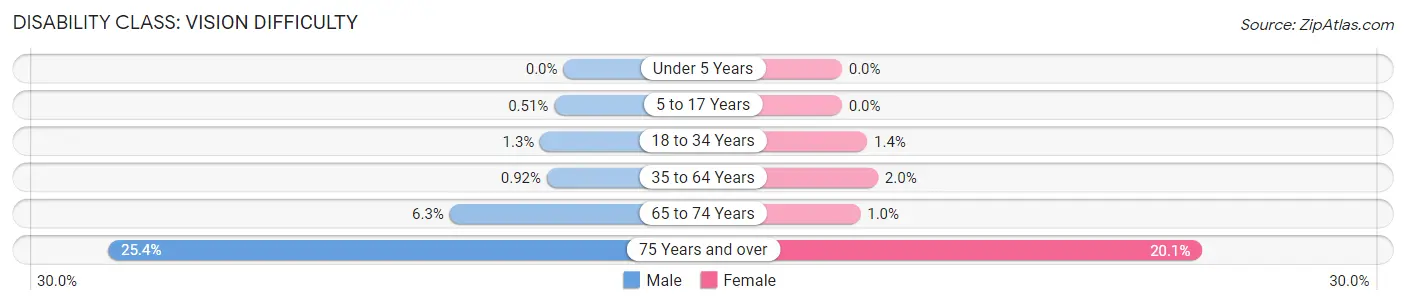
| Age Bracket | Male | Female |
| Under 5 Years | 0 (0.0%) | 0 (0.0%) |
| 5 to 17 Years | 8 (0.5%) | 0 (0.0%) |
| 18 to 34 Years | 30 (1.3%) | 28 (1.4%) |
| 35 to 64 Years | 36 (0.9%) | 81 (2.0%) |
| 65 to 74 Years | 42 (6.3%) | 9 (1.0%) |
| 75 Years and over | 125 (25.4%) | 176 (20.1%) |
Disability Class: Cognitive Difficulty
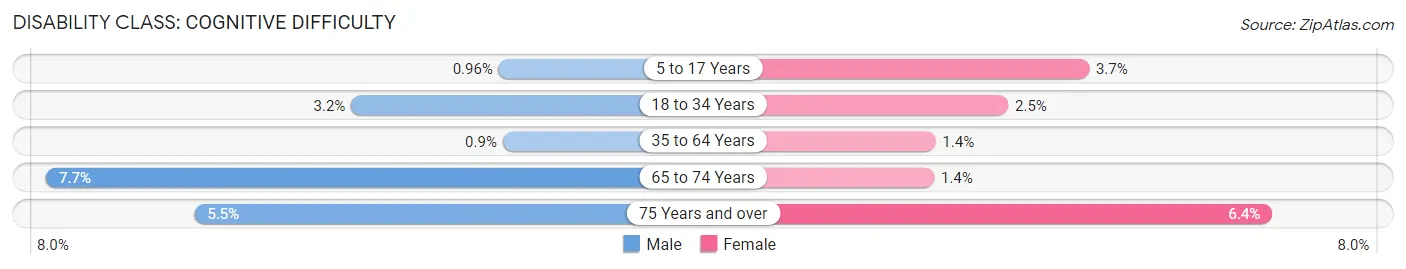
| Age Bracket | Male | Female |
| 5 to 17 Years | 15 (1.0%) | 50 (3.7%) |
| 18 to 34 Years | 73 (3.2%) | 49 (2.5%) |
| 35 to 64 Years | 35 (0.9%) | 56 (1.4%) |
| 65 to 74 Years | 51 (7.7%) | 12 (1.4%) |
| 75 Years and over | 27 (5.5%) | 56 (6.4%) |
Disability Class: Ambulatory Difficulty
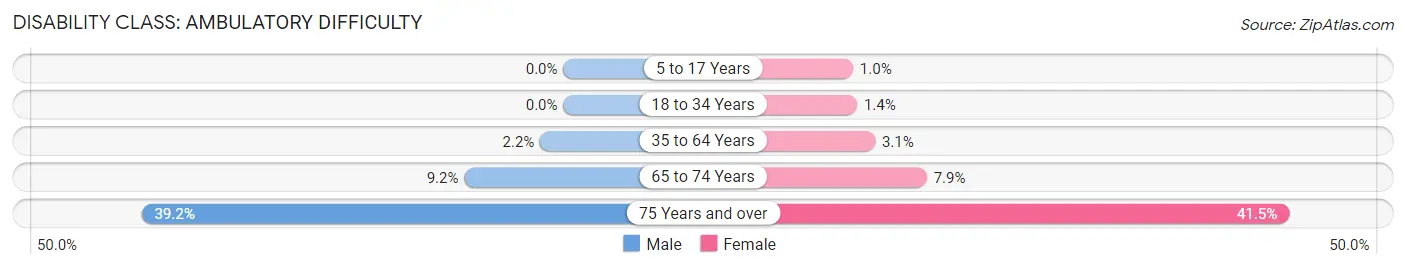
| Age Bracket | Male | Female |
| 5 to 17 Years | 0 (0.0%) | 14 (1.0%) |
| 18 to 34 Years | 0 (0.0%) | 28 (1.4%) |
| 35 to 64 Years | 84 (2.1%) | 124 (3.1%) |
| 65 to 74 Years | 61 (9.2%) | 69 (7.9%) |
| 75 Years and over | 193 (39.2%) | 364 (41.5%) |
Disability Class: Self-Care Difficulty
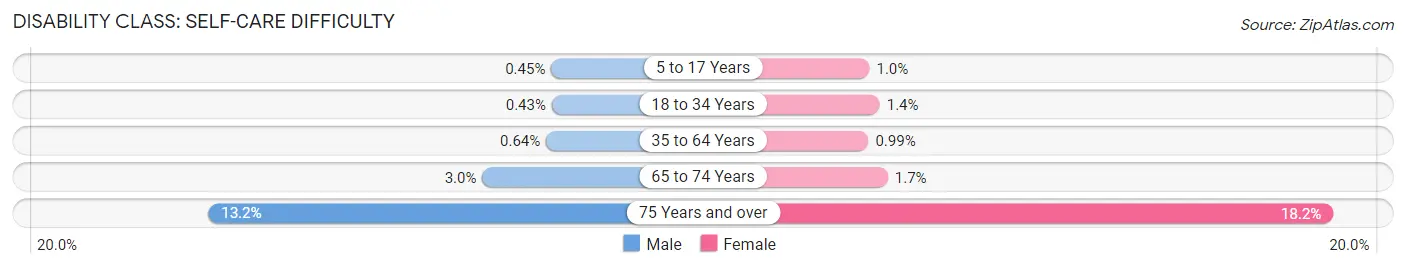
| Age Bracket | Male | Female |
| 5 to 17 Years | 7 (0.4%) | 14 (1.0%) |
| 18 to 34 Years | 10 (0.4%) | 28 (1.4%) |
| 35 to 64 Years | 25 (0.6%) | 40 (1.0%) |
| 65 to 74 Years | 20 (3.0%) | 15 (1.7%) |
| 75 Years and over | 65 (13.2%) | 160 (18.2%) |
Technology Access in Rutherford borough
Computing Device Access in Rutherford borough
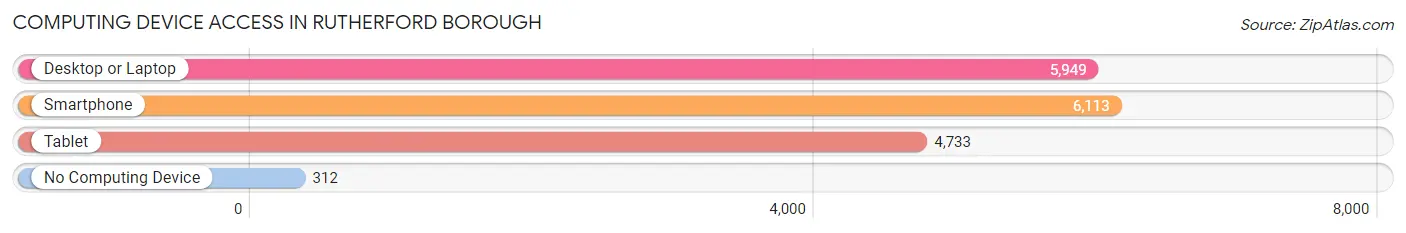
| Device Type | # Households | % Households |
| Desktop or Laptop | 5,949 | 88.1% |
| Smartphone | 6,113 | 90.5% |
| Tablet | 4,733 | 70.1% |
| No Computing Device | 312 | 4.6% |
| Total | 6,755 | 100.0% |
Internet Access in Rutherford borough
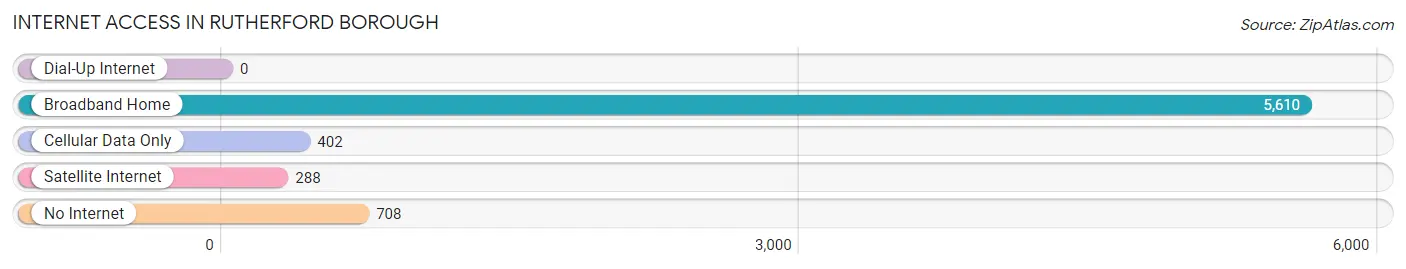
| Internet Type | # Households | % Households |
| Dial-Up Internet | 0 | 0.0% |
| Broadband Home | 5,610 | 83.1% |
| Cellular Data Only | 402 | 5.9% |
| Satellite Internet | 288 | 4.3% |
| No Internet | 708 | 10.5% |
| Total | 6,755 | 100.0% |
Rutherford borough Summary
Rutherford Borough is a small borough located in Bergen County, New Jersey. It is situated in the heart of the Meadowlands region, just 12 miles west of New York City. The borough is home to approximately 18,000 people and covers an area of 2.2 square miles.
History
Rutherford was first settled in the early 1700s by Dutch settlers. The area was originally part of the larger Saddle River Township, which was established in 1710. In 1881, the area was incorporated as the Borough of Rutherford. The borough was named after John Rutherfurd, a prominent local landowner and politician.
Rutherford was an important industrial center in the late 19th and early 20th centuries. The borough was home to several factories, including the American Caramel Company, the Rutherford Iron Works, and the Rutherford Paper Company. The borough also had a thriving retail sector, with several stores and shops located along Park Avenue.
Geography
Rutherford is located in the Meadowlands region of New Jersey. The borough is situated on the Hackensack River, which forms its western border. The borough is bordered by the towns of East Rutherford, Lyndhurst, and North Arlington. The borough is located 12 miles west of New York City and is easily accessible via the New Jersey Turnpike and the Garden State Parkway.
The borough is mostly flat, with an elevation of just 20 feet above sea level. The borough is home to several parks, including Memorial Park, Lincoln Park, and the Rutherford Greenway.
Economy
Rutherford is a primarily residential community, with a small but vibrant business sector. The borough is home to several corporate headquarters, including the headquarters of the New Jersey Sports and Exposition Authority. The borough is also home to several retail stores, restaurants, and other businesses.
The borough is also home to several industrial parks, including the Meadowlands Industrial Park and the Rutherford Industrial Park. These parks are home to a variety of businesses, including manufacturing, warehousing, and distribution companies.
Demographics
As of the 2010 census, the population of Rutherford was 18,061. The racial makeup of the borough was 79.3% White, 8.2% African American, 0.3% Native American, 5.2% Asian, and 6.9% from other races. Hispanic or Latino of any race were 15.2% of the population.
The median household income in Rutherford was $76,837, and the median family income was $90,917. The per capita income was $37,945. About 5.2% of families and 6.7% of the population were below the poverty line.
Rutherford is a diverse community, with a variety of cultures and backgrounds represented. The borough is home to a large Italian-American population, as well as a growing Hispanic population. The borough is also home to a large Jewish community, with several synagogues located in the borough.
Common Questions
What is Per Capita Income in Rutherford borough?
Per Capita income in Rutherford borough is $57,150.
What is the Median Family Income in Rutherford borough?
Median Family Income in Rutherford borough is $151,812.
What is the Median Household income in Rutherford borough?
Median Household Income in Rutherford borough is $128,576.
What is Income or Wage Gap in Rutherford borough?
Income or Wage Gap in Rutherford borough is 15.8%.
Women in Rutherford borough earn 84.2 cents for every dollar earned by a man.
What is Inequality or Gini Index in Rutherford borough?
Inequality or Gini Index in Rutherford borough is 0.41.
What is the Total Population of Rutherford borough?
Total Population of Rutherford borough is 18,754.
What is the Total Male Population of Rutherford borough?
Total Male Population of Rutherford borough is 9,306.
What is the Total Female Population of Rutherford borough?
Total Female Population of Rutherford borough is 9,448.
What is the Ratio of Males per 100 Females in Rutherford borough?
There are 98.50 Males per 100 Females in Rutherford borough.
What is the Ratio of Females per 100 Males in Rutherford borough?
There are 101.53 Females per 100 Males in Rutherford borough.
What is the Median Population Age in Rutherford borough?
Median Population Age in Rutherford borough is 40.5 Years.
What is the Average Family Size in Rutherford borough
Average Family Size in Rutherford borough is 3.2 People.
What is the Average Household Size in Rutherford borough
Average Household Size in Rutherford borough is 2.7 People.
How Large is the Labor Force in Rutherford borough?
There are 10,574 People in the Labor Forcein in Rutherford borough.
What is the Percentage of People in the Labor Force in Rutherford borough?
67.1% of People are in the Labor Force in Rutherford borough.
What is the Unemployment Rate in Rutherford borough?
Unemployment Rate in Rutherford borough is 3.3%.