Cities with the Highest Percentage of Asian Population in South Carolina
RELATED REPORTS & OPTIONS
Asian
South Carolina
Compare Cities
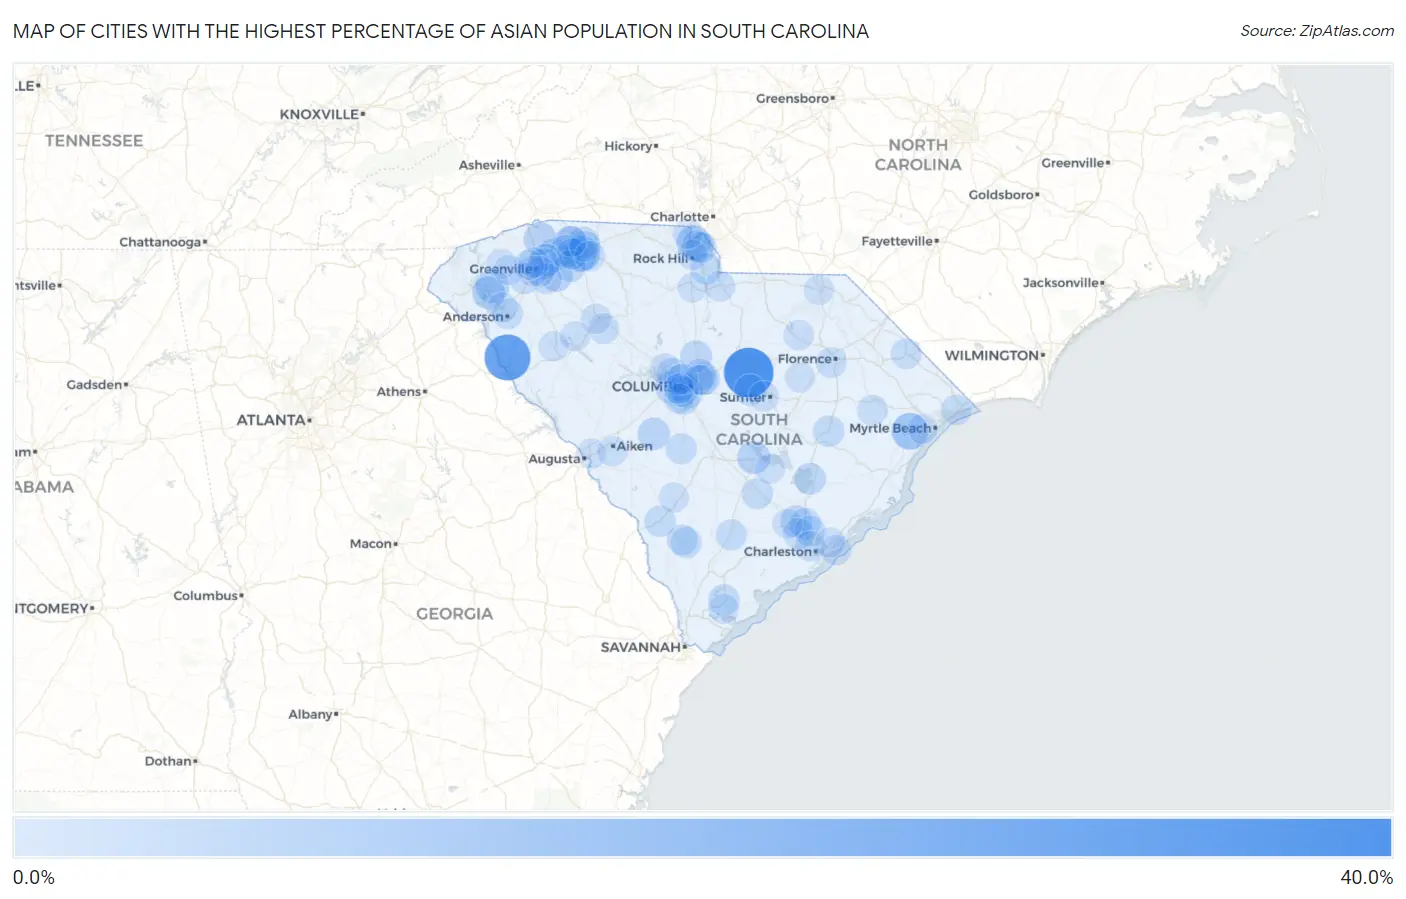
Map of Cities with the Highest Percentage of Asian Population in South Carolina
0.0%
40.0%
Cities with the Highest Percentage of Asian Population in South Carolina
| City | Asian | vs State | vs National | |
| 1. | Rembert | 35.3% | 1.7%(+33.6)#1 | 5.8%(+29.5)#192 |
| 2. | Lowndesville | 28.8% | 1.7%(+27.1)#2 | 5.8%(+23.0)#298 |
| 3. | Camp Croft | 15.9% | 1.7%(+14.2)#3 | 5.8%(+10.1)#770 |
| 4. | Bucksport | 12.6% | 1.7%(+11.0)#4 | 5.8%(+6.86)#1,042 |
| 5. | Arcadia | 9.4% | 1.7%(+7.75)#5 | 5.8%(+3.64)#1,522 |
| 6. | Tega Cay | 8.6% | 1.7%(+6.90)#6 | 5.8%(+2.79)#1,688 |
| 7. | Sandy Springs | 7.9% | 1.7%(+6.23)#7 | 5.8%(+2.13)#1,834 |
| 8. | Central | 7.5% | 1.7%(+5.79)#8 | 5.8%(+1.68)#1,947 |
| 9. | Fairforest | 7.3% | 1.7%(+5.65)#9 | 5.8%(+1.55)#1,988 |
| 10. | Santee | 6.5% | 1.7%(+4.81)#10 | 5.8%(+0.703)#2,275 |
| 11. | Five Forks | 6.4% | 1.7%(+4.77)#11 | 5.8%(+0.666)#2,287 |
| 12. | Clemson | 6.4% | 1.7%(+4.76)#12 | 5.8%(+0.658)#2,290 |
| 13. | Greer | 6.3% | 1.7%(+4.65)#13 | 5.8%(+0.542)#2,340 |
| 14. | Inman Mills | 5.9% | 1.7%(+4.19)#14 | 5.8%(+0.085)#2,538 |
| 15. | Tigerville | 5.7% | 1.7%(+4.08)#15 | 5.8%(-0.023)#2,586 |
| 16. | Lexington | 5.5% | 1.7%(+3.85)#16 | 5.8%(-0.250)#2,705 |
| 17. | Woodfield | 5.4% | 1.7%(+3.72)#17 | 5.8%(-0.385)#2,773 |
| 18. | Lyman | 5.4% | 1.7%(+3.71)#18 | 5.8%(-0.395)#2,780 |
| 19. | Wagener | 5.2% | 1.7%(+3.57)#19 | 5.8%(-0.530)#2,859 |
| 20. | Taylors | 5.2% | 1.7%(+3.51)#20 | 5.8%(-0.591)#2,898 |
| 21. | Riverview | 4.6% | 1.7%(+2.96)#21 | 5.8%(-1.15)#3,209 |
| 22. | Ladson | 4.4% | 1.7%(+2.74)#22 | 5.8%(-1.36)#3,369 |
| 23. | Dentsville | 4.2% | 1.7%(+2.57)#23 | 5.8%(-1.53)#3,506 |
| 24. | Irmo | 4.2% | 1.7%(+2.57)#24 | 5.8%(-1.54)#3,507 |
| 25. | Blythewood | 4.2% | 1.7%(+2.50)#25 | 5.8%(-1.60)#3,556 |
| 26. | Cayce | 4.1% | 1.7%(+2.45)#26 | 5.8%(-1.66)#3,598 |
| 27. | Bonneau Beach | 4.1% | 1.7%(+2.40)#27 | 5.8%(-1.71)#3,637 |
| 28. | Boiling Springs | 4.0% | 1.7%(+2.36)#28 | 5.8%(-1.74)#3,665 |
| 29. | Reidville | 3.9% | 1.7%(+2.25)#29 | 5.8%(-1.85)#3,761 |
| 30. | Pine Ridge | 3.9% | 1.7%(+2.20)#30 | 5.8%(-1.90)#3,814 |
| 31. | Wellford | 3.8% | 1.7%(+2.17)#31 | 5.8%(-1.93)#3,831 |
| 32. | Catawba | 3.8% | 1.7%(+2.08)#32 | 5.8%(-2.02)#3,900 |
| 33. | Burton | 3.7% | 1.7%(+2.07)#33 | 5.8%(-2.04)#3,916 |
| 34. | Arkwright | 3.7% | 1.7%(+2.04)#34 | 5.8%(-2.06)#3,936 |
| 35. | Stateburg | 3.7% | 1.7%(+2.01)#35 | 5.8%(-2.09)#3,967 |
| 36. | Kingstree | 3.6% | 1.7%(+1.95)#36 | 5.8%(-2.15)#4,021 |
| 37. | Goose Creek | 3.6% | 1.7%(+1.95)#37 | 5.8%(-2.15)#4,023 |
| 38. | Arthurtown | 3.5% | 1.7%(+1.82)#38 | 5.8%(-2.28)#4,147 |
| 39. | Allendale | 3.4% | 1.7%(+1.74)#39 | 5.8%(-2.37)#4,241 |
| 40. | West Columbia | 3.4% | 1.7%(+1.73)#40 | 5.8%(-2.37)#4,247 |
| 41. | North Charleston | 3.3% | 1.7%(+1.67)#41 | 5.8%(-2.44)#4,321 |
| 42. | Neeses | 3.2% | 1.7%(+1.57)#42 | 5.8%(-2.53)#4,416 |
| 43. | Harleyville | 3.2% | 1.7%(+1.52)#43 | 5.8%(-2.59)#4,500 |
| 44. | Varnville | 3.2% | 1.7%(+1.51)#44 | 5.8%(-2.60)#4,509 |
| 45. | Springdale | 3.2% | 1.7%(+1.50)#45 | 5.8%(-2.60)#4,516 |
| 46. | Hanahan | 3.1% | 1.7%(+1.46)#46 | 5.8%(-2.64)#4,564 |
| 47. | Wyboo | 3.1% | 1.7%(+1.45)#47 | 5.8%(-2.66)#4,581 |
| 48. | Fort Mill | 3.1% | 1.7%(+1.44)#48 | 5.8%(-2.67)#4,597 |
| 49. | Wade Hampton | 3.1% | 1.7%(+1.40)#49 | 5.8%(-2.70)#4,641 |
| 50. | Walterboro | 3.1% | 1.7%(+1.40)#50 | 5.8%(-2.71)#4,653 |
| 51. | Valley Falls | 3.0% | 1.7%(+1.29)#51 | 5.8%(-2.82)#4,793 |
| 52. | Lake Murray Of Richland | 2.9% | 1.7%(+1.22)#52 | 5.8%(-2.88)#4,876 |
| 53. | Hampton | 2.8% | 1.7%(+1.16)#53 | 5.8%(-2.95)#4,973 |
| 54. | Inman | 2.7% | 1.7%(+1.04)#54 | 5.8%(-3.06)#5,128 |
| 55. | Florence | 2.7% | 1.7%(+0.986)#55 | 5.8%(-3.12)#5,219 |
| 56. | Mauldin | 2.6% | 1.7%(+0.939)#56 | 5.8%(-3.16)#5,289 |
| 57. | Nichols | 2.5% | 1.7%(+0.831)#57 | 5.8%(-3.27)#5,431 |
| 58. | North Myrtle Beach | 2.5% | 1.7%(+0.782)#58 | 5.8%(-3.32)#5,502 |
| 59. | Carolina Forest | 2.4% | 1.7%(+0.776)#59 | 5.8%(-3.33)#5,511 |
| 60. | Joanna | 2.4% | 1.7%(+0.749)#60 | 5.8%(-3.35)#5,561 |
| 61. | Powdersville | 2.4% | 1.7%(+0.728)#61 | 5.8%(-3.38)#5,593 |
| 62. | Anderson | 2.4% | 1.7%(+0.693)#62 | 5.8%(-3.41)#5,660 |
| 63. | Johnsonville | 2.3% | 1.7%(+0.678)#63 | 5.8%(-3.43)#5,684 |
| 64. | Lancaster | 2.3% | 1.7%(+0.659)#64 | 5.8%(-3.44)#5,728 |
| 65. | Columbia | 2.3% | 1.7%(+0.610)#65 | 5.8%(-3.49)#5,805 |
| 66. | Seven Oaks | 2.2% | 1.7%(+0.505)#66 | 5.8%(-3.60)#6,013 |
| 67. | St Andrews | 2.2% | 1.7%(+0.490)#67 | 5.8%(-3.61)#6,046 |
| 68. | Isle Of Palms | 2.1% | 1.7%(+0.447)#68 | 5.8%(-3.66)#6,129 |
| 69. | Charleston | 2.1% | 1.7%(+0.444)#69 | 5.8%(-3.66)#6,136 |
| 70. | Spartanburg | 2.1% | 1.7%(+0.441)#70 | 5.8%(-3.66)#6,149 |
| 71. | Aiken | 2.1% | 1.7%(+0.427)#71 | 5.8%(-3.68)#6,185 |
| 72. | Sumter | 2.1% | 1.7%(+0.412)#72 | 5.8%(-3.69)#6,218 |
| 73. | Judson | 2.0% | 1.7%(+0.353)#73 | 5.8%(-3.75)#6,318 |
| 74. | Greenville | 1.9% | 1.7%(+0.268)#74 | 5.8%(-3.84)#6,513 |
| 75. | Sans Souci | 1.9% | 1.7%(+0.258)#75 | 5.8%(-3.85)#6,530 |
| 76. | Hartsville | 1.9% | 1.7%(+0.224)#76 | 5.8%(-3.88)#6,608 |
| 77. | Clinton | 1.9% | 1.7%(+0.220)#77 | 5.8%(-3.88)#6,617 |
| 78. | Fripp Island | 1.8% | 1.7%(+0.156)#78 | 5.8%(-3.95)#6,753 |
| 79. | Forest Acres | 1.8% | 1.7%(+0.129)#79 | 5.8%(-3.98)#6,833 |
| 80. | Hodges | 1.7% | 1.7%(+0.065)#80 | 5.8%(-4.04)#6,977 |
| 81. | Pickens | 1.7% | 1.7%(+0.050)#81 | 5.8%(-4.05)#7,014 |
| 82. | Richburg | 1.7% | 1.7%(+0.026)#82 | 5.8%(-4.08)#7,082 |
| 83. | South Congaree | 1.7% | 1.7%(+0.015)#83 | 5.8%(-4.09)#7,110 |
| 84. | Northlake | 1.7% | 1.7%(+0.011)#84 | 5.8%(-4.09)#7,126 |
| 85. | Olar | 1.7% | 1.7%(+0.007)#85 | 5.8%(-4.10)#7,138 |
| 86. | Mount Pleasant | 1.7% | 1.7%(-0.012)#86 | 5.8%(-4.12)#7,182 |
| 87. | Summerville | 1.6% | 1.7%(-0.025)#87 | 5.8%(-4.13)#7,214 |
| 88. | Waterloo | 1.6% | 1.7%(-0.030)#88 | 5.8%(-4.13)#7,228 |
| 89. | Lynchburg | 1.6% | 1.7%(-0.050)#89 | 5.8%(-4.15)#7,280 |
| 90. | Port Royal | 1.6% | 1.7%(-0.063)#90 | 5.8%(-4.17)#7,318 |
| 91. | Capitol View | 1.6% | 1.7%(-0.065)#91 | 5.8%(-4.17)#7,327 |
| 92. | Arial | 1.6% | 1.7%(-0.069)#92 | 5.8%(-4.17)#7,338 |
| 93. | Clearwater | 1.6% | 1.7%(-0.082)#93 | 5.8%(-4.19)#7,381 |
| 94. | Rock Hill | 1.6% | 1.7%(-0.086)#94 | 5.8%(-4.19)#7,388 |
| 95. | Lake Wylie | 1.6% | 1.7%(-0.098)#95 | 5.8%(-4.20)#7,421 |
| 96. | Cheraw | 1.6% | 1.7%(-0.107)#96 | 5.8%(-4.21)#7,448 |
| 97. | Berea | 1.5% | 1.7%(-0.124)#97 | 5.8%(-4.23)#7,493 |
| 98. | Oak Grove | 1.5% | 1.7%(-0.132)#98 | 5.8%(-4.24)#7,523 |
| 99. | Socastee | 1.5% | 1.7%(-0.136)#99 | 5.8%(-4.24)#7,534 |
| 100. | Eutawville | 1.5% | 1.7%(-0.154)#100 | 5.8%(-4.26)#7,586 |
Common Questions
What are the Top 10 Cities with the Highest Percentage of Asian Population in South Carolina?
Top 10 Cities with the Highest Percentage of Asian Population in South Carolina are:
#1
35.3%
#2
28.8%
#3
12.6%
#4
9.4%
#5
8.6%
#6
7.5%
#7
7.3%
#8
6.5%
#9
6.4%
#10
6.4%
What city has the Highest Percentage of Asian Population in South Carolina?
Rembert has the Highest Percentage of Asian Population in South Carolina with 35.3%.
What is the Percentage of Asian Population in the State of South Carolina?
Percentage of Asian Population in South Carolina is 1.7%.
What is the Percentage of Asian Population in the United States?
Percentage of Asian Population in the United States is 5.8%.