Cities with the Highest Percentage of Asian Population in Oklahoma
RELATED REPORTS & OPTIONS
Asian
Oklahoma
Compare Cities
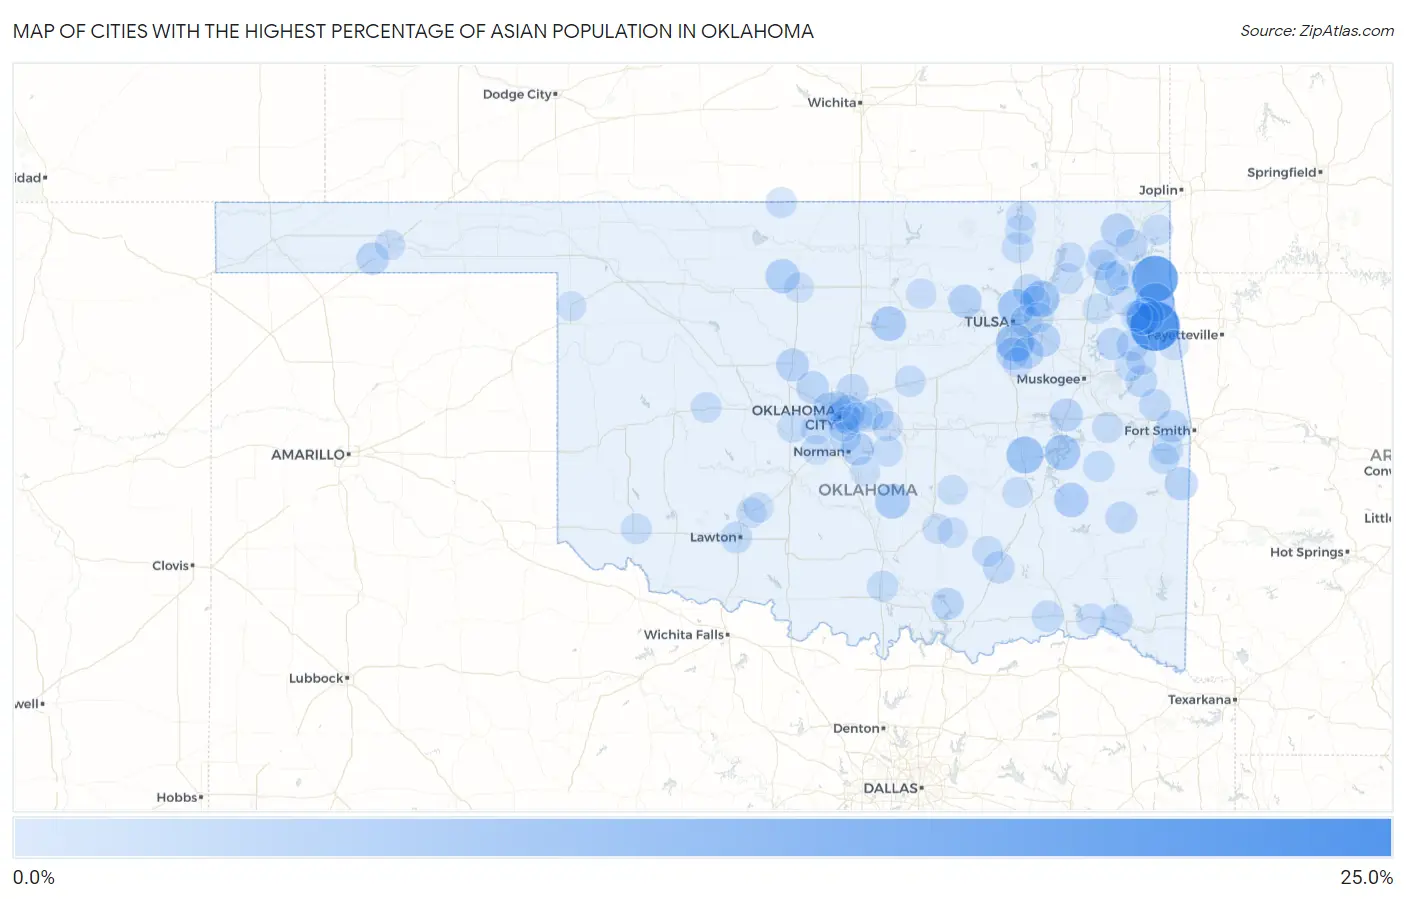
Map of Cities with the Highest Percentage of Asian Population in Oklahoma
0.0%
25.0%
Cities with the Highest Percentage of Asian Population in Oklahoma
| City | Asian | vs State | vs National | |
| 1. | Baron | 24.4% | 2.3%(+22.0)#1 | 5.8%(+18.6)#401 |
| 2. | Chewey | 22.5% | 2.3%(+20.2)#2 | 5.8%(+16.8)#441 |
| 3. | Deer Lick | 18.5% | 2.3%(+16.2)#3 | 5.8%(+12.7)#612 |
| 4. | Cloud Creek | 10.7% | 2.3%(+8.37)#4 | 5.8%(+4.91)#1,312 |
| 5. | Jenks | 9.7% | 2.3%(+7.39)#5 | 5.8%(+3.93)#1,473 |
| 6. | Twin Oaks | 9.1% | 2.3%(+6.78)#6 | 5.8%(+3.32)#1,583 |
| 7. | Hanna | 8.4% | 2.3%(+6.12)#7 | 5.8%(+2.66)#1,717 |
| 8. | Turley | 8.2% | 2.3%(+5.92)#8 | 5.8%(+2.46)#1,756 |
| 9. | Limestone | 8.1% | 2.3%(+5.79)#9 | 5.8%(+2.33)#1,787 |
| 10. | Carlton Landing | 7.0% | 2.3%(+4.67)#10 | 5.8%(+1.20)#2,101 |
| 11. | Byars | 6.3% | 2.3%(+4.00)#11 | 5.8%(+0.534)#2,341 |
| 12. | Stillwater | 6.1% | 2.3%(+3.83)#12 | 5.8%(+0.372)#2,409 |
| 13. | Gowen | 5.7% | 2.3%(+3.42)#13 | 5.8%(-0.040)#2,593 |
| 14. | Forest Park | 5.7% | 2.3%(+3.37)#14 | 5.8%(-0.097)#2,619 |
| 15. | Carrier | 5.6% | 2.3%(+3.31)#15 | 5.8%(-0.155)#2,655 |
| 16. | Pensacola | 5.5% | 2.3%(+3.14)#16 | 5.8%(-0.318)#2,739 |
| 17. | Norman | 4.7% | 2.3%(+2.35)#17 | 5.8%(-1.12)#3,187 |
| 18. | Osage | 4.6% | 2.3%(+2.29)#18 | 5.8%(-1.17)#3,234 |
| 19. | Monroe | 4.5% | 2.3%(+2.24)#19 | 5.8%(-1.23)#3,274 |
| 20. | Oklahoma City | 4.5% | 2.3%(+2.22)#20 | 5.8%(-1.25)#3,284 |
| 21. | Broken Arrow | 4.5% | 2.3%(+2.20)#21 | 5.8%(-1.26)#3,293 |
| 22. | Bluejacket | 4.4% | 2.3%(+2.12)#22 | 5.8%(-1.34)#3,363 |
| 23. | Kingfisher | 4.3% | 2.3%(+2.02)#23 | 5.8%(-1.45)#3,419 |
| 24. | Checotah | 4.3% | 2.3%(+1.99)#24 | 5.8%(-1.47)#3,449 |
| 25. | Whippoorwill | 4.3% | 2.3%(+1.95)#25 | 5.8%(-1.52)#3,494 |
| 26. | Piedmont | 4.0% | 2.3%(+1.70)#26 | 5.8%(-1.76)#3,682 |
| 27. | Oaks | 4.0% | 2.3%(+1.66)#27 | 5.8%(-1.80)#3,716 |
| 28. | Glenpool | 3.8% | 2.3%(+1.52)#28 | 5.8%(-1.94)#3,839 |
| 29. | Goodwell | 3.8% | 2.3%(+1.47)#29 | 5.8%(-2.00)#3,878 |
| 30. | Warr Acres | 3.7% | 2.3%(+1.40)#30 | 5.8%(-2.06)#3,933 |
| 31. | Bixby | 3.6% | 2.3%(+1.32)#31 | 5.8%(-2.14)#4,014 |
| 32. | Muldrow | 3.6% | 2.3%(+1.24)#32 | 5.8%(-2.22)#4,091 |
| 33. | Lost City | 3.5% | 2.3%(+1.20)#33 | 5.8%(-2.26)#4,124 |
| 34. | Afton | 3.5% | 2.3%(+1.16)#34 | 5.8%(-2.31)#4,178 |
| 35. | Bee | 3.4% | 2.3%(+1.14)#35 | 5.8%(-2.32)#4,203 |
| 36. | Brushy | 3.4% | 2.3%(+1.08)#36 | 5.8%(-2.38)#4,259 |
| 37. | Tulsa | 3.4% | 2.3%(+1.06)#37 | 5.8%(-2.40)#4,282 |
| 38. | Harrah | 3.4% | 2.3%(+1.06)#38 | 5.8%(-2.40)#4,284 |
| 39. | Dry Creek | 3.3% | 2.3%(+0.946)#39 | 5.8%(-2.52)#4,402 |
| 40. | Talihina | 3.2% | 2.3%(+0.908)#40 | 5.8%(-2.55)#4,461 |
| 41. | Collinsville | 3.2% | 2.3%(+0.898)#41 | 5.8%(-2.56)#4,478 |
| 42. | Valliant | 3.2% | 2.3%(+0.884)#42 | 5.8%(-2.58)#4,489 |
| 43. | Edmond | 3.2% | 2.3%(+0.856)#43 | 5.8%(-2.61)#4,527 |
| 44. | Atoka | 3.2% | 2.3%(+0.855)#44 | 5.8%(-2.61)#4,528 |
| 45. | Steely Hollow | 3.1% | 2.3%(+0.791)#45 | 5.8%(-2.67)#4,605 |
| 46. | Moore | 3.0% | 2.3%(+0.710)#46 | 5.8%(-2.75)#4,717 |
| 47. | Spiro | 2.9% | 2.3%(+0.554)#47 | 5.8%(-2.91)#4,922 |
| 48. | Soper | 2.9% | 2.3%(+0.547)#48 | 5.8%(-2.92)#4,930 |
| 49. | Lawton | 2.8% | 2.3%(+0.483)#49 | 5.8%(-2.98)#5,031 |
| 50. | Bartlesville | 2.5% | 2.3%(+0.206)#50 | 5.8%(-3.26)#5,403 |
| 51. | Kinta | 2.5% | 2.3%(+0.199)#51 | 5.8%(-3.26)#5,418 |
| 52. | Mustang | 2.4% | 2.3%(+0.127)#52 | 5.8%(-3.34)#5,527 |
| 53. | Chandler | 2.4% | 2.3%(+0.081)#53 | 5.8%(-3.38)#5,608 |
| 54. | Ardmore | 2.3% | 2.3%(-0.006)#54 | 5.8%(-3.47)#5,767 |
| 55. | Big Cabin | 2.3% | 2.3%(-0.037)#55 | 5.8%(-3.50)#5,820 |
| 56. | Choctaw | 2.3% | 2.3%(-0.039)#56 | 5.8%(-3.50)#5,821 |
| 57. | Panama | 2.3% | 2.3%(-0.041)#57 | 5.8%(-3.50)#5,824 |
| 58. | Leach | 2.2% | 2.3%(-0.088)#58 | 5.8%(-3.55)#5,920 |
| 59. | Owasso | 2.2% | 2.3%(-0.092)#59 | 5.8%(-3.55)#5,931 |
| 60. | Bushyhead | 2.2% | 2.3%(-0.094)#60 | 5.8%(-3.56)#5,933 |
| 61. | Manchester | 2.2% | 2.3%(-0.120)#61 | 5.8%(-3.58)#5,981 |
| 62. | Simms | 2.2% | 2.3%(-0.145)#62 | 5.8%(-3.61)#6,029 |
| 63. | Phillips | 2.1% | 2.3%(-0.205)#63 | 5.8%(-3.67)#6,163 |
| 64. | Pink | 2.0% | 2.3%(-0.281)#64 | 5.8%(-3.74)#6,311 |
| 65. | Altus | 2.0% | 2.3%(-0.301)#65 | 5.8%(-3.76)#6,352 |
| 66. | Valley Brook | 2.0% | 2.3%(-0.325)#66 | 5.8%(-3.79)#6,413 |
| 67. | Cottonwood | 2.0% | 2.3%(-0.330)#67 | 5.8%(-3.79)#6,429 |
| 68. | Wyandotte | 2.0% | 2.3%(-0.334)#68 | 5.8%(-3.80)#6,437 |
| 69. | Union City | 2.0% | 2.3%(-0.349)#69 | 5.8%(-3.81)#6,467 |
| 70. | Arpelar | 1.9% | 2.3%(-0.405)#70 | 5.8%(-3.87)#6,582 |
| 71. | Weatherford | 1.9% | 2.3%(-0.427)#71 | 5.8%(-3.89)#6,630 |
| 72. | Mcloud | 1.8% | 2.3%(-0.489)#72 | 5.8%(-3.95)#6,765 |
| 73. | Del City | 1.8% | 2.3%(-0.502)#73 | 5.8%(-3.96)#6,804 |
| 74. | Vinita | 1.8% | 2.3%(-0.505)#74 | 5.8%(-3.97)#6,812 |
| 75. | Park Hill | 1.8% | 2.3%(-0.554)#75 | 5.8%(-4.02)#6,922 |
| 76. | Langley | 1.8% | 2.3%(-0.559)#76 | 5.8%(-4.02)#6,933 |
| 77. | Ada | 1.7% | 2.3%(-0.575)#77 | 5.8%(-4.04)#6,974 |
| 78. | Westville | 1.7% | 2.3%(-0.635)#78 | 5.8%(-4.10)#7,140 |
| 79. | Pawnee | 1.7% | 2.3%(-0.651)#79 | 5.8%(-4.11)#7,181 |
| 80. | Fort Towson | 1.6% | 2.3%(-0.668)#80 | 5.8%(-4.13)#7,220 |
| 81. | Stonewall | 1.6% | 2.3%(-0.675)#81 | 5.8%(-4.14)#7,242 |
| 82. | Guymon | 1.6% | 2.3%(-0.701)#82 | 5.8%(-4.16)#7,306 |
| 83. | Elgin | 1.6% | 2.3%(-0.738)#83 | 5.8%(-4.20)#7,418 |
| 84. | Welling | 1.6% | 2.3%(-0.743)#84 | 5.8%(-4.21)#7,438 |
| 85. | Sasakwa | 1.6% | 2.3%(-0.748)#85 | 5.8%(-4.21)#7,452 |
| 86. | New Alluwe | 1.6% | 2.3%(-0.748)#86 | 5.8%(-4.21)#7,453 |
| 87. | Nichols Hills | 1.5% | 2.3%(-0.779)#87 | 5.8%(-4.24)#7,537 |
| 88. | Sportsmen Acres | 1.5% | 2.3%(-0.788)#88 | 5.8%(-4.25)#7,557 |
| 89. | Liberty | 1.5% | 2.3%(-0.795)#89 | 5.8%(-4.26)#7,587 |
| 90. | Enid | 1.5% | 2.3%(-0.829)#90 | 5.8%(-4.29)#7,692 |
| 91. | Midwest City | 1.5% | 2.3%(-0.855)#91 | 5.8%(-4.32)#7,775 |
| 92. | Catoosa | 1.4% | 2.3%(-0.865)#92 | 5.8%(-4.33)#7,802 |
| 93. | Canadian Shores | 1.4% | 2.3%(-0.887)#93 | 5.8%(-4.35)#7,873 |
| 94. | Slaughterville | 1.4% | 2.3%(-0.925)#94 | 5.8%(-4.39)#7,985 |
| 95. | Bridge Creek | 1.4% | 2.3%(-0.946)#95 | 5.8%(-4.41)#8,049 |
| 96. | Dewey | 1.4% | 2.3%(-0.949)#96 | 5.8%(-4.41)#8,060 |
| 97. | Copan | 1.4% | 2.3%(-0.956)#97 | 5.8%(-4.42)#8,079 |
| 98. | Shattuck | 1.3% | 2.3%(-0.963)#98 | 5.8%(-4.43)#8,109 |
| 99. | Kenwood | 1.3% | 2.3%(-0.981)#99 | 5.8%(-4.44)#8,167 |
| 100. | Fletcher | 1.3% | 2.3%(-1.00)#100 | 5.8%(-4.47)#8,243 |
Common Questions
What are the Top 10 Cities with the Highest Percentage of Asian Population in Oklahoma?
Top 10 Cities with the Highest Percentage of Asian Population in Oklahoma are:
#1
22.5%
#2
18.5%
#3
10.7%
#4
9.7%
#5
9.1%
#6
8.4%
#7
8.2%
#8
8.1%
#9
7.0%
#10
6.3%
What city has the Highest Percentage of Asian Population in Oklahoma?
Chewey has the Highest Percentage of Asian Population in Oklahoma with 22.5%.
What is the Percentage of Asian Population in the State of Oklahoma?
Percentage of Asian Population in Oklahoma is 2.3%.
What is the Percentage of Asian Population in the United States?
Percentage of Asian Population in the United States is 5.8%.