Fort Lee borough, NJ Map & Demographics
Fort Lee borough Overview
$62,802
PER CAPITA INCOME
$127,906
AVG FAMILY INCOME
$101,573
AVG HOUSEHOLD INCOME
27.4%
WAGE / INCOME GAP [ % ]
72.6¢/ $1
WAGE / INCOME GAP [ $ ]
0.47
INEQUALITY / GINI INDEX
39,799
TOTAL POPULATION
19,356
MALE POPULATION
20,443
FEMALE POPULATION
94.68
MALES / 100 FEMALES
105.62
FEMALES / 100 MALES
46.6
MEDIAN AGE
2.9
AVG FAMILY SIZE
2.2
AVG HOUSEHOLD SIZE
20,909
LABOR FORCE [ PEOPLE ]
62.1%
PERCENT IN LABOR FORCE
4.8%
UNEMPLOYMENT RATE
Income in Fort Lee borough
Income Overview in Fort Lee borough
Per Capita Income in Fort Lee borough is $62,802, while median incomes of families and households are $127,906 and $101,573 respectively.
| Characteristic | Number | Measure |
| Per Capita Income | 39,799 | $62,802 |
| Median Family Income | 10,311 | $127,906 |
| Mean Family Income | 10,311 | $163,711 |
| Median Household Income | 18,312 | $101,573 |
| Mean Household Income | 18,312 | $135,109 |
| Income Deficit | 10,311 | $0 |
| Wage / Income Gap (%) | 39,799 | 27.37% |
| Wage / Income Gap ($) | 39,799 | 72.63¢ per $1 |
| Gini / Inequality Index | 39,799 | 0.47 |
Earnings by Sex in Fort Lee borough
Average Earnings in Fort Lee borough are $69,088, $79,305 for men and $57,598 for women, a difference of 27.4%.
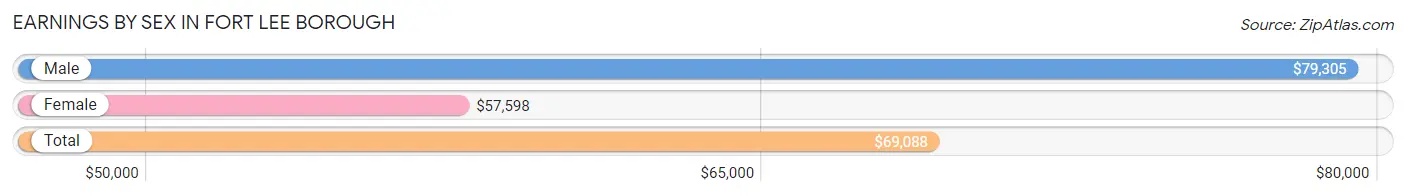
| Sex | Number | Average Earnings |
| Male | 11,500 (54.1%) | $79,305 |
| Female | 9,758 (45.9%) | $57,598 |
| Total | 21,258 (100.0%) | $69,088 |
Earnings by Sex by Income Bracket in Fort Lee borough
The most common earnings brackets in Fort Lee borough are $100,000+ for men (4,383 | 38.1%) and $100,000+ for women (2,343 | 24.0%).
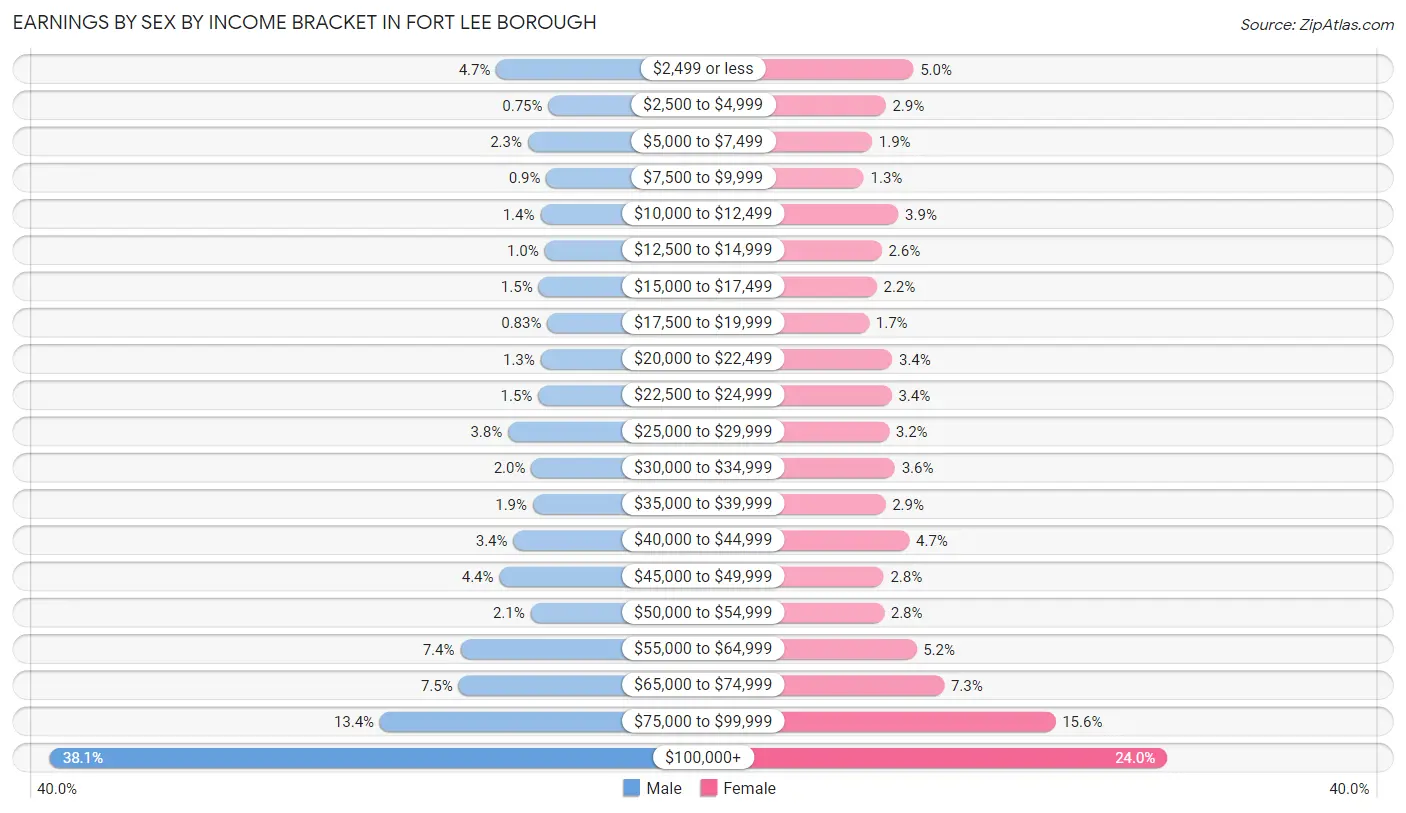
| Income | Male | Female |
| $2,499 or less | 535 (4.6%) | 486 (5.0%) |
| $2,500 to $4,999 | 86 (0.7%) | 283 (2.9%) |
| $5,000 to $7,499 | 263 (2.3%) | 183 (1.9%) |
| $7,500 to $9,999 | 103 (0.9%) | 123 (1.3%) |
| $10,000 to $12,499 | 155 (1.3%) | 376 (3.8%) |
| $12,500 to $14,999 | 118 (1.0%) | 254 (2.6%) |
| $15,000 to $17,499 | 171 (1.5%) | 218 (2.2%) |
| $17,500 to $19,999 | 96 (0.8%) | 161 (1.7%) |
| $20,000 to $22,499 | 153 (1.3%) | 331 (3.4%) |
| $22,500 to $24,999 | 174 (1.5%) | 327 (3.4%) |
| $25,000 to $29,999 | 433 (3.8%) | 307 (3.2%) |
| $30,000 to $34,999 | 234 (2.0%) | 350 (3.6%) |
| $35,000 to $39,999 | 220 (1.9%) | 281 (2.9%) |
| $40,000 to $44,999 | 387 (3.4%) | 456 (4.7%) |
| $45,000 to $49,999 | 508 (4.4%) | 268 (2.8%) |
| $50,000 to $54,999 | 239 (2.1%) | 270 (2.8%) |
| $55,000 to $64,999 | 845 (7.3%) | 507 (5.2%) |
| $65,000 to $74,999 | 860 (7.5%) | 710 (7.3%) |
| $75,000 to $99,999 | 1,537 (13.4%) | 1,524 (15.6%) |
| $100,000+ | 4,383 (38.1%) | 2,343 (24.0%) |
| Total | 11,500 (100.0%) | 9,758 (100.0%) |
Earnings by Sex by Educational Attainment in Fort Lee borough
Average earnings in Fort Lee borough are $83,665 for men and $62,568 for women, a difference of 25.2%. Men with an educational attainment of graduate degree enjoy the highest average annual earnings of $111,004, while those with less than high school education earn the least with $41,744. Women with an educational attainment of graduate degree earn the most with the average annual earnings of $76,250, while those with less than high school education have the smallest earnings of $12,143.
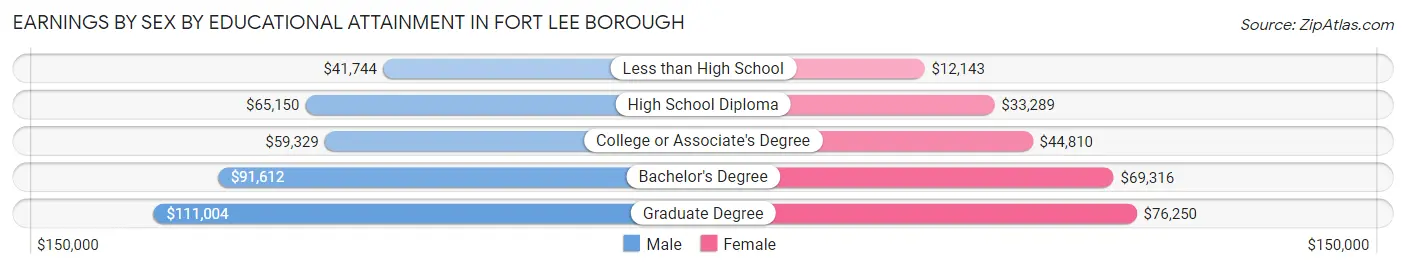
| Educational Attainment | Male Income | Female Income |
| Less than High School | $41,744 | $12,143 |
| High School Diploma | $65,150 | $33,289 |
| College or Associate's Degree | $59,329 | $44,810 |
| Bachelor's Degree | $91,612 | $69,316 |
| Graduate Degree | $111,004 | $76,250 |
| Total | $83,665 | $62,568 |
Family Income in Fort Lee borough
Family Income Brackets in Fort Lee borough
According to the Fort Lee borough family income data, there are 2,671 families falling into the $200,000+ income range, which is the most common income bracket and makes up 25.9% of all families. Conversely, the $10,000 to $14,999 income bracket is the least frequent group with only 62 families (0.6%) belonging to this category.
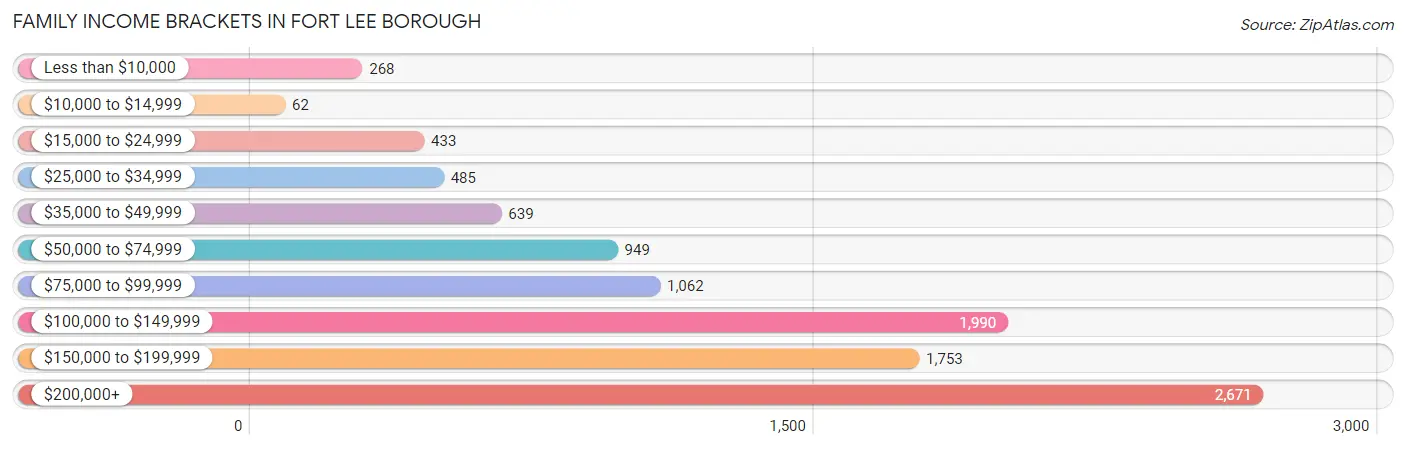
| Income Bracket | # Families | % Families |
| Less than $10,000 | 268 | 2.6% |
| $10,000 to $14,999 | 62 | 0.6% |
| $15,000 to $24,999 | 433 | 4.2% |
| $25,000 to $34,999 | 485 | 4.7% |
| $35,000 to $49,999 | 639 | 6.2% |
| $50,000 to $74,999 | 949 | 9.2% |
| $75,000 to $99,999 | 1,062 | 10.3% |
| $100,000 to $149,999 | 1,990 | 19.3% |
| $150,000 to $199,999 | 1,753 | 17.0% |
| $200,000+ | 2,671 | 25.9% |
Family Income by Famaliy Size in Fort Lee borough
7+ person families (40 | 0.4%) account for the highest median family income in Fort Lee borough with $215,921 per family, while 2-person families (5,056 | 49.0%) have the highest median income of $58,308 per family member.
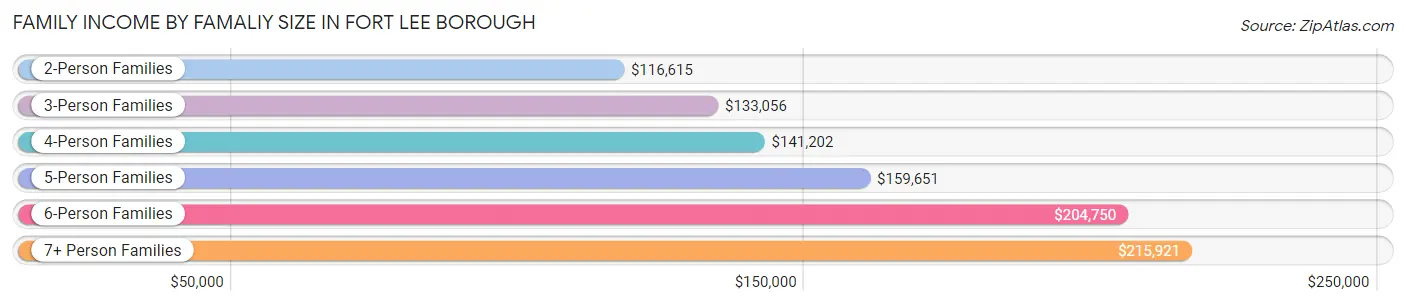
| Income Bracket | # Families | Median Income |
| 2-Person Families | 5,056 (49.0%) | $116,615 |
| 3-Person Families | 2,524 (24.5%) | $133,056 |
| 4-Person Families | 1,993 (19.3%) | $141,202 |
| 5-Person Families | 466 (4.5%) | $159,651 |
| 6-Person Families | 232 (2.2%) | $204,750 |
| 7+ Person Families | 40 (0.4%) | $215,921 |
| Total | 10,311 (100.0%) | $127,906 |
Family Income by Number of Earners in Fort Lee borough
The median family income in Fort Lee borough is $127,906, with families comprising 3+ earners (915) having the highest median family income of $189,479, while families with no earners (1,340) have the lowest median family income of $77,000, accounting for 8.9% and 13.0% of families, respectively.
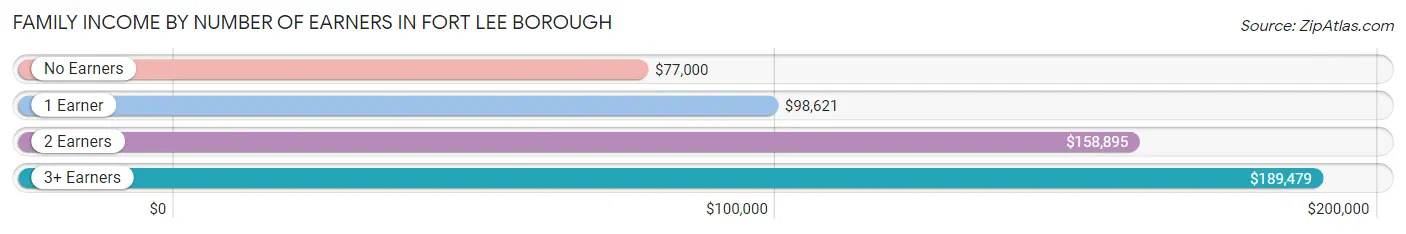
| Number of Earners | # Families | Median Income |
| No Earners | 1,340 (13.0%) | $77,000 |
| 1 Earner | 3,596 (34.9%) | $98,621 |
| 2 Earners | 4,460 (43.2%) | $158,895 |
| 3+ Earners | 915 (8.9%) | $189,479 |
| Total | 10,311 (100.0%) | $127,906 |
Household Income in Fort Lee borough
Household Income Brackets in Fort Lee borough
With 3,534 households falling in the category, the $100,000 to $149,999 income range is the most frequent in Fort Lee borough, accounting for 19.3% of all households. In contrast, only 549 households (3.0%) fall into the $10,000 to $14,999 income bracket, making it the least populous group.
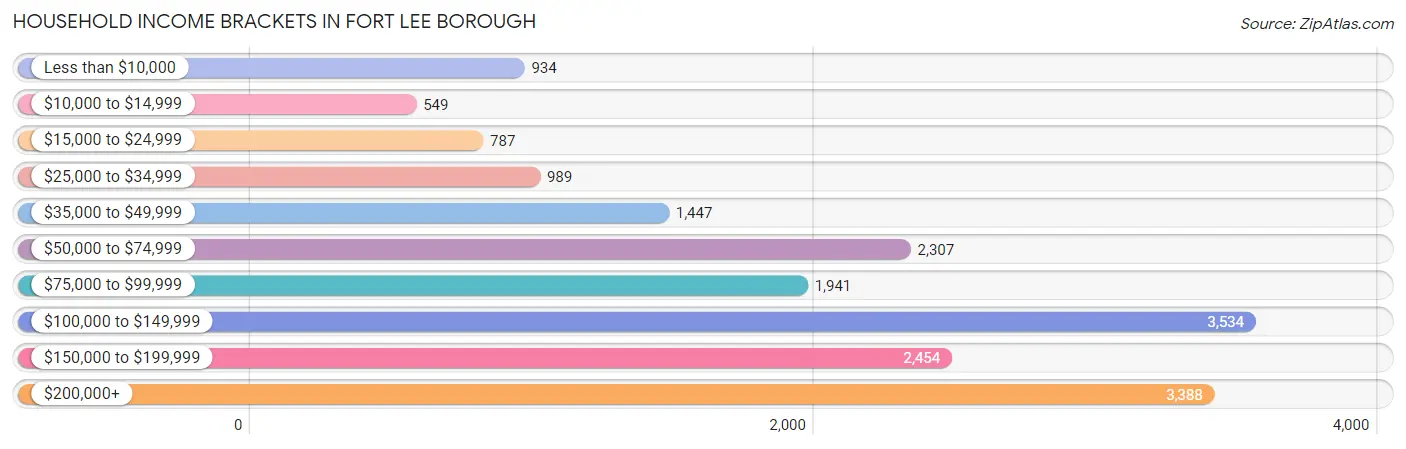
| Income Bracket | # Households | % Households |
| Less than $10,000 | 934 | 5.1% |
| $10,000 to $14,999 | 549 | 3.0% |
| $15,000 to $24,999 | 787 | 4.3% |
| $25,000 to $34,999 | 989 | 5.4% |
| $35,000 to $49,999 | 1,447 | 7.9% |
| $50,000 to $74,999 | 2,307 | 12.6% |
| $75,000 to $99,999 | 1,941 | 10.6% |
| $100,000 to $149,999 | 3,534 | 19.3% |
| $150,000 to $199,999 | 2,454 | 13.4% |
| $200,000+ | 3,388 | 18.5% |
Household Income by Householder Age in Fort Lee borough
The median household income in Fort Lee borough is $101,573, with the highest median household income of $119,718 found in the 25 to 44 years age bracket for the primary householder. A total of 5,359 households (29.3%) fall into this category. Meanwhile, the 15 to 24 years age bracket for the primary householder has the lowest median household income of $36,708, with 149 households (0.8%) in this group.
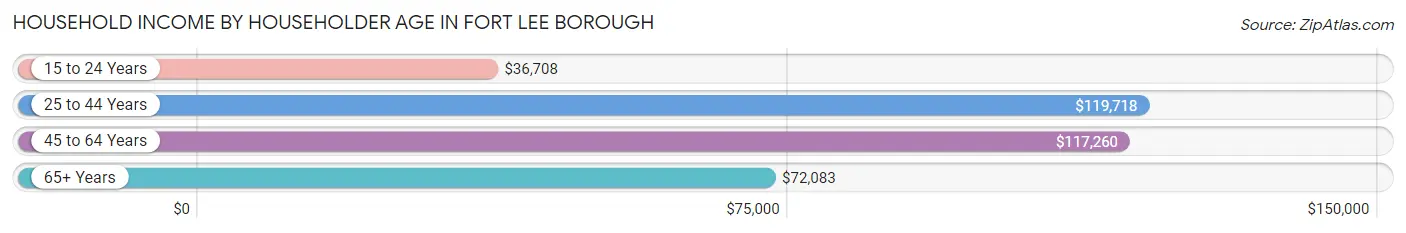
| Income Bracket | # Households | Median Income |
| 15 to 24 Years | 149 (0.8%) | $36,708 |
| 25 to 44 Years | 5,359 (29.3%) | $119,718 |
| 45 to 64 Years | 6,401 (35.0%) | $117,260 |
| 65+ Years | 6,403 (35.0%) | $72,083 |
| Total | 18,312 (100.0%) | $101,573 |
Poverty in Fort Lee borough
Income Below Poverty by Sex and Age in Fort Lee borough
With 7.0% poverty level for males and 9.4% for females among the residents of Fort Lee borough, 15 year old males and 15 year old females are the most vulnerable to poverty, with 43 males (31.6%) and 45 females (25.4%) in their respective age groups living below the poverty level.
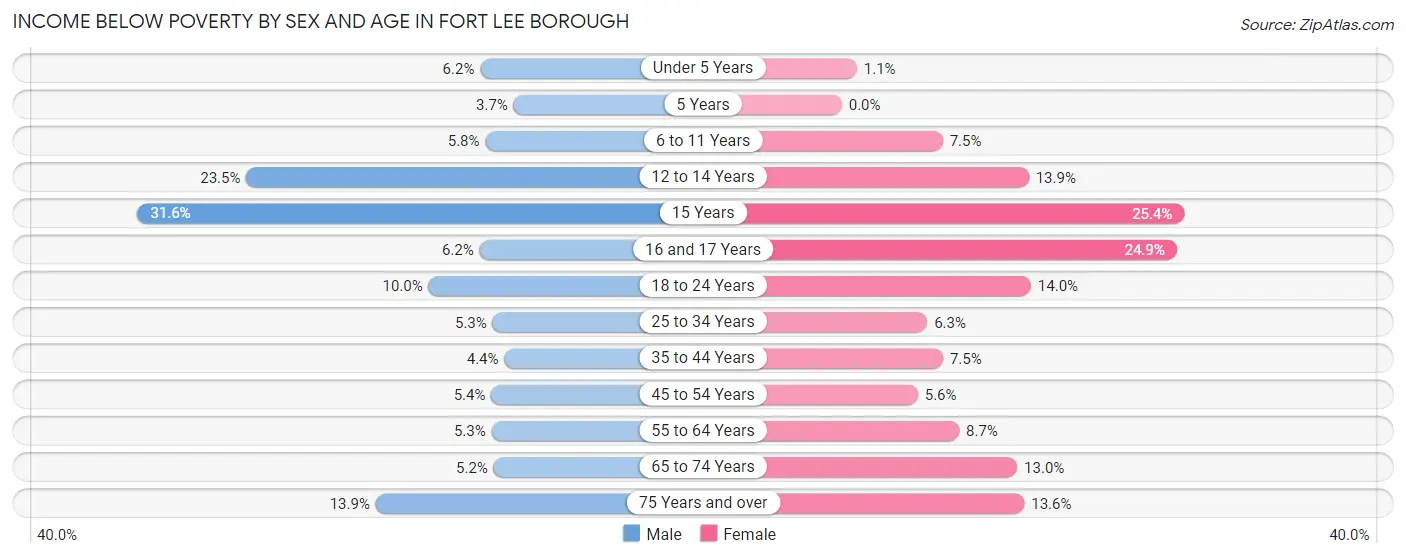
| Age Bracket | Male | Female |
| Under 5 Years | 70 (6.2%) | 12 (1.1%) |
| 5 Years | 8 (3.7%) | 0 (0.0%) |
| 6 to 11 Years | 71 (5.8%) | 87 (7.5%) |
| 12 to 14 Years | 117 (23.5%) | 54 (13.9%) |
| 15 Years | 43 (31.6%) | 45 (25.4%) |
| 16 and 17 Years | 26 (6.2%) | 96 (24.9%) |
| 18 to 24 Years | 104 (10.0%) | 97 (14.0%) |
| 25 to 34 Years | 109 (5.2%) | 138 (6.3%) |
| 35 to 44 Years | 132 (4.4%) | 230 (7.5%) |
| 45 to 54 Years | 154 (5.3%) | 157 (5.6%) |
| 55 to 64 Years | 137 (5.3%) | 230 (8.7%) |
| 65 to 74 Years | 112 (5.2%) | 313 (13.0%) |
| 75 Years and over | 272 (13.9%) | 462 (13.6%) |
| Total | 1,355 (7.0%) | 1,921 (9.4%) |
Income Above Poverty by Sex and Age in Fort Lee borough
According to the poverty statistics in Fort Lee borough, males aged 5 years and females aged 5 years are the age groups that are most secure financially, with 96.3% of males and 100.0% of females in these age groups living above the poverty line.
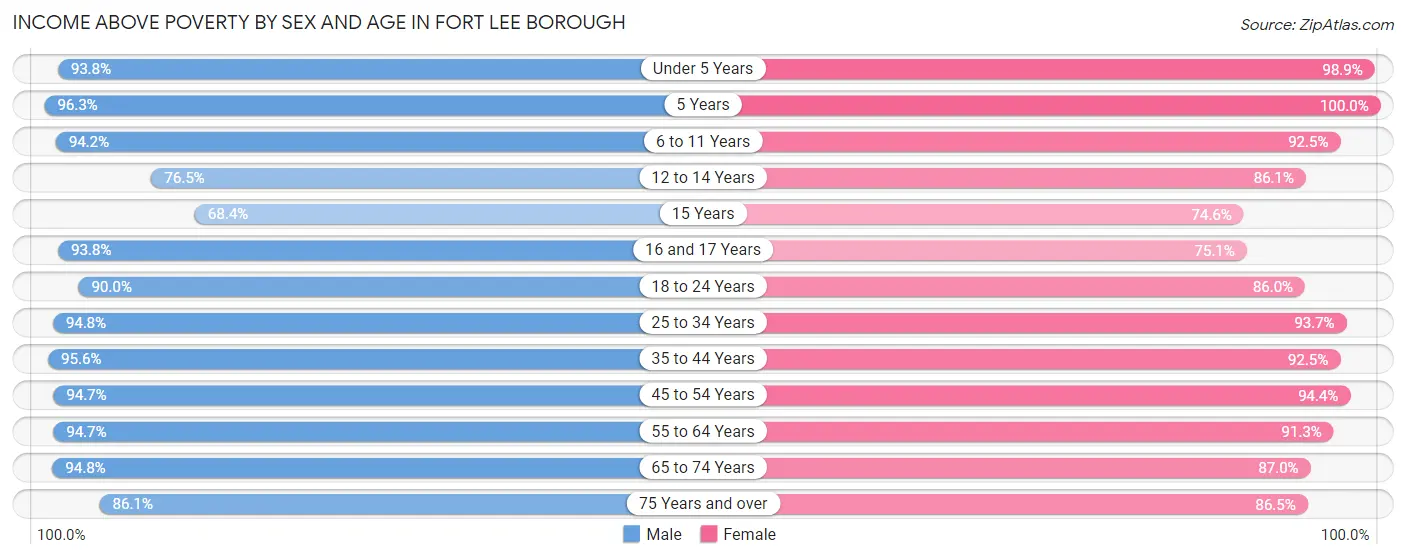
| Age Bracket | Male | Female |
| Under 5 Years | 1,064 (93.8%) | 1,057 (98.9%) |
| 5 Years | 209 (96.3%) | 92 (100.0%) |
| 6 to 11 Years | 1,156 (94.2%) | 1,074 (92.5%) |
| 12 to 14 Years | 380 (76.5%) | 335 (86.1%) |
| 15 Years | 93 (68.4%) | 132 (74.6%) |
| 16 and 17 Years | 392 (93.8%) | 290 (75.1%) |
| 18 to 24 Years | 935 (90.0%) | 594 (86.0%) |
| 25 to 34 Years | 1,967 (94.8%) | 2,039 (93.7%) |
| 35 to 44 Years | 2,885 (95.6%) | 2,832 (92.5%) |
| 45 to 54 Years | 2,722 (94.7%) | 2,626 (94.4%) |
| 55 to 64 Years | 2,434 (94.7%) | 2,412 (91.3%) |
| 65 to 74 Years | 2,054 (94.8%) | 2,091 (87.0%) |
| 75 Years and over | 1,681 (86.1%) | 2,947 (86.5%) |
| Total | 17,972 (93.0%) | 18,521 (90.6%) |
Income Below Poverty Among Married-Couple Families in Fort Lee borough
The poverty statistics for married-couple families in Fort Lee borough show that 4.9% or 412 of the total 8,449 families live below the poverty line. Families with 1 or 2 children have the highest poverty rate of 6.5%, comprising of 191 families. On the other hand, families with 5 or more children have the lowest poverty rate of 0.0%, which includes 0 families.
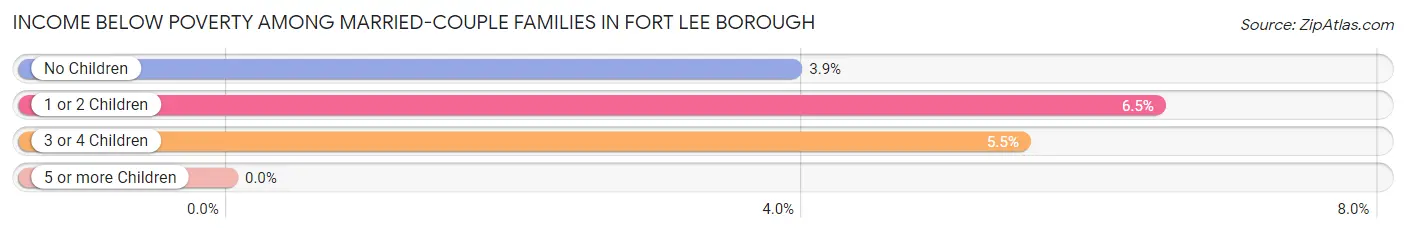
| Children | Above Poverty | Below Poverty |
| No Children | 4,934 (96.1%) | 202 (3.9%) |
| 1 or 2 Children | 2,765 (93.5%) | 191 (6.5%) |
| 3 or 4 Children | 325 (94.5%) | 19 (5.5%) |
| 5 or more Children | 13 (100.0%) | 0 (0.0%) |
| Total | 8,037 (95.1%) | 412 (4.9%) |
Income Below Poverty Among Single-Parent Households in Fort Lee borough
According to the poverty data in Fort Lee borough, 1.9% or 9 single-father households and 11.9% or 165 single-mother households are living below the poverty line. Among single-father households, those with 1 or 2 children have the highest poverty rate, with 9 households (4.6%) experiencing poverty. Likewise, among single-mother households, those with 5 or more children have the highest poverty rate, with 20 households (100.0%) falling below the poverty line.
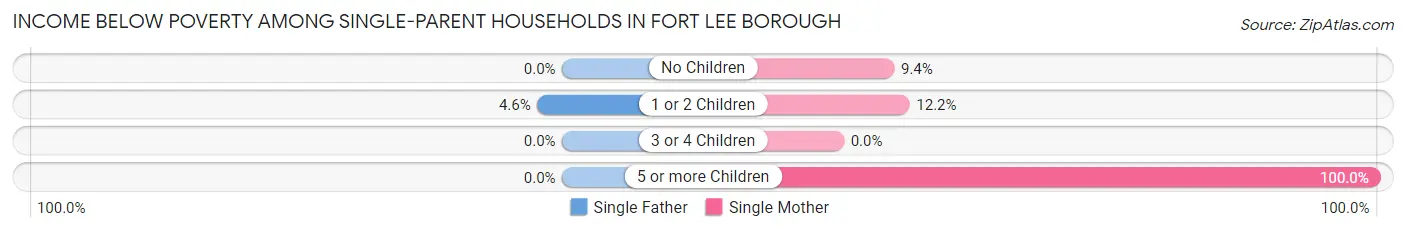
| Children | Single Father | Single Mother |
| No Children | 0 (0.0%) | 64 (9.4%) |
| 1 or 2 Children | 9 (4.6%) | 81 (12.2%) |
| 3 or 4 Children | 0 (0.0%) | 0 (0.0%) |
| 5 or more Children | 0 (0.0%) | 20 (100.0%) |
| Total | 9 (1.9%) | 165 (11.9%) |
Income Below Poverty Among Married-Couple vs Single-Parent Households in Fort Lee borough
The poverty data for Fort Lee borough shows that 412 of the married-couple family households (4.9%) and 174 of the single-parent households (9.3%) are living below the poverty level. Within the married-couple family households, those with 1 or 2 children have the highest poverty rate, with 191 households (6.5%) falling below the poverty line. Among the single-parent households, those with 5 or more children have the highest poverty rate, with 20 household (100.0%) living below poverty.
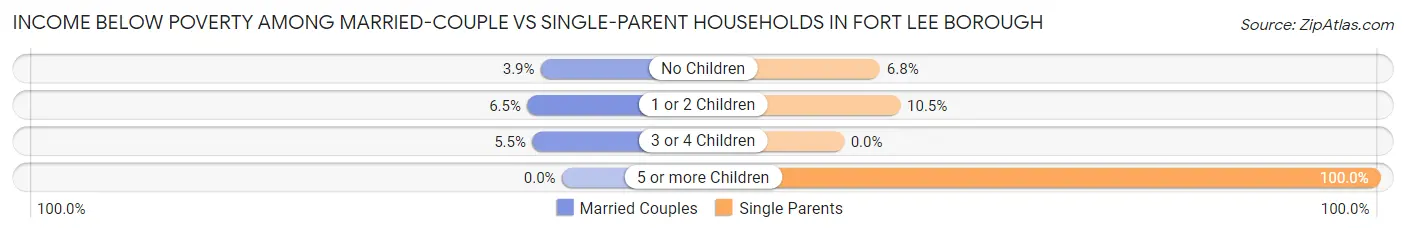
| Children | Married-Couple Families | Single-Parent Households |
| No Children | 202 (3.9%) | 64 (6.8%) |
| 1 or 2 Children | 191 (6.5%) | 90 (10.5%) |
| 3 or 4 Children | 19 (5.5%) | 0 (0.0%) |
| 5 or more Children | 0 (0.0%) | 20 (100.0%) |
| Total | 412 (4.9%) | 174 (9.3%) |
Race in Fort Lee borough
The most populous races in Fort Lee borough are Asian (17,422 | 43.8%), White / Caucasian (17,180 | 43.2%), and Hispanic or Latino (5,119 | 12.9%).
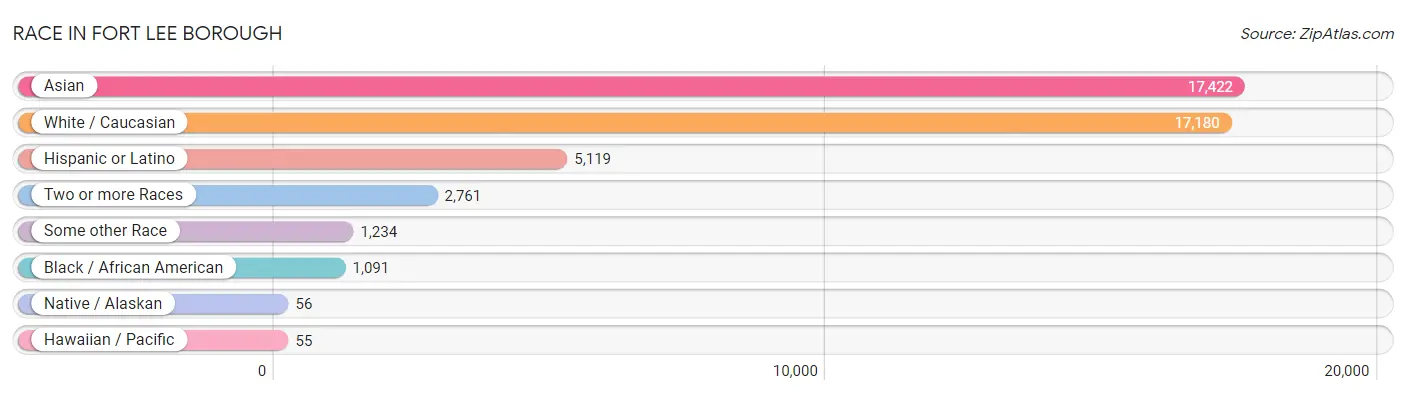
| Race | # Population | % Population |
| Asian | 17,422 | 43.8% |
| Black / African American | 1,091 | 2.7% |
| Hawaiian / Pacific | 55 | 0.1% |
| Hispanic or Latino | 5,119 | 12.9% |
| Native / Alaskan | 56 | 0.1% |
| White / Caucasian | 17,180 | 43.2% |
| Two or more Races | 2,761 | 6.9% |
| Some other Race | 1,234 | 3.1% |
| Total | 39,799 | 100.0% |
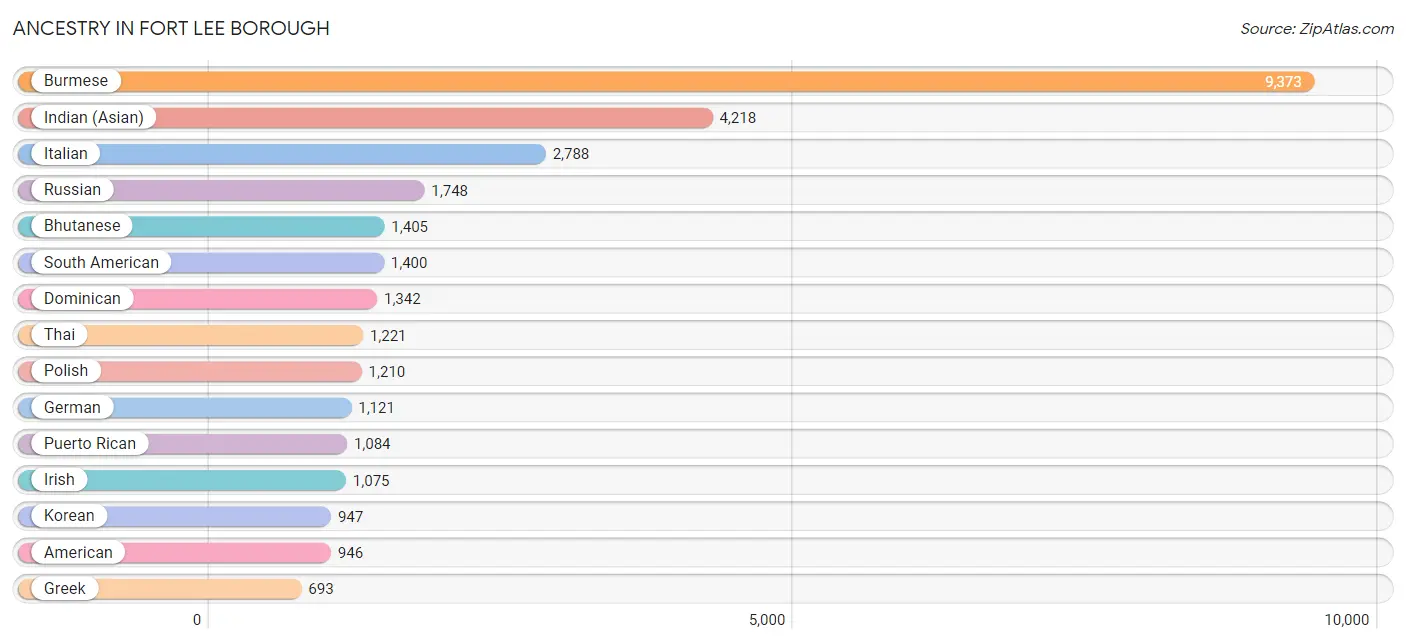
Ancestry in Fort Lee borough
The most populous ancestries reported in Fort Lee borough are Burmese (9,373 | 23.5%), Indian (Asian) (4,218 | 10.6%), Italian (2,788 | 7.0%), Russian (1,748 | 4.4%), and Bhutanese (1,405 | 3.5%), together accounting for 49.1% of all Fort Lee borough residents.
| Ancestry | # Population | % Population |
| African | 49 | 0.1% |
| Albanian | 137 | 0.3% |
| American | 946 | 2.4% |
| Apache | 14 | 0.0% |
| Arab | 663 | 1.7% |
| Argentinean | 201 | 0.5% |
| Armenian | 664 | 1.7% |
| Austrian | 171 | 0.4% |
| Bhutanese | 1,405 | 3.5% |
| Brazilian | 175 | 0.4% |
| British | 76 | 0.2% |
| British West Indian | 5 | 0.0% |
| Bulgarian | 33 | 0.1% |
| Burmese | 9,373 | 23.5% |
| Canadian | 5 | 0.0% |
| Central American | 441 | 1.1% |
| Cherokee | 118 | 0.3% |
| Chilean | 36 | 0.1% |
| Choctaw | 23 | 0.1% |
| Colombian | 689 | 1.7% |
| Costa Rican | 15 | 0.0% |
| Croatian | 145 | 0.4% |
| Cuban | 347 | 0.9% |
| Cypriot | 9 | 0.0% |
| Czech | 11 | 0.0% |
| Czechoslovakian | 11 | 0.0% |
| Danish | 85 | 0.2% |
| Delaware | 12 | 0.0% |
| Dominican | 1,342 | 3.4% |
| Dutch | 30 | 0.1% |
| Eastern European | 446 | 1.1% |
| Ecuadorian | 301 | 0.8% |
| Egyptian | 176 | 0.4% |
| English | 656 | 1.7% |
| European | 390 | 1.0% |
| Filipino | 326 | 0.8% |
| French | 184 | 0.5% |
| French Canadian | 27 | 0.1% |
| German | 1,121 | 2.8% |
| Greek | 693 | 1.7% |
| Guamanian / Chamorro | 10 | 0.0% |
| Guatemalan | 201 | 0.5% |
| Guyanese | 20 | 0.1% |
| Haitian | 19 | 0.1% |
| Honduran | 11 | 0.0% |
| Hopi | 13 | 0.0% |
| Hungarian | 165 | 0.4% |
| Indian (Asian) | 4,218 | 10.6% |
| Iranian | 91 | 0.2% |
| Iraqi | 23 | 0.1% |
| Irish | 1,075 | 2.7% |
| Israeli | 101 | 0.3% |
| Italian | 2,788 | 7.0% |
| Jamaican | 172 | 0.4% |
| Jordanian | 103 | 0.3% |
| Korean | 947 | 2.4% |
| Laotian | 82 | 0.2% |
| Latvian | 7 | 0.0% |
| Lebanese | 73 | 0.2% |
| Lithuanian | 11 | 0.0% |
| Macedonian | 6 | 0.0% |
| Mexican | 142 | 0.4% |
| Mongolian | 142 | 0.4% |
| Moroccan | 183 | 0.5% |
| Native Hawaiian | 30 | 0.1% |
| Navajo | 13 | 0.0% |
| Nicaraguan | 62 | 0.2% |
| Northern European | 14 | 0.0% |
| Norwegian | 62 | 0.2% |
| Okinawan | 16 | 0.0% |
| Ottawa | 4 | 0.0% |
| Pakistani | 11 | 0.0% |
| Panamanian | 7 | 0.0% |
| Paraguayan | 16 | 0.0% |
| Peruvian | 88 | 0.2% |
| Polish | 1,210 | 3.0% |
| Portuguese | 83 | 0.2% |
| Puerto Rican | 1,084 | 2.7% |
| Romanian | 305 | 0.8% |
| Russian | 1,748 | 4.4% |
| Salvadoran | 145 | 0.4% |
| Scandinavian | 15 | 0.0% |
| Scotch-Irish | 10 | 0.0% |
| Scottish | 97 | 0.2% |
| Serbian | 47 | 0.1% |
| Slavic | 78 | 0.2% |
| South American | 1,400 | 3.5% |
| South American Indian | 32 | 0.1% |
| Spaniard | 43 | 0.1% |
| Sri Lankan | 102 | 0.3% |
| Subsaharan African | 49 | 0.1% |
| Swedish | 29 | 0.1% |
| Swiss | 5 | 0.0% |
| Syrian | 101 | 0.3% |
| Thai | 1,221 | 3.1% |
| Trinidadian and Tobagonian | 39 | 0.1% |
| Turkish | 618 | 1.5% |
| Ukrainian | 227 | 0.6% |
| Uruguayan | 29 | 0.1% |
| Venezuelan | 40 | 0.1% |
| Welsh | 14 | 0.0% |
| West Indian | 11 | 0.0% | View All 102 Rows |
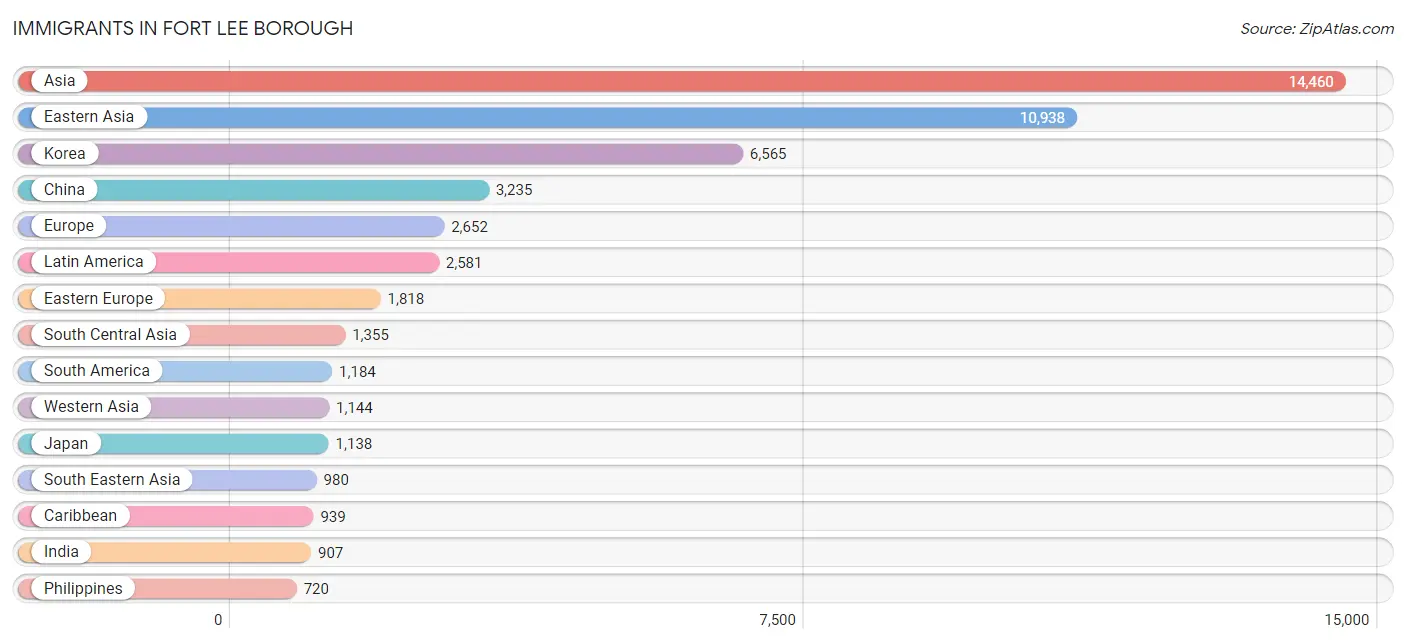
Immigrants in Fort Lee borough
The most numerous immigrant groups reported in Fort Lee borough came from Asia (14,460 | 36.3%), Eastern Asia (10,938 | 27.5%), Korea (6,565 | 16.5%), China (3,235 | 8.1%), and Europe (2,652 | 6.7%), together accounting for 95.1% of all Fort Lee borough residents.
| Immigration Origin | # Population | % Population |
| Africa | 260 | 0.6% |
| Albania | 68 | 0.2% |
| Argentina | 184 | 0.5% |
| Armenia | 26 | 0.1% |
| Asia | 14,460 | 36.3% |
| Austria | 17 | 0.0% |
| Belarus | 105 | 0.3% |
| Brazil | 173 | 0.4% |
| Bulgaria | 46 | 0.1% |
| Canada | 102 | 0.3% |
| Caribbean | 939 | 2.4% |
| Central America | 458 | 1.1% |
| China | 3,235 | 8.1% |
| Colombia | 602 | 1.5% |
| Croatia | 47 | 0.1% |
| Cuba | 227 | 0.6% |
| Dominica | 10 | 0.0% |
| Dominican Republic | 561 | 1.4% |
| Eastern Africa | 23 | 0.1% |
| Eastern Asia | 10,938 | 27.5% |
| Eastern Europe | 1,818 | 4.6% |
| Ecuador | 144 | 0.4% |
| Egypt | 114 | 0.3% |
| El Salvador | 119 | 0.3% |
| England | 6 | 0.0% |
| Europe | 2,652 | 6.7% |
| France | 37 | 0.1% |
| Germany | 197 | 0.5% |
| Greece | 109 | 0.3% |
| Guatemala | 185 | 0.5% |
| Guyana | 13 | 0.0% |
| Honduras | 11 | 0.0% |
| Hong Kong | 223 | 0.6% |
| India | 907 | 2.3% |
| Indonesia | 51 | 0.1% |
| Iran | 50 | 0.1% |
| Iraq | 22 | 0.1% |
| Ireland | 11 | 0.0% |
| Israel | 175 | 0.4% |
| Italy | 249 | 0.6% |
| Jamaica | 97 | 0.2% |
| Japan | 1,138 | 2.9% |
| Jordan | 31 | 0.1% |
| Kazakhstan | 72 | 0.2% |
| Korea | 6,565 | 16.5% |
| Kuwait | 46 | 0.1% |
| Latin America | 2,581 | 6.5% |
| Latvia | 5 | 0.0% |
| Lebanon | 33 | 0.1% |
| Malaysia | 97 | 0.2% |
| Mexico | 102 | 0.3% |
| Moldova | 38 | 0.1% |
| Morocco | 51 | 0.1% |
| Nepal | 11 | 0.0% |
| Nicaragua | 34 | 0.1% |
| Nigeria | 49 | 0.1% |
| North Macedonia | 14 | 0.0% |
| Northern Africa | 181 | 0.4% |
| Northern Europe | 64 | 0.2% |
| Pakistan | 122 | 0.3% |
| Panama | 7 | 0.0% |
| Peru | 60 | 0.2% |
| Philippines | 720 | 1.8% |
| Poland | 159 | 0.4% |
| Romania | 199 | 0.5% |
| Russia | 659 | 1.7% |
| Saudi Arabia | 10 | 0.0% |
| Serbia | 13 | 0.0% |
| Singapore | 17 | 0.0% |
| South America | 1,184 | 3.0% |
| South Central Asia | 1,355 | 3.4% |
| South Eastern Asia | 980 | 2.5% |
| Southern Europe | 455 | 1.1% |
| Spain | 97 | 0.2% |
| Sweden | 12 | 0.0% |
| Syria | 127 | 0.3% |
| Taiwan | 289 | 0.7% |
| Trinidad and Tobago | 44 | 0.1% |
| Turkey | 624 | 1.6% |
| Ukraine | 424 | 1.1% |
| Uzbekistan | 193 | 0.5% |
| Venezuela | 8 | 0.0% |
| Vietnam | 87 | 0.2% |
| Western Africa | 56 | 0.1% |
| Western Asia | 1,144 | 2.9% |
| Western Europe | 251 | 0.6% |
| Zimbabwe | 23 | 0.1% | View All 87 Rows |
Sex and Age in Fort Lee borough
Sex and Age in Fort Lee borough
The most populous age groups in Fort Lee borough are 35 to 39 Years (1,624 | 8.4%) for men and 35 to 39 Years (1,687 | 8.3%) for women.
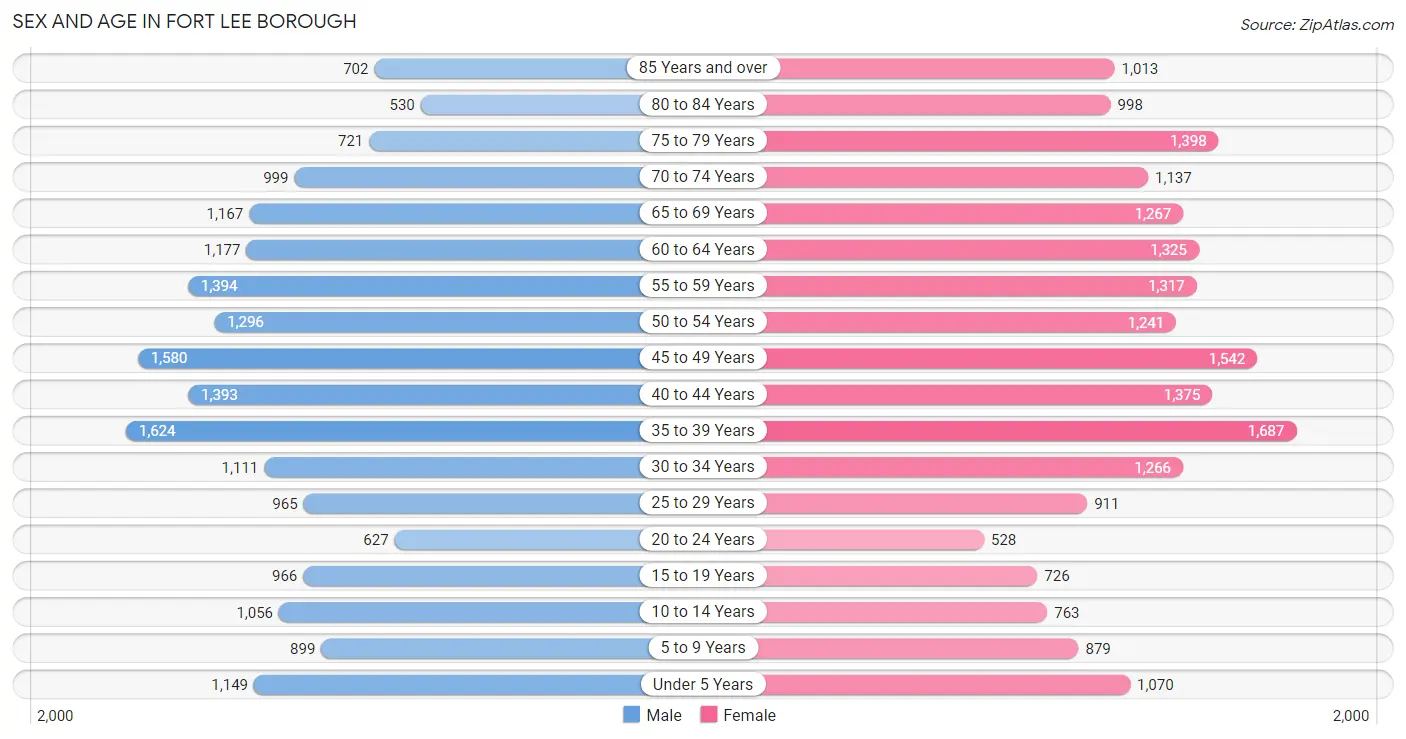
| Age Bracket | Male | Female |
| Under 5 Years | 1,149 (5.9%) | 1,070 (5.2%) |
| 5 to 9 Years | 899 (4.6%) | 879 (4.3%) |
| 10 to 14 Years | 1,056 (5.5%) | 763 (3.7%) |
| 15 to 19 Years | 966 (5.0%) | 726 (3.5%) |
| 20 to 24 Years | 627 (3.2%) | 528 (2.6%) |
| 25 to 29 Years | 965 (5.0%) | 911 (4.5%) |
| 30 to 34 Years | 1,111 (5.7%) | 1,266 (6.2%) |
| 35 to 39 Years | 1,624 (8.4%) | 1,687 (8.3%) |
| 40 to 44 Years | 1,393 (7.2%) | 1,375 (6.7%) |
| 45 to 49 Years | 1,580 (8.2%) | 1,542 (7.5%) |
| 50 to 54 Years | 1,296 (6.7%) | 1,241 (6.1%) |
| 55 to 59 Years | 1,394 (7.2%) | 1,317 (6.4%) |
| 60 to 64 Years | 1,177 (6.1%) | 1,325 (6.5%) |
| 65 to 69 Years | 1,167 (6.0%) | 1,267 (6.2%) |
| 70 to 74 Years | 999 (5.2%) | 1,137 (5.6%) |
| 75 to 79 Years | 721 (3.7%) | 1,398 (6.8%) |
| 80 to 84 Years | 530 (2.7%) | 998 (4.9%) |
| 85 Years and over | 702 (3.6%) | 1,013 (5.0%) |
| Total | 19,356 (100.0%) | 20,443 (100.0%) |
Families and Households in Fort Lee borough
Median Family Size in Fort Lee borough
The median family size in Fort Lee borough is 2.94 persons per family, with married-couple families (8,449 | 81.9%) accounting for the largest median family size of 2.96 persons per family. On the other hand, single male/father families (477 | 4.6%) represent the smallest median family size with 2.76 persons per family.
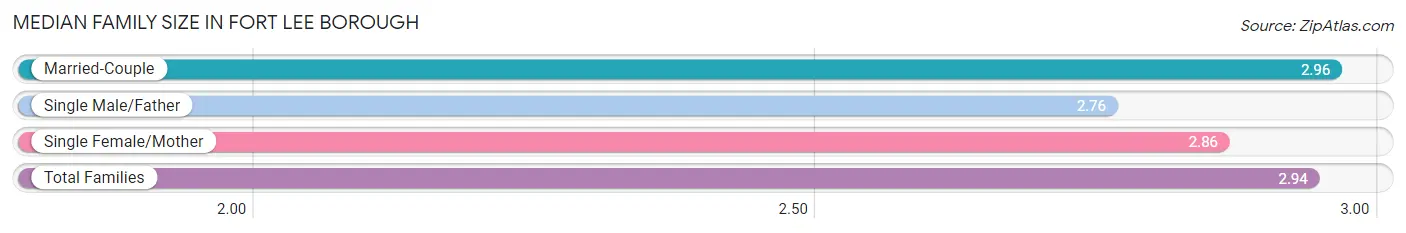
| Family Type | # Families | Family Size |
| Married-Couple | 8,449 (81.9%) | 2.96 |
| Single Male/Father | 477 (4.6%) | 2.76 |
| Single Female/Mother | 1,385 (13.4%) | 2.86 |
| Total Families | 10,311 (100.0%) | 2.94 |
Median Household Size in Fort Lee borough
The median household size in Fort Lee borough is 2.17 persons per household, with single male/father households (477 | 2.6%) accounting for the largest median household size of 3.09 persons per household. non-family households (8,001 | 43.7%) represent the smallest median household size with 1.14 persons per household.
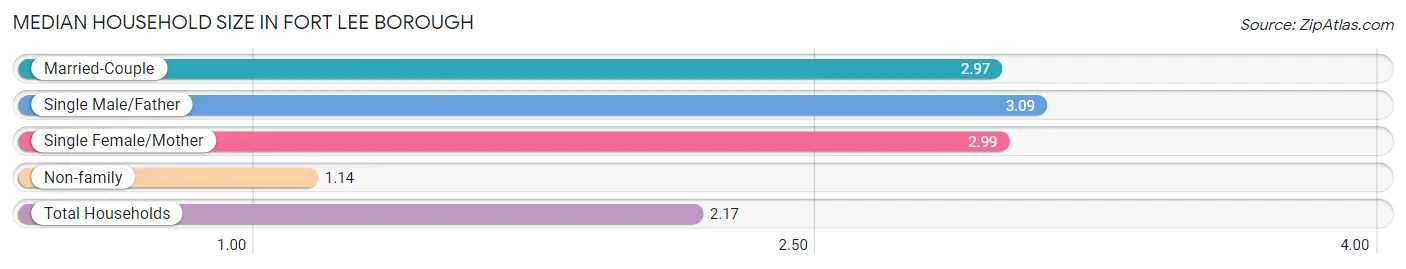
| Household Type | # Households | Household Size |
| Married-Couple | 8,449 (46.1%) | 2.97 |
| Single Male/Father | 477 (2.6%) | 3.09 |
| Single Female/Mother | 1,385 (7.6%) | 2.99 |
| Non-family | 8,001 (43.7%) | 1.14 |
| Total Households | 18,312 (100.0%) | 2.17 |
Household Size by Marriage Status in Fort Lee borough
Out of a total of 18,312 households in Fort Lee borough, 10,311 (56.3%) are family households, while 8,001 (43.7%) are nonfamily households. The most numerous type of family households are 2-person households, comprising 4,947, and the most common type of nonfamily households are 1-person households, comprising 6,973.
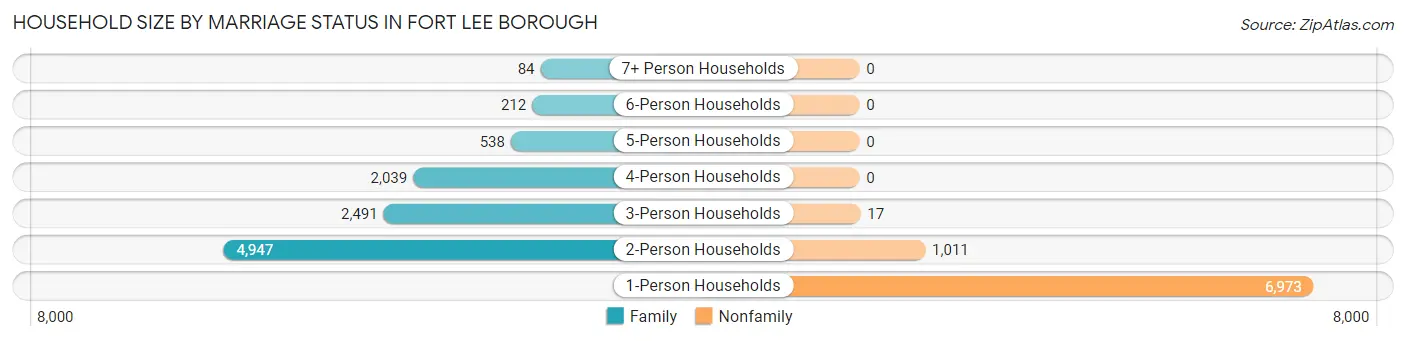
| Household Size | Family Households | Nonfamily Households |
| 1-Person Households | - | 6,973 (38.1%) |
| 2-Person Households | 4,947 (27.0%) | 1,011 (5.5%) |
| 3-Person Households | 2,491 (13.6%) | 17 (0.1%) |
| 4-Person Households | 2,039 (11.1%) | 0 (0.0%) |
| 5-Person Households | 538 (2.9%) | 0 (0.0%) |
| 6-Person Households | 212 (1.2%) | 0 (0.0%) |
| 7+ Person Households | 84 (0.5%) | 0 (0.0%) |
| Total | 10,311 (56.3%) | 8,001 (43.7%) |
Female Fertility in Fort Lee borough
Fertility by Age in Fort Lee borough
Average fertility rate in Fort Lee borough is 82.0 births per 1,000 women. Women in the age bracket of 20 to 34 years have the highest fertility rate with 111.0 births per 1,000 women. Women in the age bracket of 35 to 50 years acount for 56.1% of all women with births.
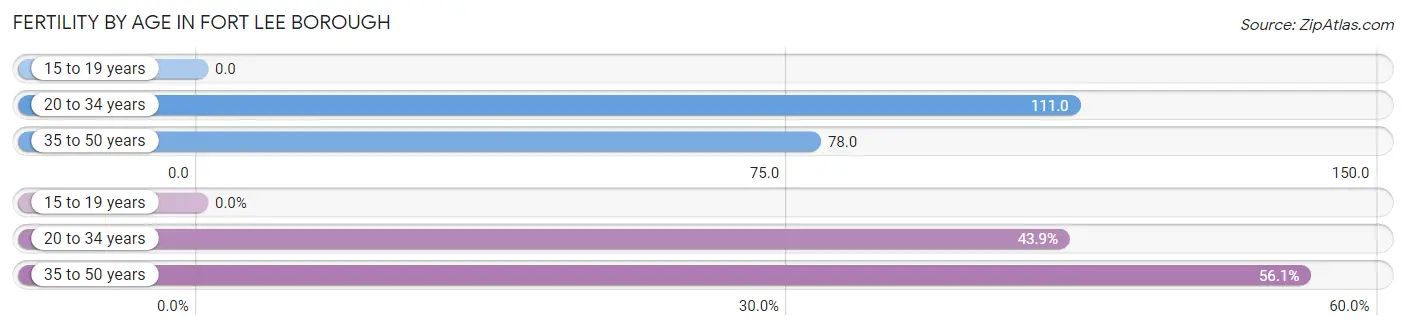
| Age Bracket | Women with Births | Births / 1,000 Women |
| 15 to 19 years | 0 (0.0%) | 0.0 |
| 20 to 34 years | 300 (43.9%) | 111.0 |
| 35 to 50 years | 384 (56.1%) | 78.0 |
| Total | 684 (100.0%) | 82.0 |
Fertility by Age by Marriage Status in Fort Lee borough
89.3% of women with births (684) in Fort Lee borough are married. The highest percentage of unmarried women with births falls into 20 to 34 years age bracket with 14.7% of them unmarried at the time of birth, while the lowest percentage of unmarried women with births belong to 35 to 50 years age bracket with 7.6% of them unmarried.
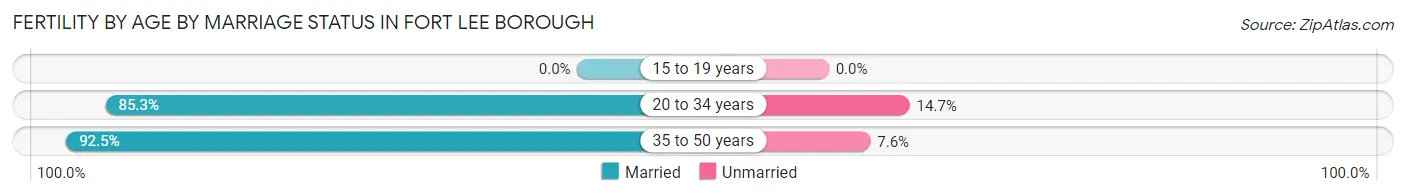
| Age Bracket | Married | Unmarried |
| 15 to 19 years | 0 (0.0%) | 0 (0.0%) |
| 20 to 34 years | 256 (85.3%) | 44 (14.7%) |
| 35 to 50 years | 355 (92.4%) | 29 (7.5%) |
| Total | 611 (89.3%) | 73 (10.7%) |
Fertility by Education in Fort Lee borough
Average fertility rate in Fort Lee borough is 82.0 births per 1,000 women. Women with the education attainment of bachelor's degree have the highest fertility rate of 98.0 births per 1,000 women, while women with the education attainment of less than high school have the lowest fertility at 48.0 births per 1,000 women. Women with the education attainment of bachelor's degree represent 46.4% of all women with births.
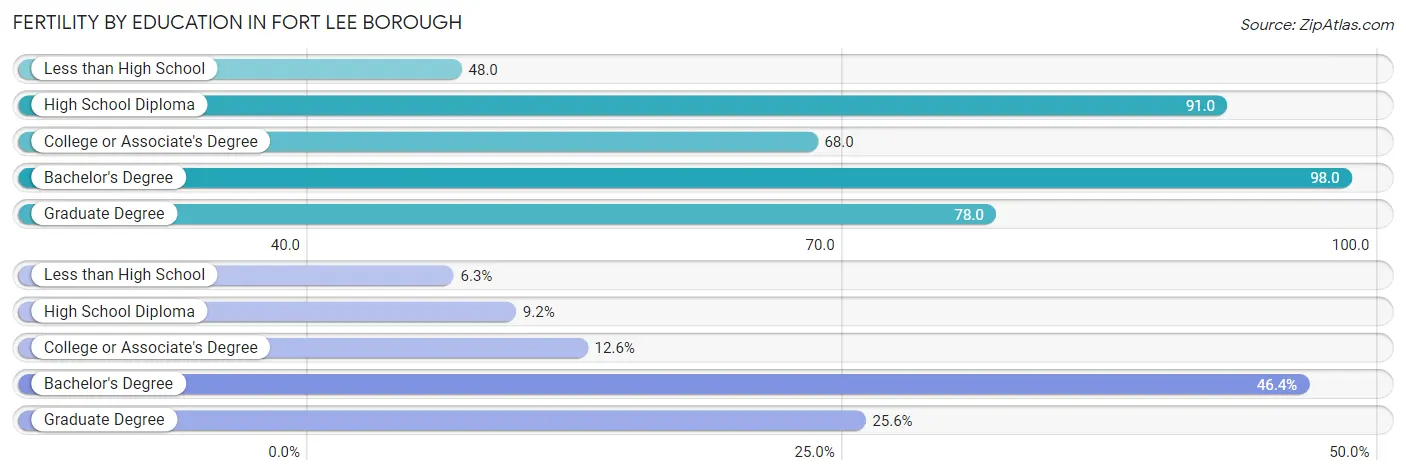
| Educational Attainment | Women with Births | Births / 1,000 Women |
| Less than High School | 43 (6.3%) | 48.0 |
| High School Diploma | 63 (9.2%) | 91.0 |
| College or Associate's Degree | 86 (12.6%) | 68.0 |
| Bachelor's Degree | 317 (46.4%) | 98.0 |
| Graduate Degree | 175 (25.6%) | 78.0 |
| Total | 684 (100.0%) | 82.0 |
Fertility by Education by Marriage Status in Fort Lee borough
10.7% of women with births in Fort Lee borough are unmarried. Women with the educational attainment of less than high school are most likely to be married with 100.0% of them married at childbirth, while women with the educational attainment of bachelor's degree are least likely to be married with 18.9% of them unmarried at childbirth.
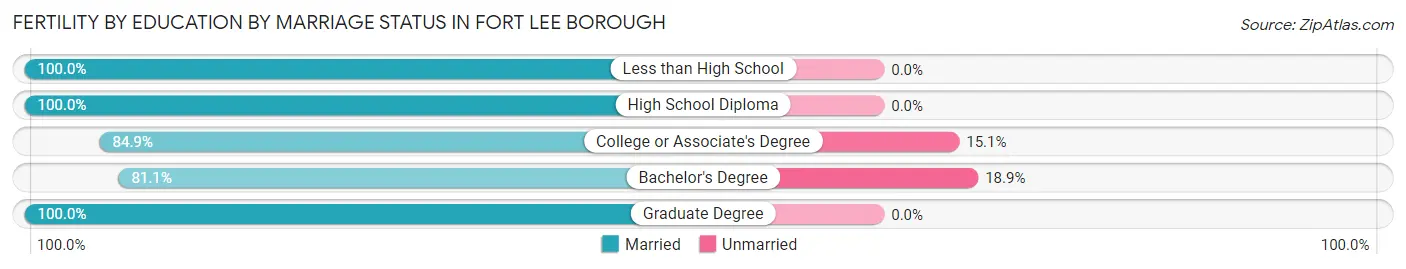
| Educational Attainment | Married | Unmarried |
| Less than High School | 43 (100.0%) | 0 (0.0%) |
| High School Diploma | 63 (100.0%) | 0 (0.0%) |
| College or Associate's Degree | 73 (84.9%) | 13 (15.1%) |
| Bachelor's Degree | 257 (81.1%) | 60 (18.9%) |
| Graduate Degree | 175 (100.0%) | 0 (0.0%) |
| Total | 611 (89.3%) | 73 (10.7%) |
Employment Characteristics in Fort Lee borough
Employment by Class of Employer in Fort Lee borough
Among the 19,567 employed individuals in Fort Lee borough, private company employees (12,312 | 62.9%), not-for-profit organizations (2,111 | 10.8%), and self-employed (incorporated) (1,755 | 9.0%) make up the most common classes of employment.
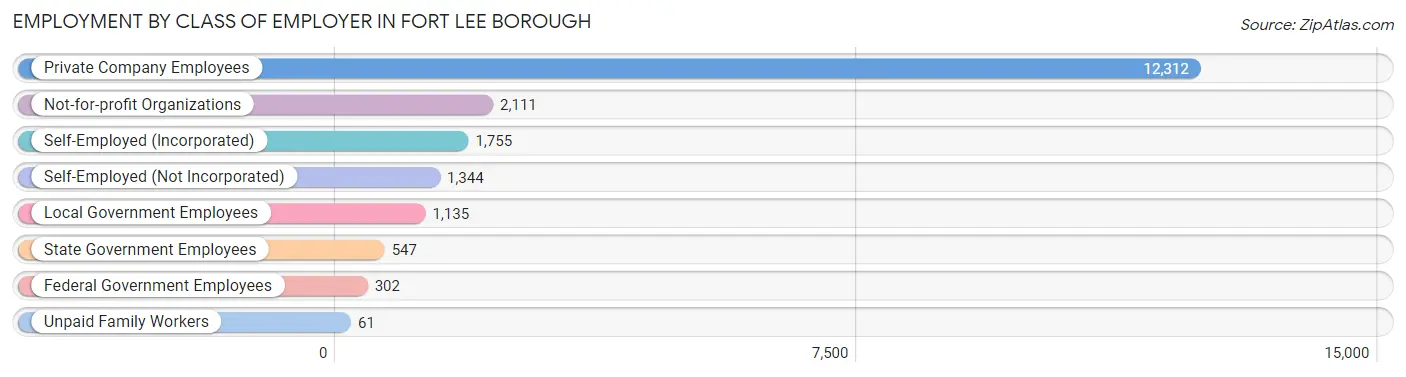
| Employer Class | # Employees | % Employees |
| Private Company Employees | 12,312 | 62.9% |
| Self-Employed (Incorporated) | 1,755 | 9.0% |
| Self-Employed (Not Incorporated) | 1,344 | 6.9% |
| Not-for-profit Organizations | 2,111 | 10.8% |
| Local Government Employees | 1,135 | 5.8% |
| State Government Employees | 547 | 2.8% |
| Federal Government Employees | 302 | 1.5% |
| Unpaid Family Workers | 61 | 0.3% |
| Total | 19,567 | 100.0% |
Employment Status by Age in Fort Lee borough
According to the labor force statistics for Fort Lee borough, out of the total population over 16 years of age (33,670), 62.1% or 20,909 individuals are in the labor force, with 4.8% or 1,004 of them unemployed. The age group with the highest labor force participation rate is 30 to 34 years, with 88.2% or 2,097 individuals in the labor force. Within the labor force, the 16 to 19 years age range has the highest percentage of unemployed individuals, with 26.7% or 75 of them being unemployed.
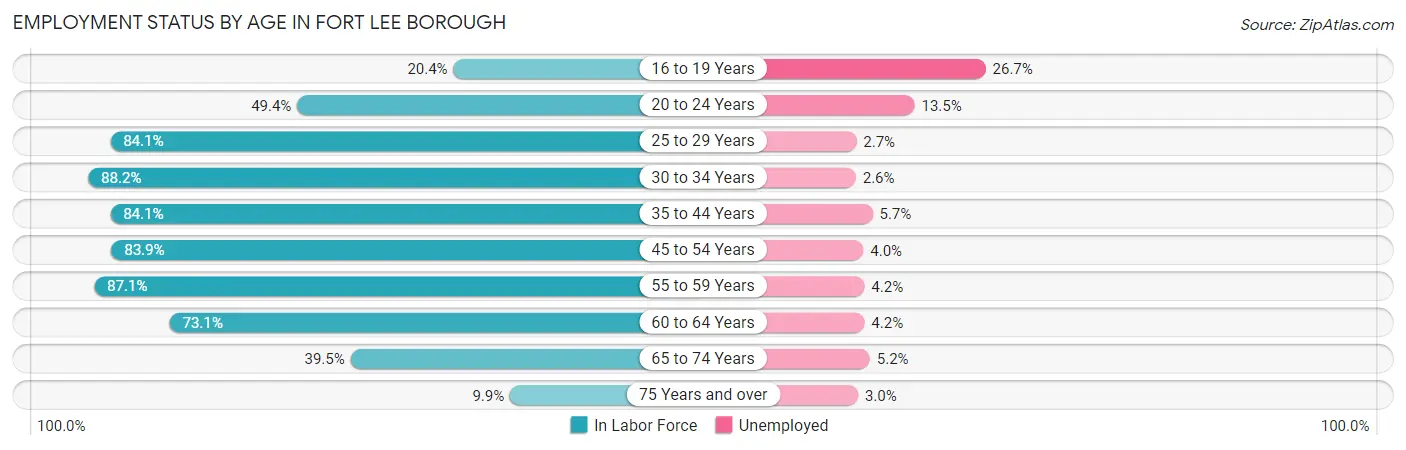
| Age Bracket | In Labor Force | Unemployed |
| 16 to 19 Years | 281 (20.4%) | 75 (26.7%) |
| 20 to 24 Years | 571 (49.4%) | 77 (13.5%) |
| 25 to 29 Years | 1,578 (84.1%) | 43 (2.7%) |
| 30 to 34 Years | 2,097 (88.2%) | 55 (2.6%) |
| 35 to 44 Years | 5,112 (84.1%) | 291 (5.7%) |
| 45 to 54 Years | 4,748 (83.9%) | 190 (4.0%) |
| 55 to 59 Years | 2,361 (87.1%) | 99 (4.2%) |
| 60 to 64 Years | 1,829 (73.1%) | 77 (4.2%) |
| 65 to 74 Years | 1,805 (39.5%) | 94 (5.2%) |
| 75 Years and over | 531 (9.9%) | 16 (3.0%) |
| Total | 20,909 (62.1%) | 1,004 (4.8%) |
Employment Status by Educational Attainment in Fort Lee borough
According to labor force statistics for Fort Lee borough, 83.6% of individuals (17,727) out of the total population between 25 and 64 years of age (21,204) are in the labor force, with 4.2% or 745 of them being unemployed. The group with the highest labor force participation rate are those with the educational attainment of bachelor's degree or higher, with 87.1% or 12,315 individuals in the labor force. Within the labor force, individuals with high school diploma education have the highest percentage of unemployment, with 4.8% or 104 of them being unemployed.
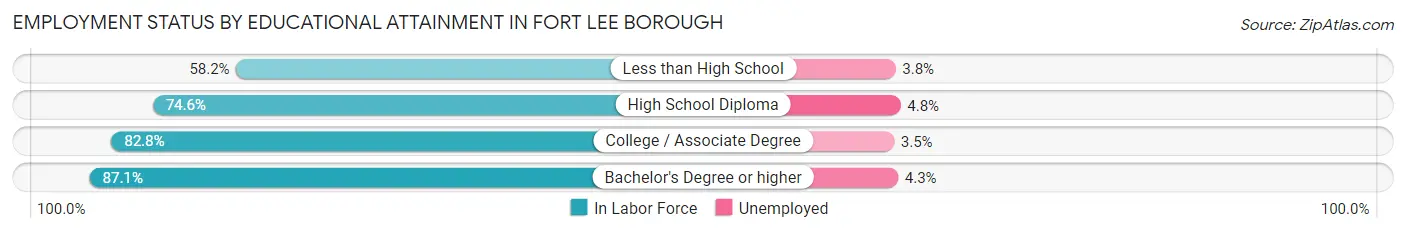
| Educational Attainment | In Labor Force | Unemployed |
| Less than High School | 470 (58.2%) | 31 (3.8%) |
| High School Diploma | 2,163 (74.6%) | 139 (4.8%) |
| College / Associate Degree | 2,780 (82.8%) | 118 (3.5%) |
| Bachelor's Degree or higher | 12,315 (87.1%) | 608 (4.3%) |
| Total | 17,727 (83.6%) | 891 (4.2%) |
Employment Occupations by Sex in Fort Lee borough
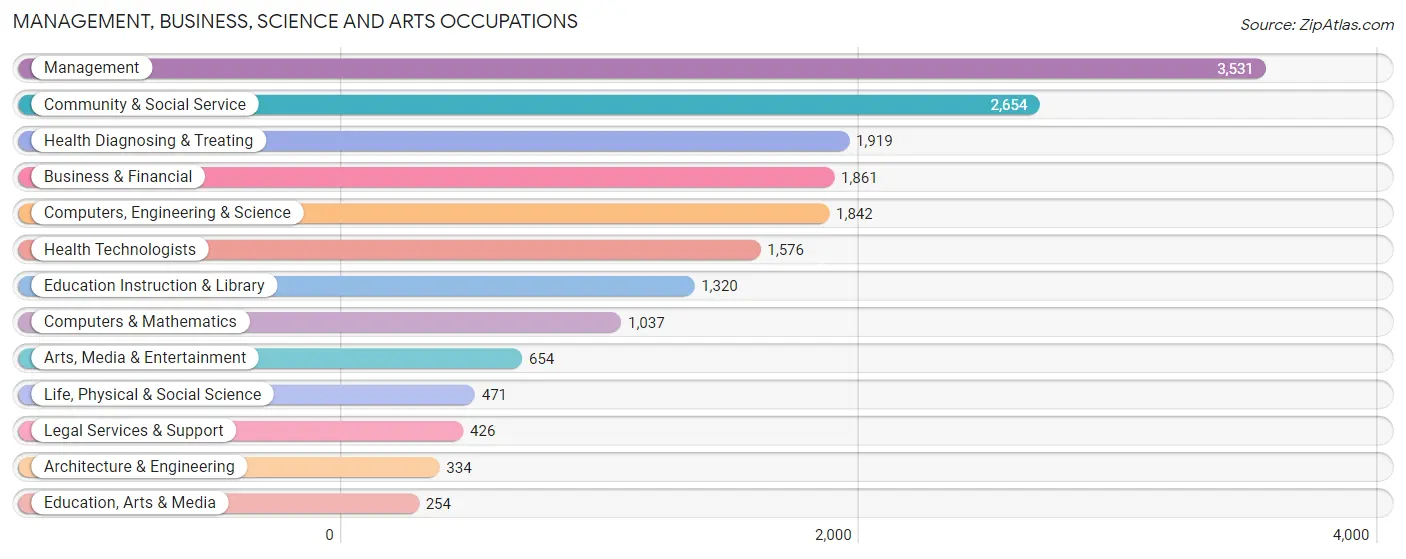
Management, Business, Science and Arts Occupations
The most common Management, Business, Science and Arts occupations in Fort Lee borough are Management (3,531 | 17.8%), Community & Social Service (2,654 | 13.4%), Health Diagnosing & Treating (1,919 | 9.7%), Business & Financial (1,861 | 9.4%), and Computers, Engineering & Science (1,842 | 9.3%).
Management, Business, Science and Arts Occupations by Sex
Within the Management, Business, Science and Arts occupations in Fort Lee borough, the most male-oriented occupations are Architecture & Engineering (91.3%), Computers & Mathematics (75.4%), and Computers, Engineering & Science (73.0%), while the most female-oriented occupations are Education, Arts & Media (66.1%), Arts, Media & Entertainment (63.8%), and Education Instruction & Library (63.2%).
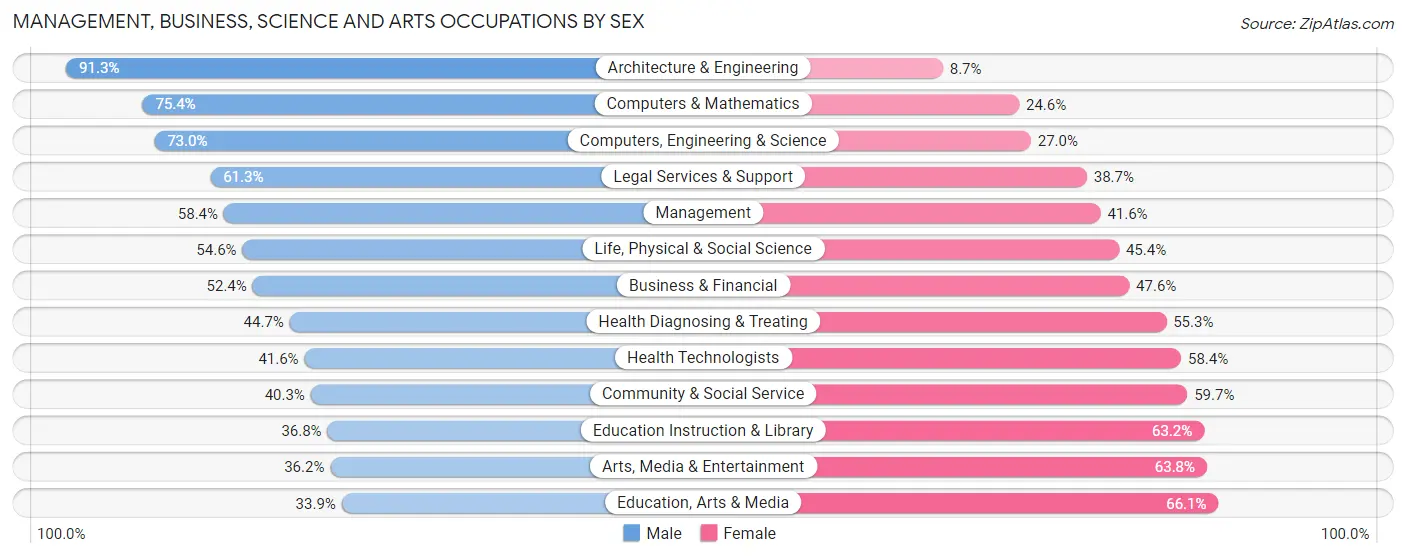
| Occupation | Male | Female |
| Management | 2,063 (58.4%) | 1,468 (41.6%) |
| Business & Financial | 976 (52.4%) | 885 (47.6%) |
| Computers, Engineering & Science | 1,344 (73.0%) | 498 (27.0%) |
| Computers & Mathematics | 782 (75.4%) | 255 (24.6%) |
| Architecture & Engineering | 305 (91.3%) | 29 (8.7%) |
| Life, Physical & Social Science | 257 (54.6%) | 214 (45.4%) |
| Community & Social Service | 1,070 (40.3%) | 1,584 (59.7%) |
| Education, Arts & Media | 86 (33.9%) | 168 (66.1%) |
| Legal Services & Support | 261 (61.3%) | 165 (38.7%) |
| Education Instruction & Library | 486 (36.8%) | 834 (63.2%) |
| Arts, Media & Entertainment | 237 (36.2%) | 417 (63.8%) |
| Health Diagnosing & Treating | 858 (44.7%) | 1,061 (55.3%) |
| Health Technologists | 656 (41.6%) | 920 (58.4%) |
| Total (Category) | 6,311 (53.4%) | 5,496 (46.6%) |
| Total (Overall) | 10,850 (54.7%) | 8,991 (45.3%) |
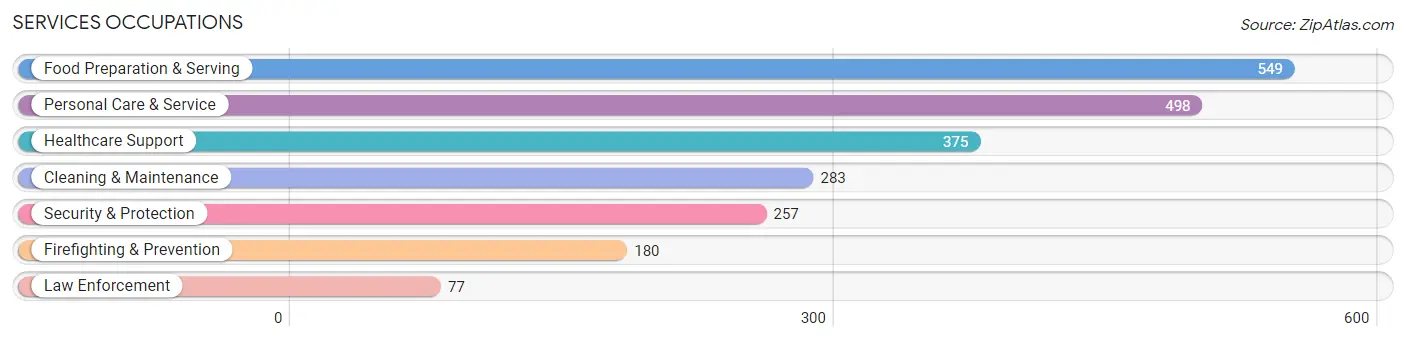
Services Occupations
The most common Services occupations in Fort Lee borough are Food Preparation & Serving (549 | 2.8%), Personal Care & Service (498 | 2.5%), Healthcare Support (375 | 1.9%), Cleaning & Maintenance (283 | 1.4%), and Security & Protection (257 | 1.3%).
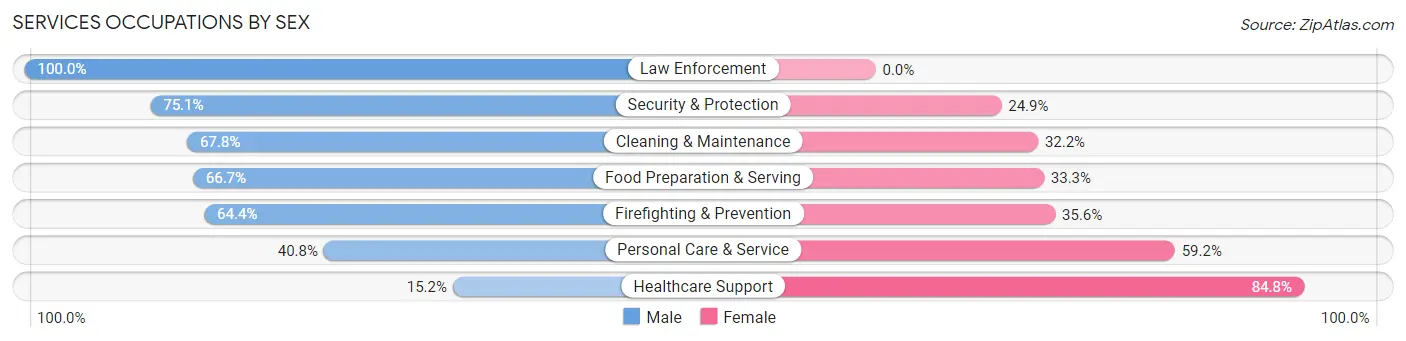
Services Occupations by Sex
Within the Services occupations in Fort Lee borough, the most male-oriented occupations are Law Enforcement (100.0%), Security & Protection (75.1%), and Cleaning & Maintenance (67.8%), while the most female-oriented occupations are Healthcare Support (84.8%), Personal Care & Service (59.2%), and Firefighting & Prevention (35.6%).
| Occupation | Male | Female |
| Healthcare Support | 57 (15.2%) | 318 (84.8%) |
| Security & Protection | 193 (75.1%) | 64 (24.9%) |
| Firefighting & Prevention | 116 (64.4%) | 64 (35.6%) |
| Law Enforcement | 77 (100.0%) | 0 (0.0%) |
| Food Preparation & Serving | 366 (66.7%) | 183 (33.3%) |
| Cleaning & Maintenance | 192 (67.8%) | 91 (32.2%) |
| Personal Care & Service | 203 (40.8%) | 295 (59.2%) |
| Total (Category) | 1,011 (51.5%) | 951 (48.5%) |
| Total (Overall) | 10,850 (54.7%) | 8,991 (45.3%) |
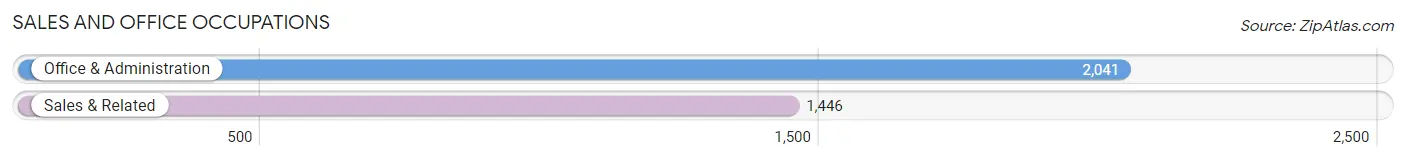
Sales and Office Occupations
The most common Sales and Office occupations in Fort Lee borough are Office & Administration (2,041 | 10.3%), and Sales & Related (1,446 | 7.3%).
Sales and Office Occupations by Sex
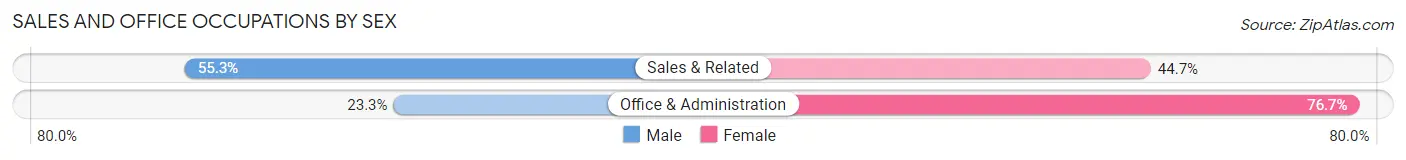
| Occupation | Male | Female |
| Sales & Related | 800 (55.3%) | 646 (44.7%) |
| Office & Administration | 475 (23.3%) | 1,566 (76.7%) |
| Total (Category) | 1,275 (36.6%) | 2,212 (63.4%) |
| Total (Overall) | 10,850 (54.7%) | 8,991 (45.3%) |
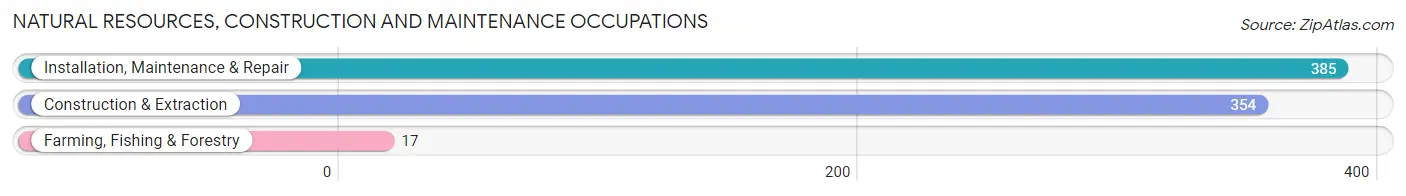
Natural Resources, Construction and Maintenance Occupations
The most common Natural Resources, Construction and Maintenance occupations in Fort Lee borough are Installation, Maintenance & Repair (385 | 1.9%), Construction & Extraction (354 | 1.8%), and Farming, Fishing & Forestry (17 | 0.1%).
Natural Resources, Construction and Maintenance Occupations by Sex
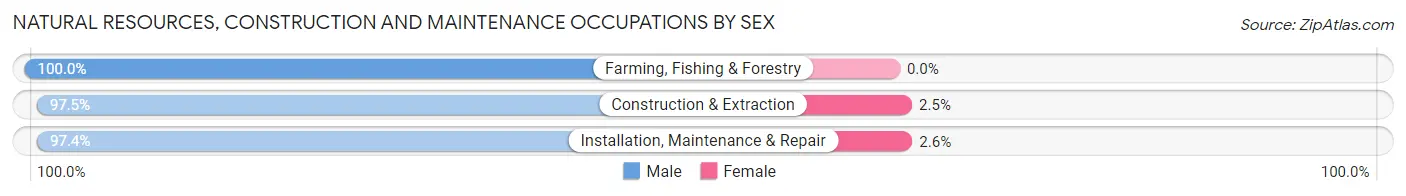
| Occupation | Male | Female |
| Farming, Fishing & Forestry | 17 (100.0%) | 0 (0.0%) |
| Construction & Extraction | 345 (97.5%) | 9 (2.5%) |
| Installation, Maintenance & Repair | 375 (97.4%) | 10 (2.6%) |
| Total (Category) | 737 (97.5%) | 19 (2.5%) |
| Total (Overall) | 10,850 (54.7%) | 8,991 (45.3%) |
Production, Transportation and Moving Occupations
The most common Production, Transportation and Moving occupations in Fort Lee borough are Transportation (764 | 3.8%), Production (691 | 3.5%), and Material Moving (374 | 1.9%).
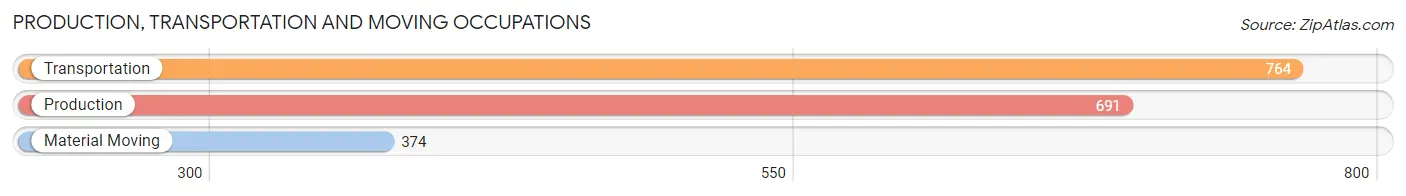
Production, Transportation and Moving Occupations by Sex
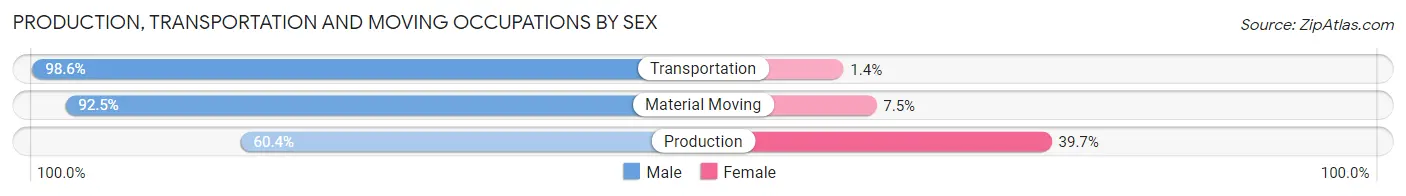
| Occupation | Male | Female |
| Production | 417 (60.4%) | 274 (39.7%) |
| Transportation | 753 (98.6%) | 11 (1.4%) |
| Material Moving | 346 (92.5%) | 28 (7.5%) |
| Total (Category) | 1,516 (82.9%) | 313 (17.1%) |
| Total (Overall) | 10,850 (54.7%) | 8,991 (45.3%) |
Employment Industries by Sex in Fort Lee borough
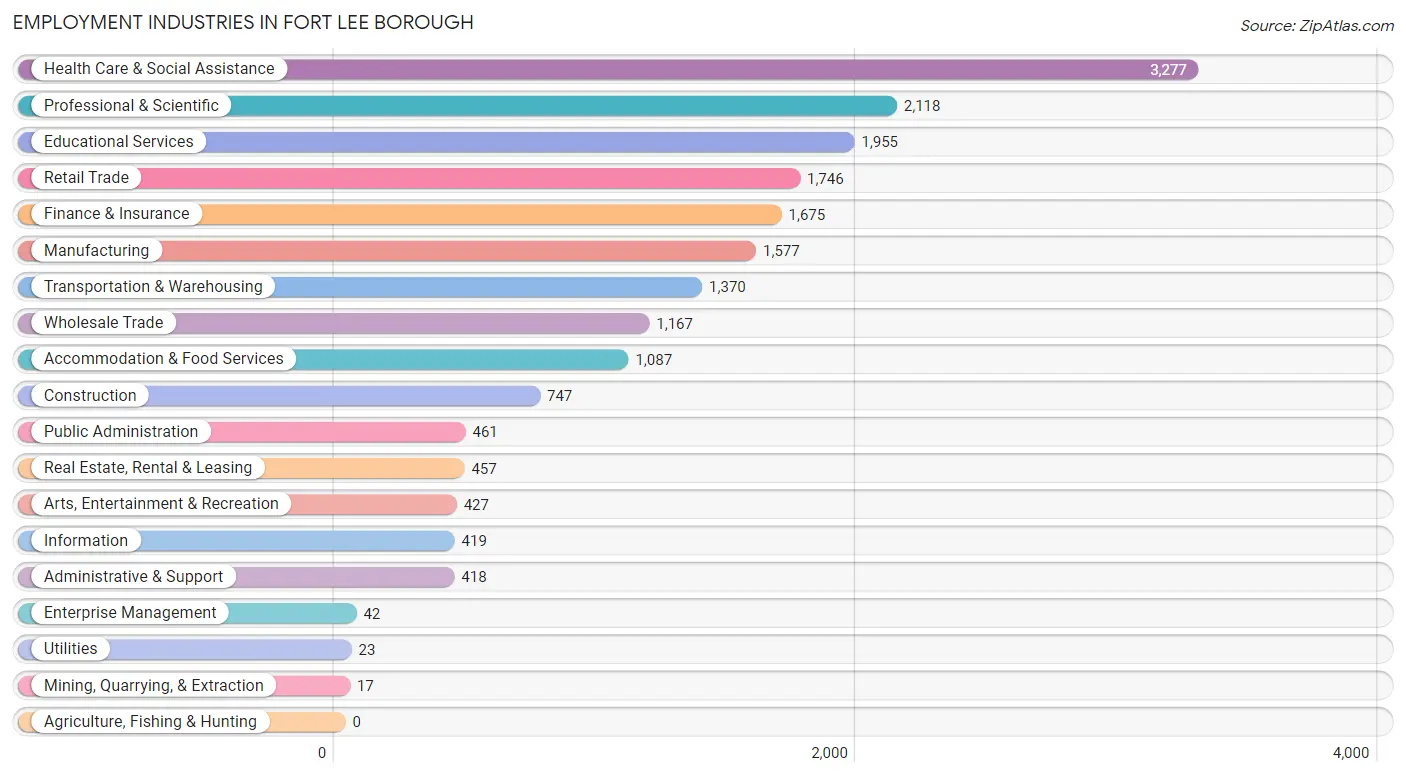
Employment Industries in Fort Lee borough
The major employment industries in Fort Lee borough include Health Care & Social Assistance (3,277 | 16.5%), Professional & Scientific (2,118 | 10.7%), Educational Services (1,955 | 9.9%), Retail Trade (1,746 | 8.8%), and Finance & Insurance (1,675 | 8.4%).
Employment Industries by Sex in Fort Lee borough
The Fort Lee borough industries that see more men than women are Mining, Quarrying, & Extraction (100.0%), Enterprise Management (100.0%), and Construction (92.9%), whereas the industries that tend to have a higher number of women are Health Care & Social Assistance (62.9%), Educational Services (62.6%), and Arts, Entertainment & Recreation (52.0%).
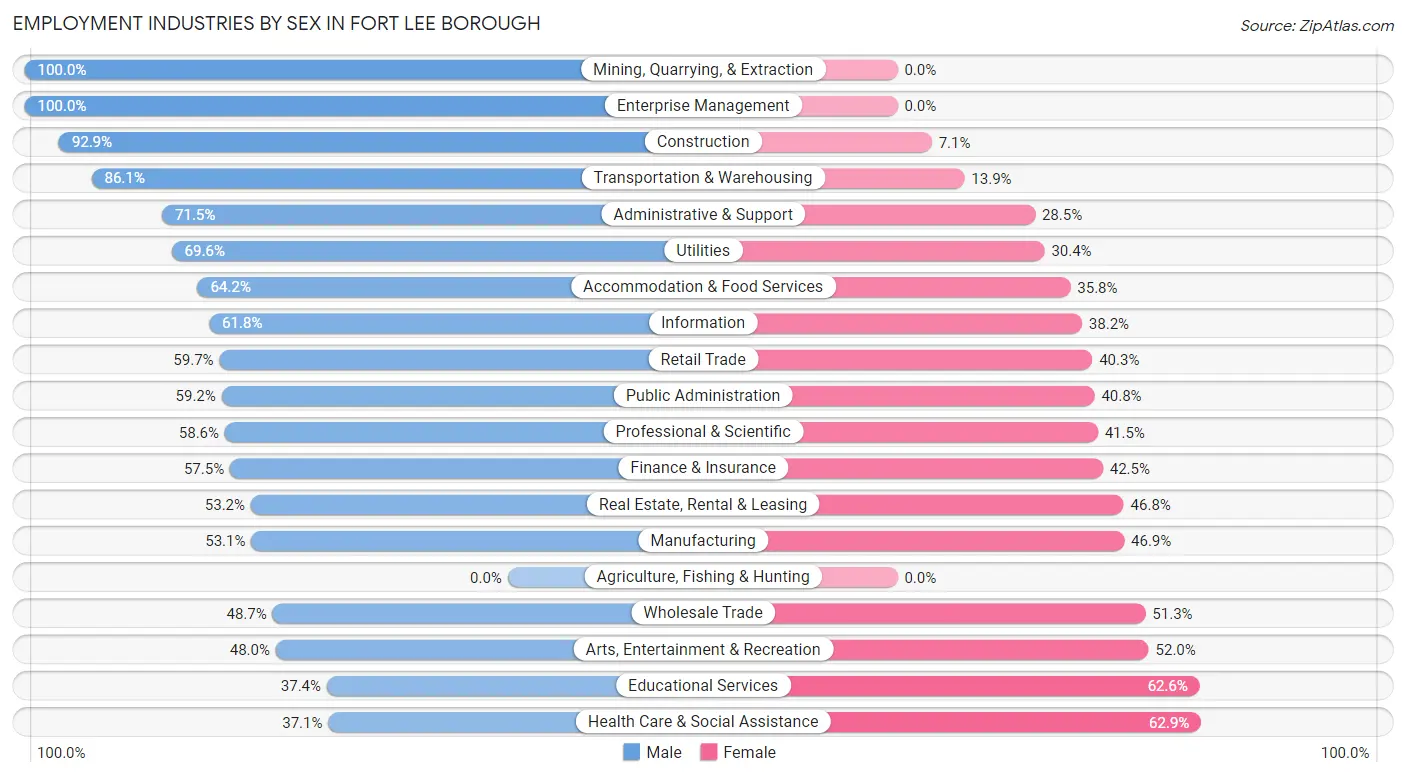
| Industry | Male | Female |
| Agriculture, Fishing & Hunting | 0 (0.0%) | 0 (0.0%) |
| Mining, Quarrying, & Extraction | 17 (100.0%) | 0 (0.0%) |
| Construction | 694 (92.9%) | 53 (7.1%) |
| Manufacturing | 837 (53.1%) | 740 (46.9%) |
| Wholesale Trade | 568 (48.7%) | 599 (51.3%) |
| Retail Trade | 1,042 (59.7%) | 704 (40.3%) |
| Transportation & Warehousing | 1,180 (86.1%) | 190 (13.9%) |
| Utilities | 16 (69.6%) | 7 (30.4%) |
| Information | 259 (61.8%) | 160 (38.2%) |
| Finance & Insurance | 963 (57.5%) | 712 (42.5%) |
| Real Estate, Rental & Leasing | 243 (53.2%) | 214 (46.8%) |
| Professional & Scientific | 1,240 (58.6%) | 878 (41.4%) |
| Enterprise Management | 42 (100.0%) | 0 (0.0%) |
| Administrative & Support | 299 (71.5%) | 119 (28.5%) |
| Educational Services | 732 (37.4%) | 1,223 (62.6%) |
| Health Care & Social Assistance | 1,217 (37.1%) | 2,060 (62.9%) |
| Arts, Entertainment & Recreation | 205 (48.0%) | 222 (52.0%) |
| Accommodation & Food Services | 698 (64.2%) | 389 (35.8%) |
| Public Administration | 273 (59.2%) | 188 (40.8%) |
| Total | 10,850 (54.7%) | 8,991 (45.3%) |
Education in Fort Lee borough
School Enrollment in Fort Lee borough
The most common levels of schooling among the 6,932 students in Fort Lee borough are high school (1,512 | 21.8%), elementary school (1,463 | 21.1%), and middle school (1,354 | 19.5%).
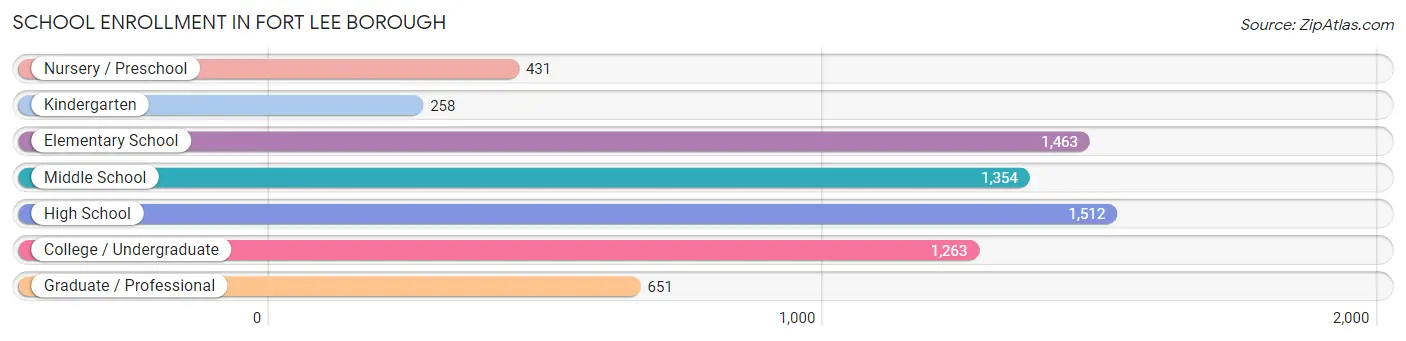
| School Level | # Students | % Students |
| Nursery / Preschool | 431 | 6.2% |
| Kindergarten | 258 | 3.7% |
| Elementary School | 1,463 | 21.1% |
| Middle School | 1,354 | 19.5% |
| High School | 1,512 | 21.8% |
| College / Undergraduate | 1,263 | 18.2% |
| Graduate / Professional | 651 | 9.4% |
| Total | 6,932 | 100.0% |
School Enrollment by Age by Funding Source in Fort Lee borough
Out of a total of 6,932 students who are enrolled in schools in Fort Lee borough, 1,691 (24.4%) attend a private institution, while the remaining 5,241 (75.6%) are enrolled in public schools. The age group of 3 to 4 year olds has the highest likelihood of being enrolled in private schools, with 268 (71.5% in the age bracket) enrolled. Conversely, the age group of 10 to 14 year olds has the lowest likelihood of being enrolled in a private school, with 1,623 (91.3% in the age bracket) attending a public institution.
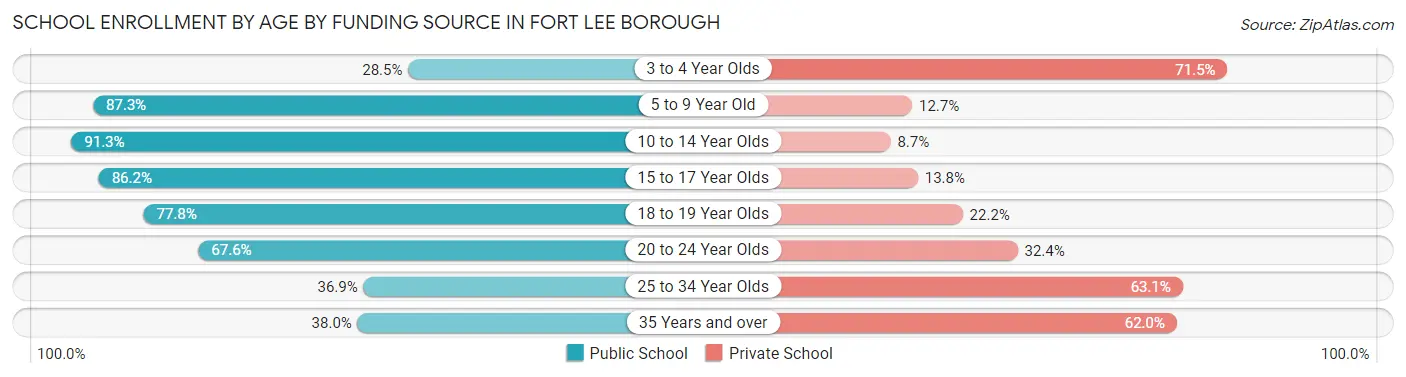
| Age Bracket | Public School | Private School |
| 3 to 4 Year Olds | 107 (28.5%) | 268 (71.5%) |
| 5 to 9 Year Old | 1,383 (87.3%) | 202 (12.7%) |
| 10 to 14 Year Olds | 1,623 (91.3%) | 155 (8.7%) |
| 15 to 17 Year Olds | 930 (86.2%) | 149 (13.8%) |
| 18 to 19 Year Olds | 390 (77.8%) | 111 (22.2%) |
| 20 to 24 Year Olds | 451 (67.6%) | 216 (32.4%) |
| 25 to 34 Year Olds | 150 (36.9%) | 257 (63.1%) |
| 35 Years and over | 205 (38.0%) | 335 (62.0%) |
| Total | 5,241 (75.6%) | 1,691 (24.4%) |
Educational Attainment by Field of Study in Fort Lee borough
Business (4,344 | 20.9%), science & technology (2,386 | 11.5%), engineering (2,234 | 10.7%), social sciences (1,995 | 9.6%), and education (1,668 | 8.0%) are the most common fields of study among 20,816 individuals in Fort Lee borough who have obtained a bachelor's degree or higher.
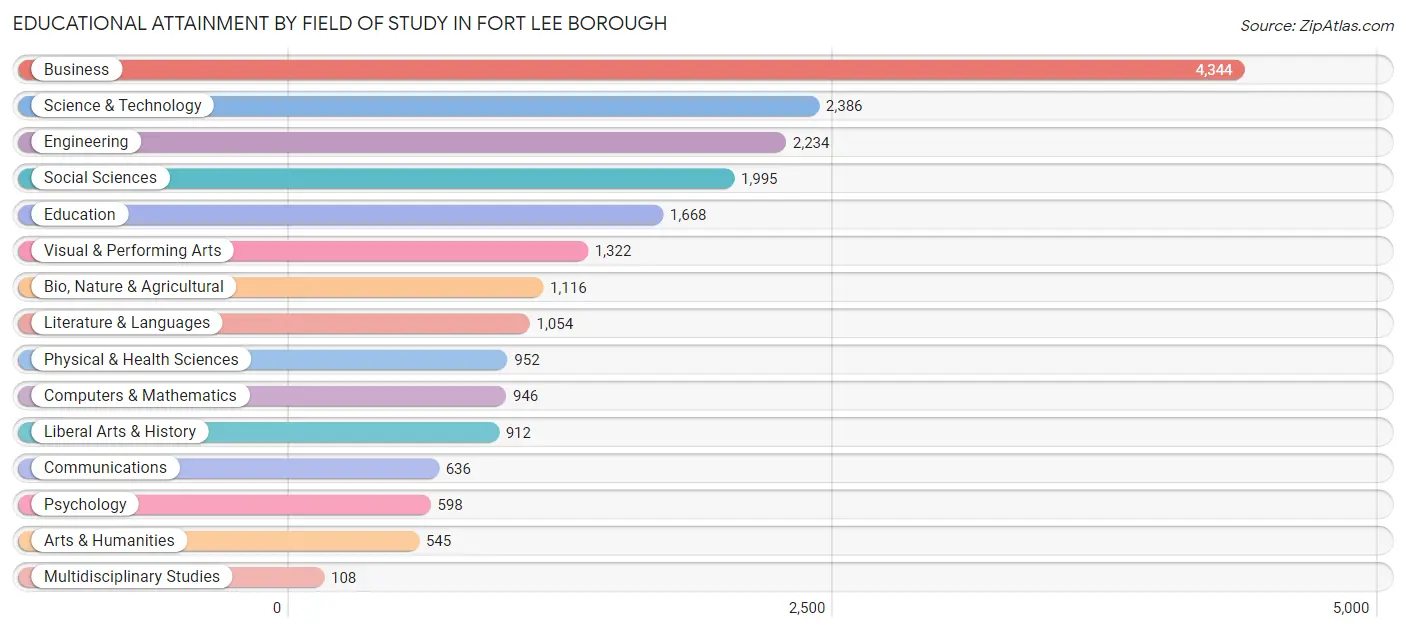
| Field of Study | # Graduates | % Graduates |
| Computers & Mathematics | 946 | 4.5% |
| Bio, Nature & Agricultural | 1,116 | 5.4% |
| Physical & Health Sciences | 952 | 4.6% |
| Psychology | 598 | 2.9% |
| Social Sciences | 1,995 | 9.6% |
| Engineering | 2,234 | 10.7% |
| Multidisciplinary Studies | 108 | 0.5% |
| Science & Technology | 2,386 | 11.5% |
| Business | 4,344 | 20.9% |
| Education | 1,668 | 8.0% |
| Literature & Languages | 1,054 | 5.1% |
| Liberal Arts & History | 912 | 4.4% |
| Visual & Performing Arts | 1,322 | 6.4% |
| Communications | 636 | 3.1% |
| Arts & Humanities | 545 | 2.6% |
| Total | 20,816 | 100.0% |
Transportation & Commute in Fort Lee borough
Vehicle Availability by Sex in Fort Lee borough
The most prevalent vehicle ownership categories in Fort Lee borough are males with 1 vehicle (5,283, accounting for 49.1%) and females with 1 vehicle (4,301, making up 60.0%).
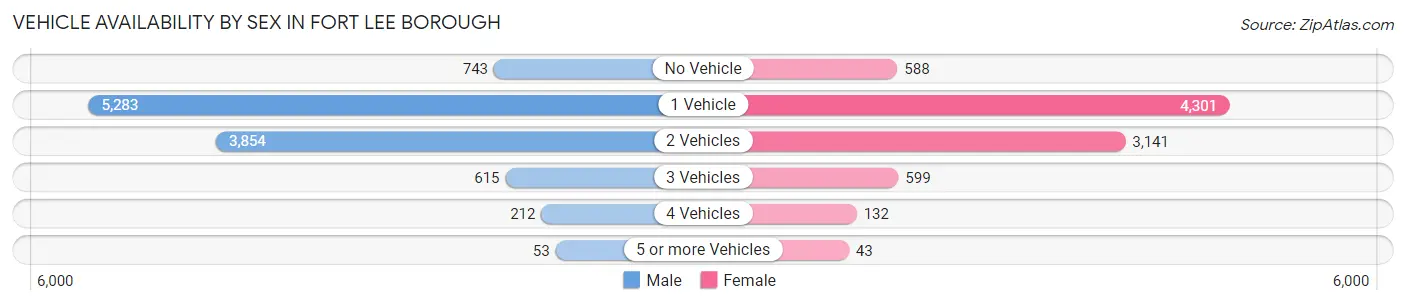
| Vehicles Available | Male | Female |
| No Vehicle | 743 (6.9%) | 588 (6.7%) |
| 1 Vehicle | 5,283 (49.1%) | 4,301 (48.8%) |
| 2 Vehicles | 3,854 (35.8%) | 3,141 (35.7%) |
| 3 Vehicles | 615 (5.7%) | 599 (6.8%) |
| 4 Vehicles | 212 (2.0%) | 132 (1.5%) |
| 5 or more Vehicles | 53 (0.5%) | 43 (0.5%) |
| Total | 10,760 (100.0%) | 8,804 (100.0%) |
Commute Time in Fort Lee borough
The most frequently occuring commute durations in Fort Lee borough are 60 to 89 minutes (3,450 commuters, 20.9%), 30 to 34 minutes (2,565 commuters, 15.5%), and 45 to 59 minutes (1,784 commuters, 10.8%).
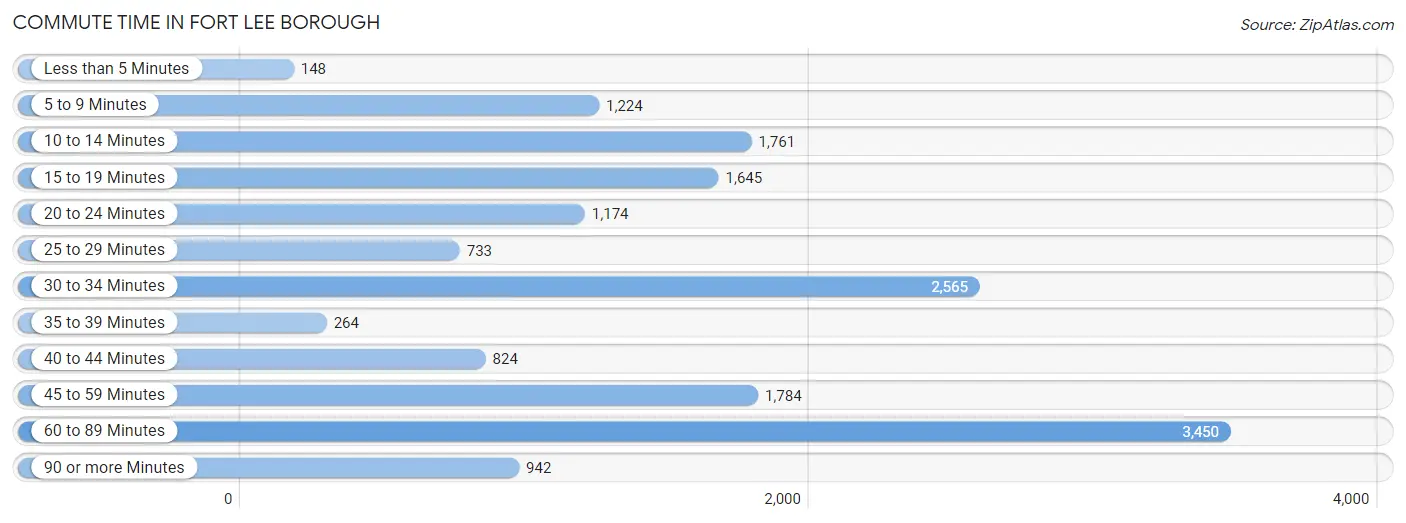
| Commute Time | # Commuters | % Commuters |
| Less than 5 Minutes | 148 | 0.9% |
| 5 to 9 Minutes | 1,224 | 7.4% |
| 10 to 14 Minutes | 1,761 | 10.7% |
| 15 to 19 Minutes | 1,645 | 10.0% |
| 20 to 24 Minutes | 1,174 | 7.1% |
| 25 to 29 Minutes | 733 | 4.4% |
| 30 to 34 Minutes | 2,565 | 15.5% |
| 35 to 39 Minutes | 264 | 1.6% |
| 40 to 44 Minutes | 824 | 5.0% |
| 45 to 59 Minutes | 1,784 | 10.8% |
| 60 to 89 Minutes | 3,450 | 20.9% |
| 90 or more Minutes | 942 | 5.7% |
Commute Time by Sex in Fort Lee borough
The most common commute times in Fort Lee borough are 60 to 89 minutes (2,048 commuters, 21.6%) for males and 60 to 89 minutes (1,402 commuters, 19.9%) for females.
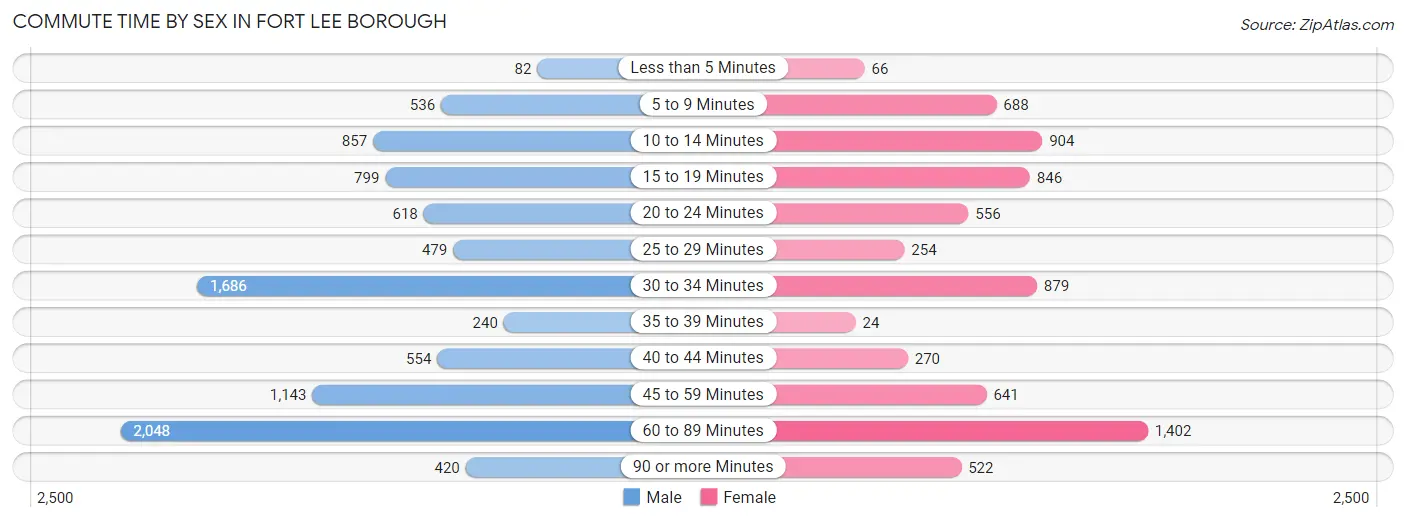
| Commute Time | Male | Female |
| Less than 5 Minutes | 82 (0.9%) | 66 (0.9%) |
| 5 to 9 Minutes | 536 (5.7%) | 688 (9.8%) |
| 10 to 14 Minutes | 857 (9.1%) | 904 (12.8%) |
| 15 to 19 Minutes | 799 (8.4%) | 846 (12.0%) |
| 20 to 24 Minutes | 618 (6.5%) | 556 (7.9%) |
| 25 to 29 Minutes | 479 (5.1%) | 254 (3.6%) |
| 30 to 34 Minutes | 1,686 (17.8%) | 879 (12.5%) |
| 35 to 39 Minutes | 240 (2.5%) | 24 (0.3%) |
| 40 to 44 Minutes | 554 (5.9%) | 270 (3.8%) |
| 45 to 59 Minutes | 1,143 (12.1%) | 641 (9.1%) |
| 60 to 89 Minutes | 2,048 (21.6%) | 1,402 (19.9%) |
| 90 or more Minutes | 420 (4.4%) | 522 (7.4%) |
Time of Departure to Work by Sex in Fort Lee borough
The most frequent times of departure to work in Fort Lee borough are 8:00 AM to 8:29 AM (1,441, 15.2%) for males and 7:30 AM to 7:59 AM (1,169, 16.6%) for females.
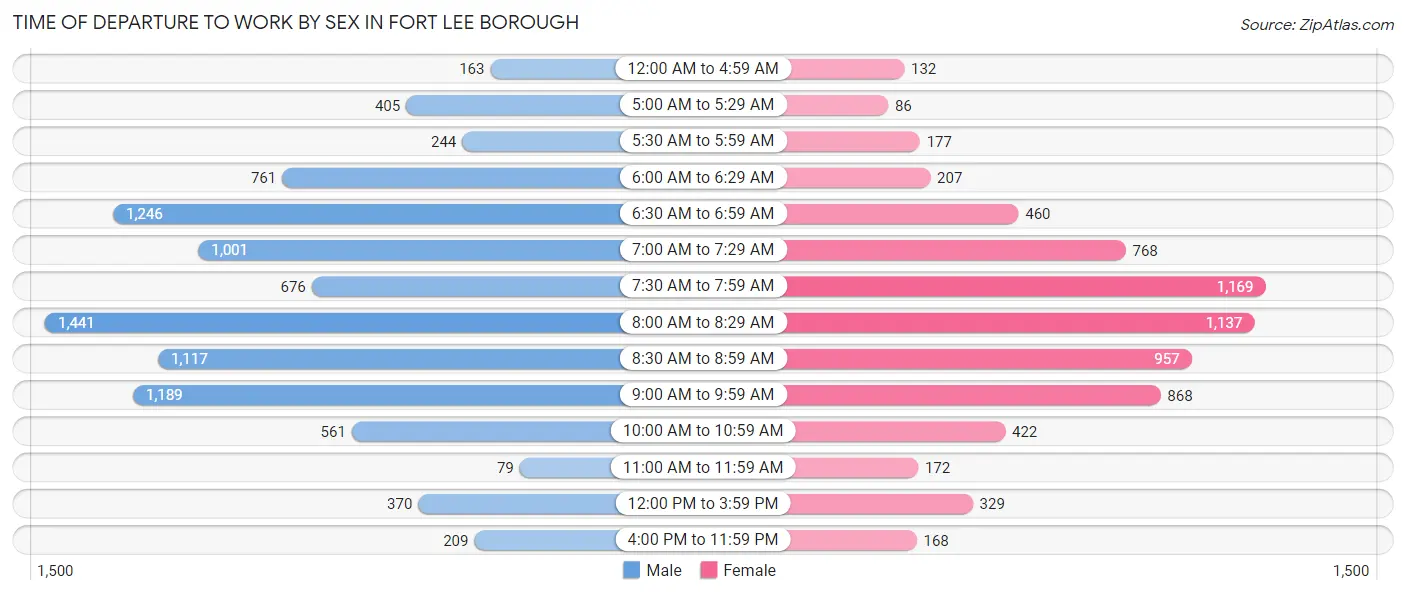
| Time of Departure | Male | Female |
| 12:00 AM to 4:59 AM | 163 (1.7%) | 132 (1.9%) |
| 5:00 AM to 5:29 AM | 405 (4.3%) | 86 (1.2%) |
| 5:30 AM to 5:59 AM | 244 (2.6%) | 177 (2.5%) |
| 6:00 AM to 6:29 AM | 761 (8.0%) | 207 (2.9%) |
| 6:30 AM to 6:59 AM | 1,246 (13.2%) | 460 (6.5%) |
| 7:00 AM to 7:29 AM | 1,001 (10.6%) | 768 (10.9%) |
| 7:30 AM to 7:59 AM | 676 (7.1%) | 1,169 (16.6%) |
| 8:00 AM to 8:29 AM | 1,441 (15.2%) | 1,137 (16.1%) |
| 8:30 AM to 8:59 AM | 1,117 (11.8%) | 957 (13.6%) |
| 9:00 AM to 9:59 AM | 1,189 (12.6%) | 868 (12.3%) |
| 10:00 AM to 10:59 AM | 561 (5.9%) | 422 (6.0%) |
| 11:00 AM to 11:59 AM | 79 (0.8%) | 172 (2.4%) |
| 12:00 PM to 3:59 PM | 370 (3.9%) | 329 (4.7%) |
| 4:00 PM to 11:59 PM | 209 (2.2%) | 168 (2.4%) |
| Total | 9,462 (100.0%) | 7,052 (100.0%) |
Housing Occupancy in Fort Lee borough
Occupancy by Ownership in Fort Lee borough
Of the total 18,312 dwellings in Fort Lee borough, owner-occupied units account for 10,694 (58.4%), while renter-occupied units make up 7,618 (41.6%).
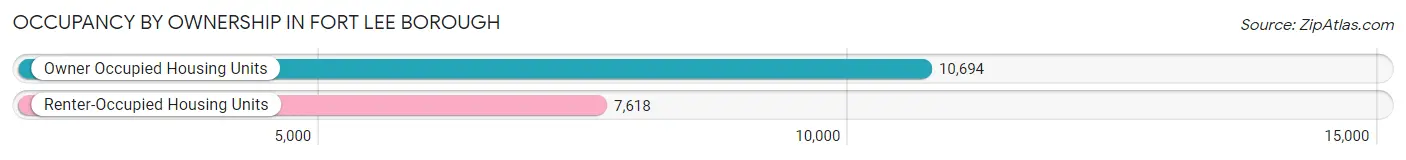
| Occupancy | # Housing Units | % Housing Units |
| Owner Occupied Housing Units | 10,694 | 58.4% |
| Renter-Occupied Housing Units | 7,618 | 41.6% |
| Total Occupied Housing Units | 18,312 | 100.0% |
Occupancy by Household Size in Fort Lee borough
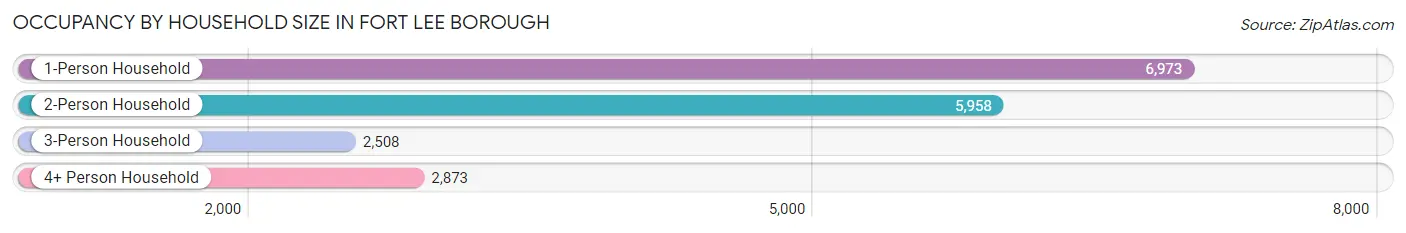
| Household Size | # Housing Units | % Housing Units |
| 1-Person Household | 6,973 | 38.1% |
| 2-Person Household | 5,958 | 32.5% |
| 3-Person Household | 2,508 | 13.7% |
| 4+ Person Household | 2,873 | 15.7% |
| Total Housing Units | 18,312 | 100.0% |
Occupancy by Ownership by Household Size in Fort Lee borough
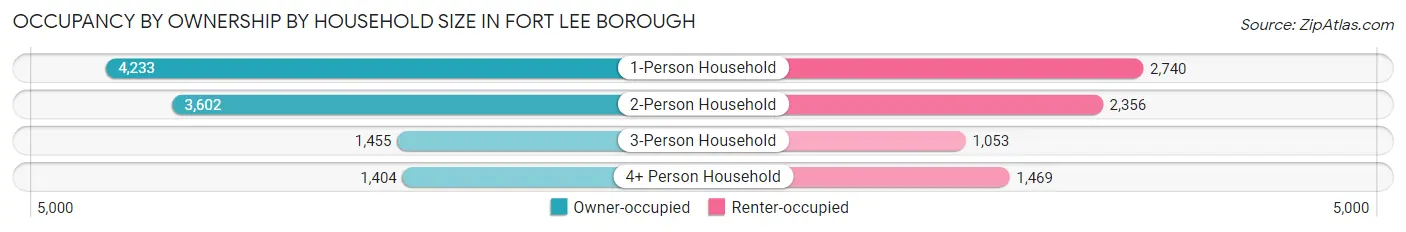
| Household Size | Owner-occupied | Renter-occupied |
| 1-Person Household | 4,233 (60.7%) | 2,740 (39.3%) |
| 2-Person Household | 3,602 (60.5%) | 2,356 (39.5%) |
| 3-Person Household | 1,455 (58.0%) | 1,053 (42.0%) |
| 4+ Person Household | 1,404 (48.9%) | 1,469 (51.1%) |
| Total Housing Units | 10,694 (58.4%) | 7,618 (41.6%) |
Occupancy by Educational Attainment in Fort Lee borough
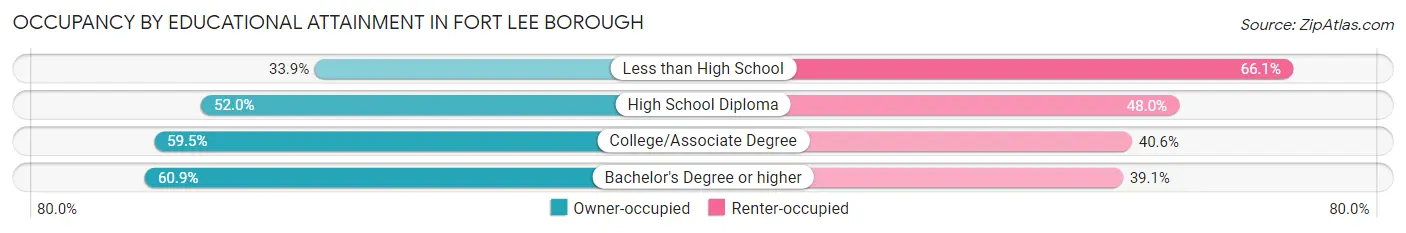
| Household Size | Owner-occupied | Renter-occupied |
| Less than High School | 248 (33.9%) | 483 (66.1%) |
| High School Diploma | 1,278 (52.0%) | 1,180 (48.0%) |
| College/Associate Degree | 1,742 (59.5%) | 1,188 (40.6%) |
| Bachelor's Degree or higher | 7,426 (60.9%) | 4,767 (39.1%) |
Occupancy by Age of Householder in Fort Lee borough
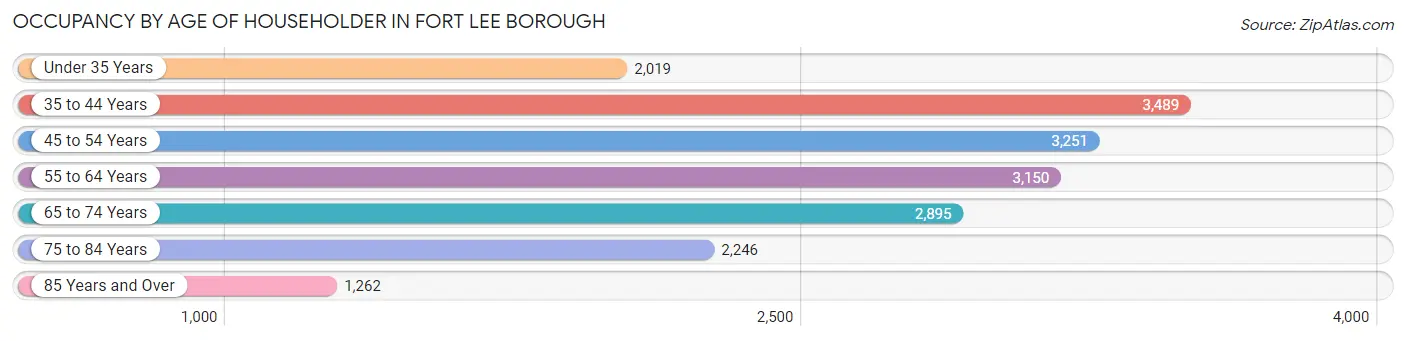
| Age Bracket | # Households | % Households |
| Under 35 Years | 2,019 | 11.0% |
| 35 to 44 Years | 3,489 | 19.1% |
| 45 to 54 Years | 3,251 | 17.7% |
| 55 to 64 Years | 3,150 | 17.2% |
| 65 to 74 Years | 2,895 | 15.8% |
| 75 to 84 Years | 2,246 | 12.3% |
| 85 Years and Over | 1,262 | 6.9% |
| Total | 18,312 | 100.0% |
Housing Finances in Fort Lee borough
Median Income by Occupancy in Fort Lee borough
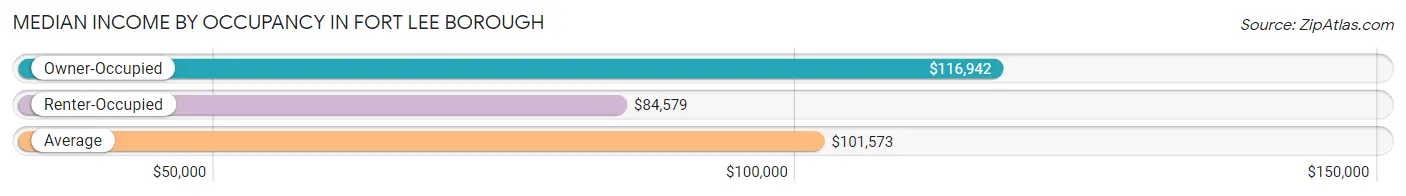
| Occupancy Type | # Households | Median Income |
| Owner-Occupied | 10,694 (58.4%) | $116,942 |
| Renter-Occupied | 7,618 (41.6%) | $84,579 |
| Average | 18,312 (100.0%) | $101,573 |
Occupancy by Householder Income Bracket in Fort Lee borough
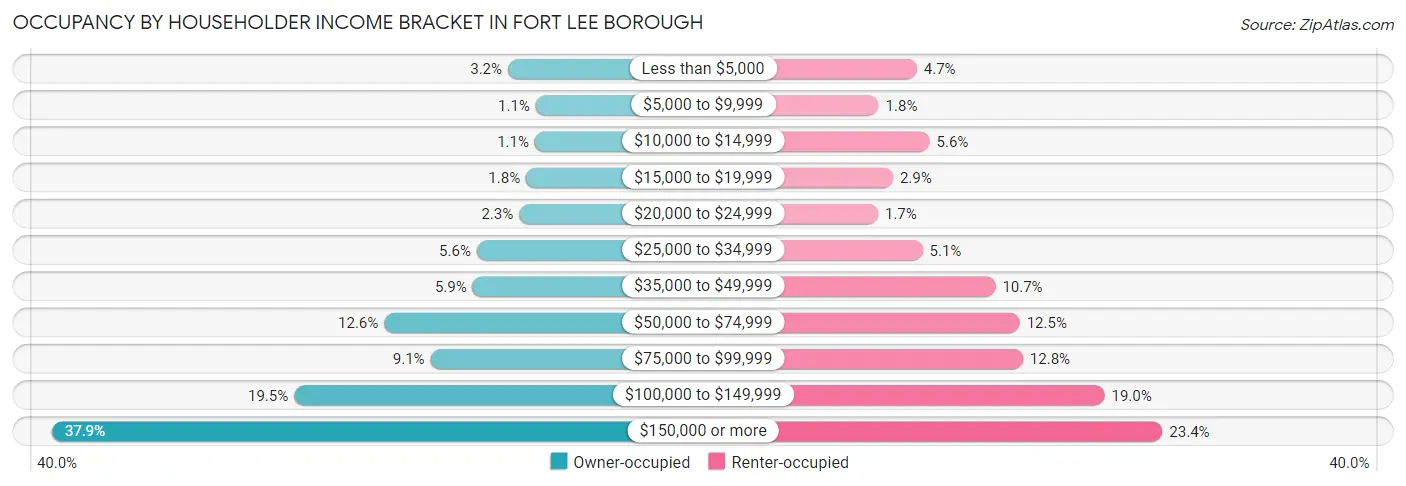
| Income Bracket | Owner-occupied | Renter-occupied |
| Less than $5,000 | 340 (3.2%) | 356 (4.7%) |
| $5,000 to $9,999 | 113 (1.1%) | 134 (1.8%) |
| $10,000 to $14,999 | 121 (1.1%) | 430 (5.6%) |
| $15,000 to $19,999 | 193 (1.8%) | 217 (2.9%) |
| $20,000 to $24,999 | 249 (2.3%) | 130 (1.7%) |
| $25,000 to $34,999 | 594 (5.6%) | 389 (5.1%) |
| $35,000 to $49,999 | 628 (5.9%) | 812 (10.7%) |
| $50,000 to $74,999 | 1,348 (12.6%) | 953 (12.5%) |
| $75,000 to $99,999 | 971 (9.1%) | 971 (12.8%) |
| $100,000 to $149,999 | 2,082 (19.5%) | 1,445 (19.0%) |
| $150,000 or more | 4,055 (37.9%) | 1,781 (23.4%) |
| Total | 10,694 (100.0%) | 7,618 (100.0%) |
Monthly Housing Cost Tiers in Fort Lee borough
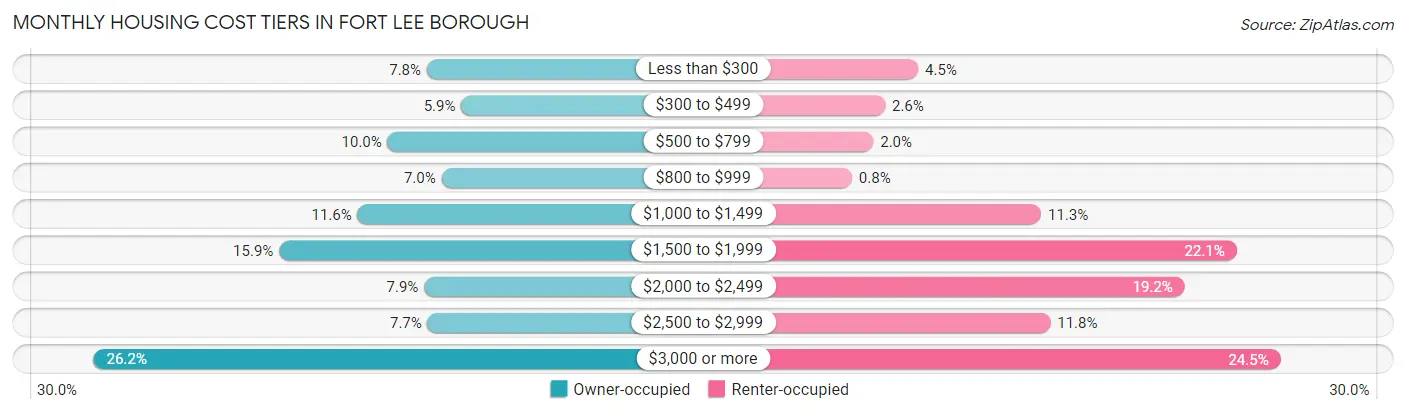
| Monthly Cost | Owner-occupied | Renter-occupied |
| Less than $300 | 832 (7.8%) | 340 (4.5%) |
| $300 to $499 | 629 (5.9%) | 200 (2.6%) |
| $500 to $799 | 1,064 (10.0%) | 151 (2.0%) |
| $800 to $999 | 745 (7.0%) | 61 (0.8%) |
| $1,000 to $1,499 | 1,242 (11.6%) | 857 (11.3%) |
| $1,500 to $1,999 | 1,705 (15.9%) | 1,680 (22.1%) |
| $2,000 to $2,499 | 848 (7.9%) | 1,461 (19.2%) |
| $2,500 to $2,999 | 828 (7.7%) | 896 (11.8%) |
| $3,000 or more | 2,801 (26.2%) | 1,864 (24.5%) |
| Total | 10,694 (100.0%) | 7,618 (100.0%) |
Physical Housing Characteristics in Fort Lee borough
Housing Structures in Fort Lee borough
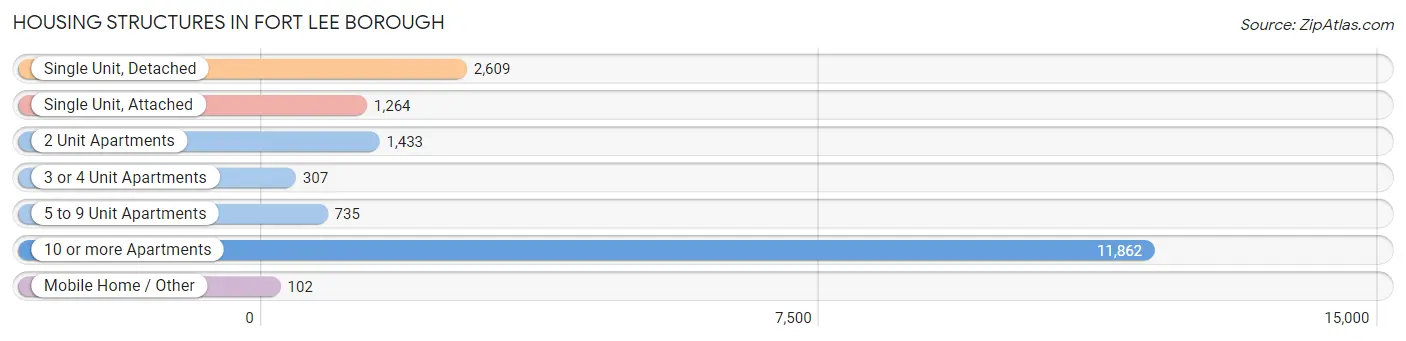
| Structure Type | # Housing Units | % Housing Units |
| Single Unit, Detached | 2,609 | 14.2% |
| Single Unit, Attached | 1,264 | 6.9% |
| 2 Unit Apartments | 1,433 | 7.8% |
| 3 or 4 Unit Apartments | 307 | 1.7% |
| 5 to 9 Unit Apartments | 735 | 4.0% |
| 10 or more Apartments | 11,862 | 64.8% |
| Mobile Home / Other | 102 | 0.6% |
| Total | 18,312 | 100.0% |
Housing Structures by Occupancy in Fort Lee borough
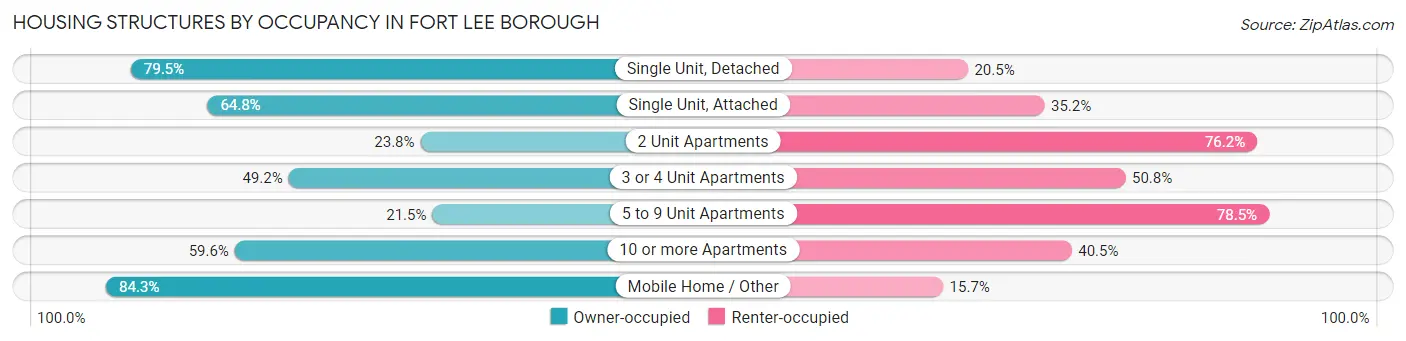
| Structure Type | Owner-occupied | Renter-occupied |
| Single Unit, Detached | 2,075 (79.5%) | 534 (20.5%) |
| Single Unit, Attached | 819 (64.8%) | 445 (35.2%) |
| 2 Unit Apartments | 341 (23.8%) | 1,092 (76.2%) |
| 3 or 4 Unit Apartments | 151 (49.2%) | 156 (50.8%) |
| 5 to 9 Unit Apartments | 158 (21.5%) | 577 (78.5%) |
| 10 or more Apartments | 7,064 (59.6%) | 4,798 (40.5%) |
| Mobile Home / Other | 86 (84.3%) | 16 (15.7%) |
| Total | 10,694 (58.4%) | 7,618 (41.6%) |
Housing Structures by Number of Rooms in Fort Lee borough
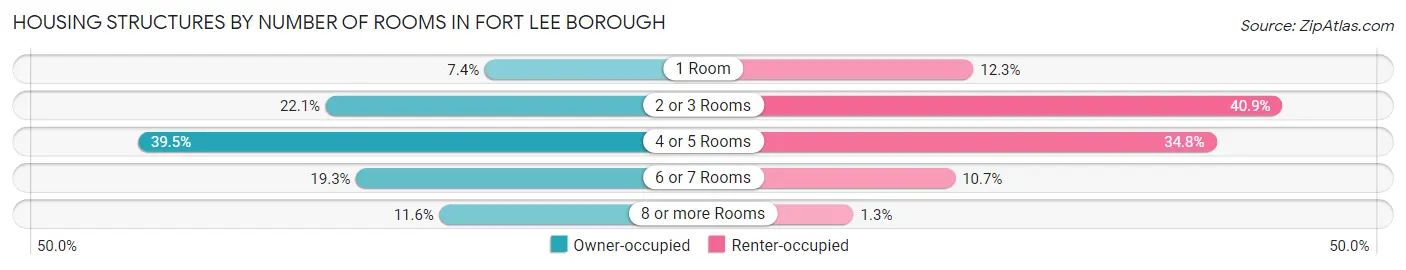
| Number of Rooms | Owner-occupied | Renter-occupied |
| 1 Room | 793 (7.4%) | 940 (12.3%) |
| 2 or 3 Rooms | 2,367 (22.1%) | 3,117 (40.9%) |
| 4 or 5 Rooms | 4,227 (39.5%) | 2,652 (34.8%) |
| 6 or 7 Rooms | 2,065 (19.3%) | 812 (10.7%) |
| 8 or more Rooms | 1,242 (11.6%) | 97 (1.3%) |
| Total | 10,694 (100.0%) | 7,618 (100.0%) |
Housing Structure by Heating Type in Fort Lee borough
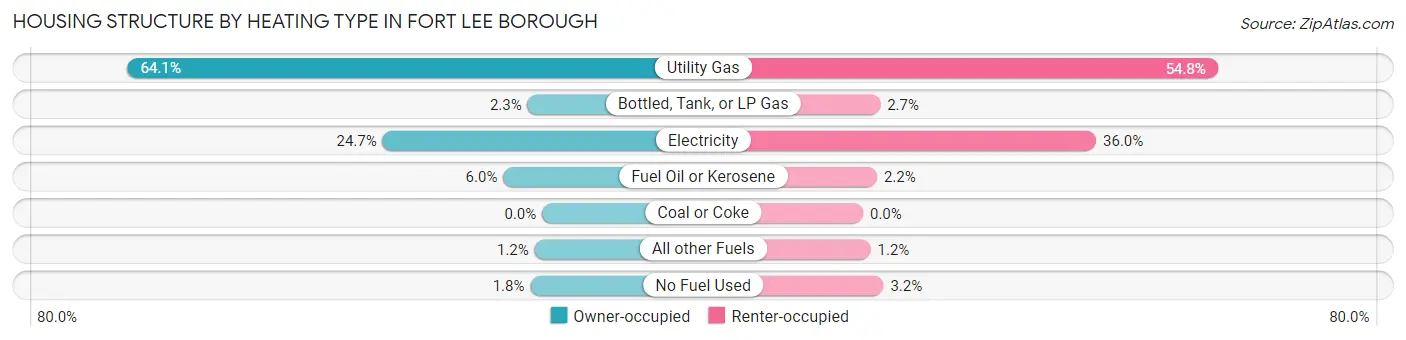
| Heating Type | Owner-occupied | Renter-occupied |
| Utility Gas | 6,854 (64.1%) | 4,176 (54.8%) |
| Bottled, Tank, or LP Gas | 241 (2.2%) | 203 (2.7%) |
| Electricity | 2,637 (24.7%) | 2,745 (36.0%) |
| Fuel Oil or Kerosene | 643 (6.0%) | 164 (2.1%) |
| Coal or Coke | 0 (0.0%) | 0 (0.0%) |
| All other Fuels | 124 (1.2%) | 89 (1.2%) |
| No Fuel Used | 195 (1.8%) | 241 (3.2%) |
| Total | 10,694 (100.0%) | 7,618 (100.0%) |
Household Vehicle Usage in Fort Lee borough
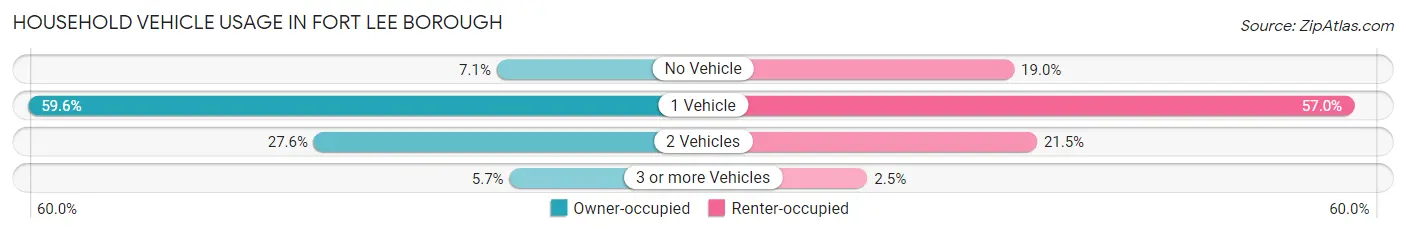
| Vehicles per Household | Owner-occupied | Renter-occupied |
| No Vehicle | 760 (7.1%) | 1,444 (19.0%) |
| 1 Vehicle | 6,373 (59.6%) | 4,343 (57.0%) |
| 2 Vehicles | 2,952 (27.6%) | 1,639 (21.5%) |
| 3 or more Vehicles | 609 (5.7%) | 192 (2.5%) |
| Total | 10,694 (100.0%) | 7,618 (100.0%) |
Real Estate & Mortgages in Fort Lee borough
Real Estate and Mortgage Overview in Fort Lee borough
| Characteristic | Without Mortgage | With Mortgage |
| Housing Units | 6,555 | 4,139 |
| Median Property Value | $312,200 | $486,800 |
| Median Household Income | $96,690 | $2,202 |
| Monthly Housing Costs | $1,236 | $2,289 |
| Real Estate Taxes | $7,061 | $345 |
Property Value by Mortgage Status in Fort Lee borough
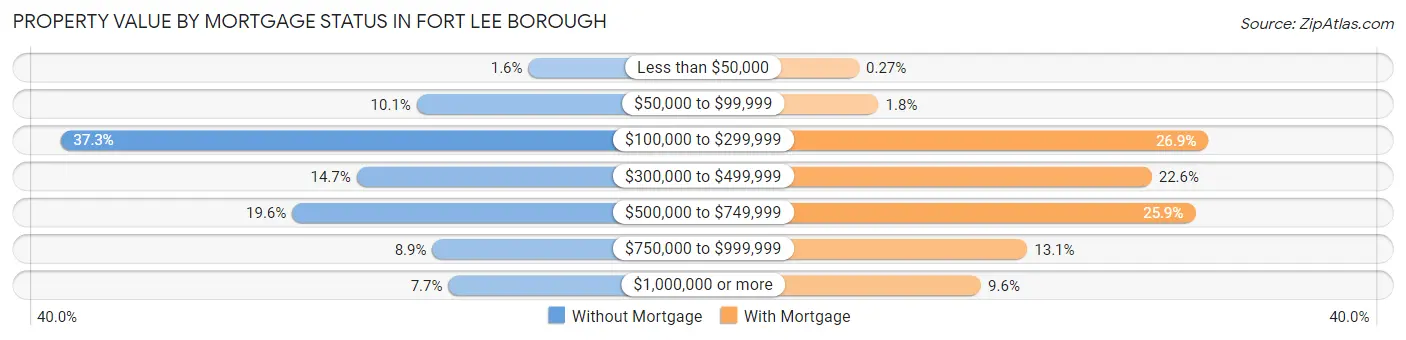
| Property Value | Without Mortgage | With Mortgage |
| Less than $50,000 | 106 (1.6%) | 11 (0.3%) |
| $50,000 to $99,999 | 664 (10.1%) | 73 (1.8%) |
| $100,000 to $299,999 | 2,443 (37.3%) | 1,112 (26.9%) |
| $300,000 to $499,999 | 964 (14.7%) | 934 (22.6%) |
| $500,000 to $749,999 | 1,286 (19.6%) | 1,071 (25.9%) |
| $750,000 to $999,999 | 586 (8.9%) | 542 (13.1%) |
| $1,000,000 or more | 506 (7.7%) | 396 (9.6%) |
| Total | 6,555 (100.0%) | 4,139 (100.0%) |
Household Income by Mortgage Status in Fort Lee borough
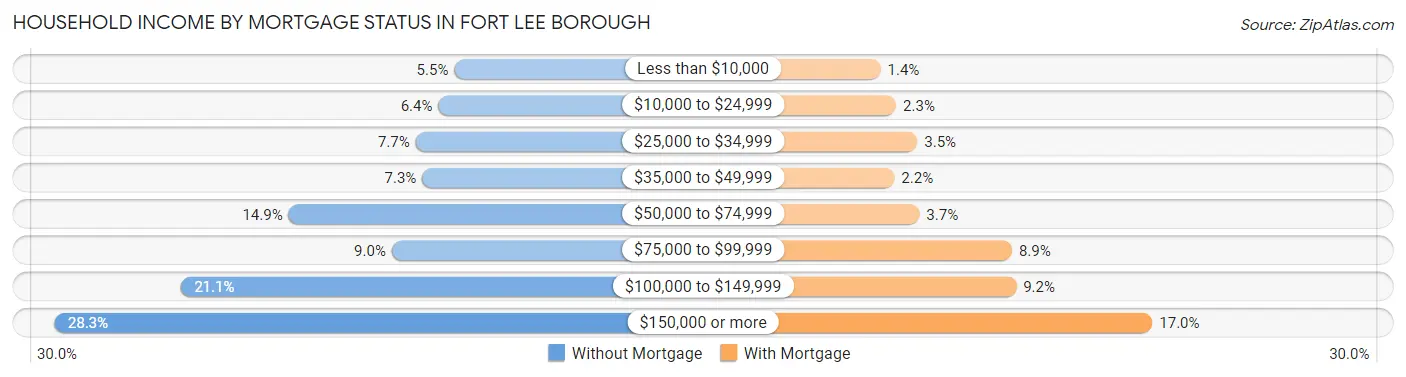
| Household Income | Without Mortgage | With Mortgage |
| Less than $10,000 | 357 (5.4%) | 59 (1.4%) |
| $10,000 to $24,999 | 417 (6.4%) | 96 (2.3%) |
| $25,000 to $34,999 | 502 (7.7%) | 146 (3.5%) |
| $35,000 to $49,999 | 477 (7.3%) | 92 (2.2%) |
| $50,000 to $74,999 | 978 (14.9%) | 151 (3.6%) |
| $75,000 to $99,999 | 591 (9.0%) | 370 (8.9%) |
| $100,000 to $149,999 | 1,380 (21.0%) | 380 (9.2%) |
| $150,000 or more | 1,853 (28.3%) | 702 (17.0%) |
| Total | 6,555 (100.0%) | 4,139 (100.0%) |
Property Value to Household Income Ratio in Fort Lee borough
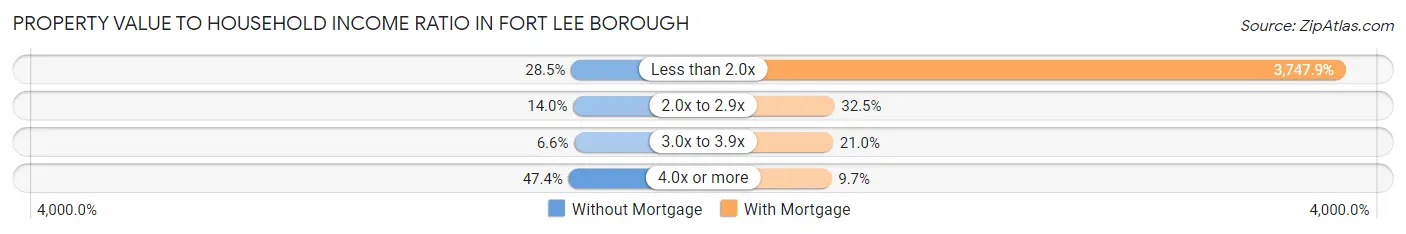
| Value-to-Income Ratio | Without Mortgage | With Mortgage |
| Less than 2.0x | 1,865 (28.4%) | 155,125 (3,747.9%) |
| 2.0x to 2.9x | 919 (14.0%) | 1,344 (32.5%) |
| 3.0x to 3.9x | 433 (6.6%) | 870 (21.0%) |
| 4.0x or more | 3,110 (47.4%) | 403 (9.7%) |
| Total | 6,555 (100.0%) | 4,139 (100.0%) |
Real Estate Taxes by Mortgage Status in Fort Lee borough
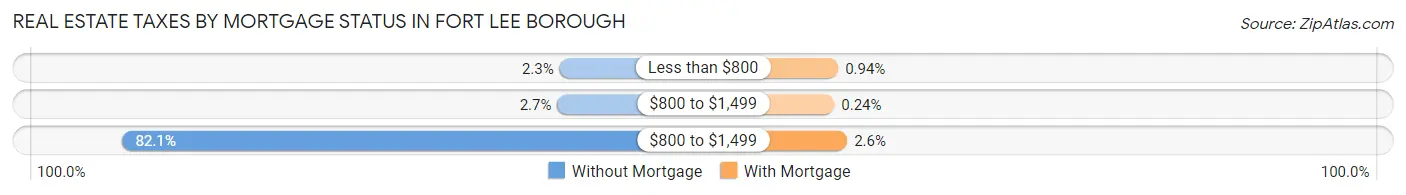
| Property Taxes | Without Mortgage | With Mortgage |
| Less than $800 | 151 (2.3%) | 39 (0.9%) |
| $800 to $1,499 | 177 (2.7%) | 10 (0.2%) |
| $800 to $1,499 | 5,383 (82.1%) | 107 (2.6%) |
| Total | 6,555 (100.0%) | 4,139 (100.0%) |
Health & Disability in Fort Lee borough
Health Insurance Coverage by Age in Fort Lee borough
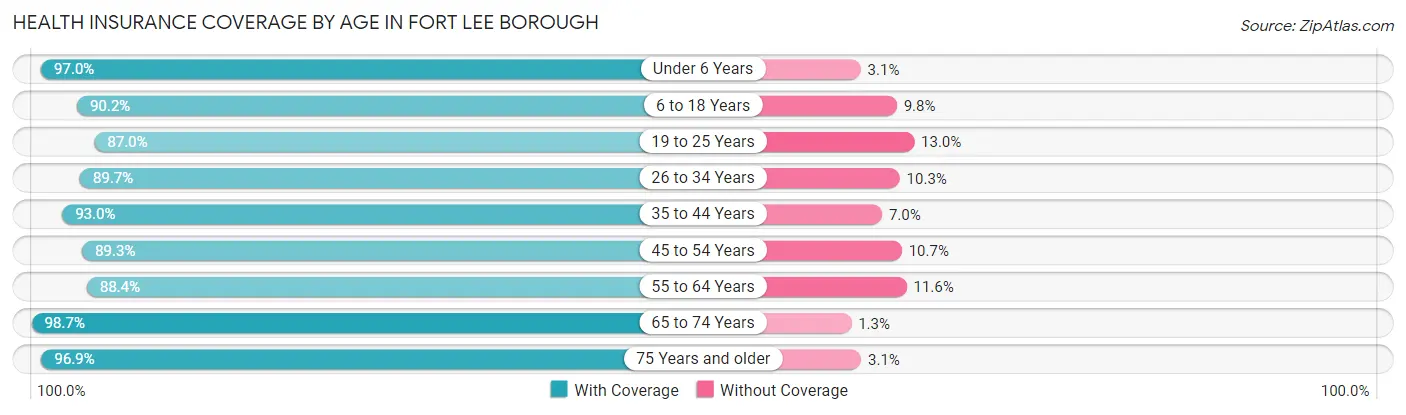
| Age Bracket | With Coverage | Without Coverage |
| Under 6 Years | 2,451 (97.0%) | 77 (3.0%) |
| 6 to 18 Years | 4,267 (90.2%) | 462 (9.8%) |
| 19 to 25 Years | 1,516 (87.0%) | 227 (13.0%) |
| 26 to 34 Years | 3,460 (89.7%) | 398 (10.3%) |
| 35 to 44 Years | 5,652 (93.0%) | 427 (7.0%) |
| 45 to 54 Years | 5,053 (89.3%) | 606 (10.7%) |
| 55 to 64 Years | 4,608 (88.4%) | 605 (11.6%) |
| 65 to 74 Years | 4,511 (98.7%) | 59 (1.3%) |
| 75 Years and older | 5,194 (96.9%) | 168 (3.1%) |
| Total | 36,712 (92.4%) | 3,029 (7.6%) |
Health Insurance Coverage by Citizenship Status in Fort Lee borough
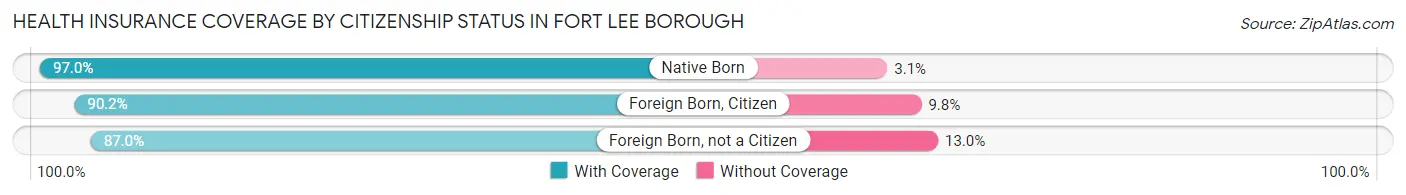
| Citizenship Status | With Coverage | Without Coverage |
| Native Born | 2,451 (97.0%) | 77 (3.0%) |
| Foreign Born, Citizen | 4,267 (90.2%) | 462 (9.8%) |
| Foreign Born, not a Citizen | 1,516 (87.0%) | 227 (13.0%) |
Health Insurance Coverage by Household Income in Fort Lee borough
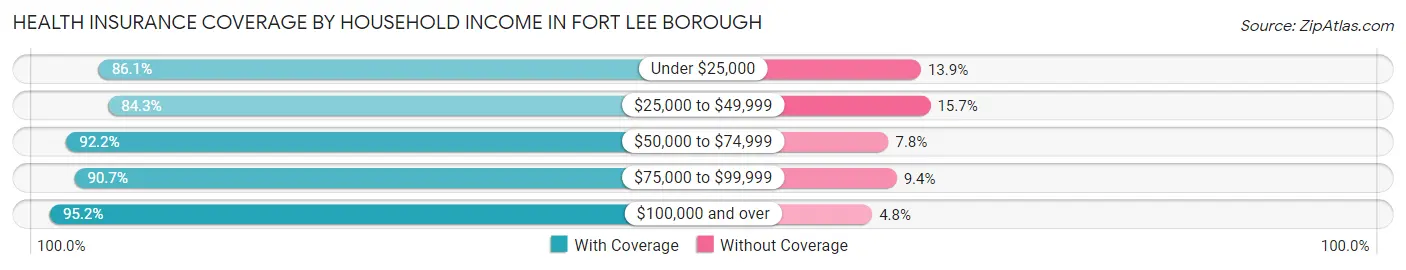
| Household Income | With Coverage | Without Coverage |
| Under $25,000 | 2,904 (86.1%) | 469 (13.9%) |
| $25,000 to $49,999 | 3,962 (84.3%) | 737 (15.7%) |
| $50,000 to $74,999 | 3,996 (92.2%) | 339 (7.8%) |
| $75,000 to $99,999 | 3,615 (90.6%) | 373 (9.3%) |
| $100,000 and over | 22,225 (95.2%) | 1,111 (4.8%) |
Public vs Private Health Insurance Coverage by Age in Fort Lee borough
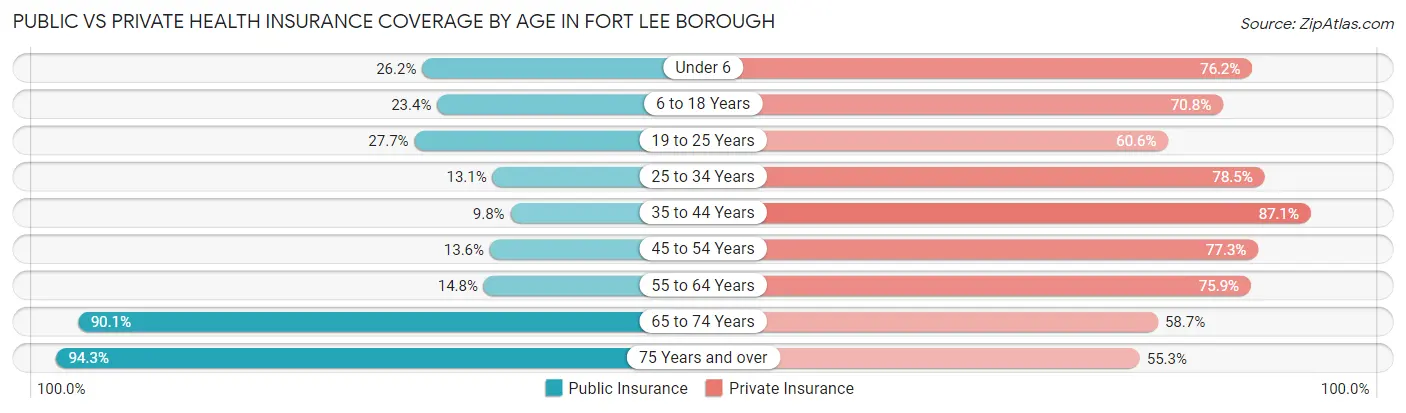
| Age Bracket | Public Insurance | Private Insurance |
| Under 6 | 662 (26.2%) | 1,926 (76.2%) |
| 6 to 18 Years | 1,107 (23.4%) | 3,346 (70.8%) |
| 19 to 25 Years | 482 (27.7%) | 1,056 (60.6%) |
| 25 to 34 Years | 507 (13.1%) | 3,027 (78.5%) |
| 35 to 44 Years | 597 (9.8%) | 5,292 (87.1%) |
| 45 to 54 Years | 772 (13.6%) | 4,373 (77.3%) |
| 55 to 64 Years | 770 (14.8%) | 3,959 (75.9%) |
| 65 to 74 Years | 4,119 (90.1%) | 2,682 (58.7%) |
| 75 Years and over | 5,054 (94.3%) | 2,966 (55.3%) |
| Total | 14,070 (35.4%) | 28,627 (72.0%) |
Disability Status by Sex by Age in Fort Lee borough
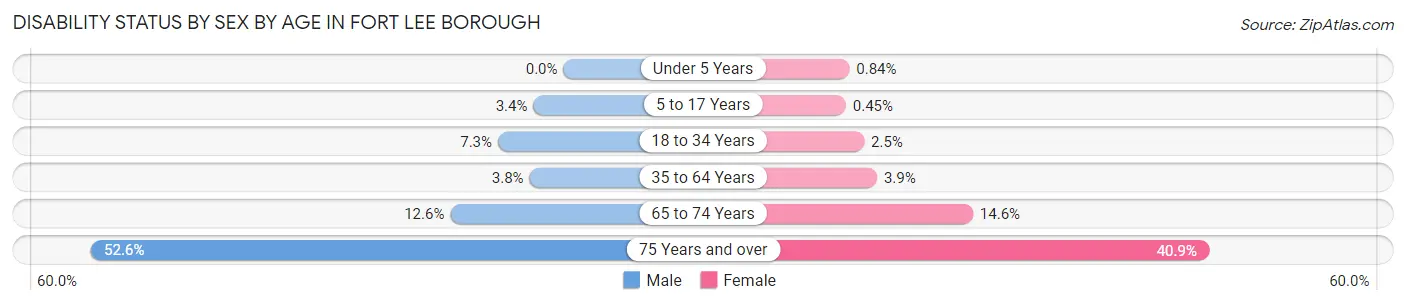
| Age Bracket | Male | Female |
| Under 5 Years | 0 (0.0%) | 9 (0.8%) |
| 5 to 17 Years | 84 (3.4%) | 10 (0.4%) |
| 18 to 34 Years | 223 (7.3%) | 71 (2.5%) |
| 35 to 64 Years | 320 (3.8%) | 333 (3.9%) |
| 65 to 74 Years | 273 (12.6%) | 351 (14.6%) |
| 75 Years and over | 1,027 (52.6%) | 1,393 (40.9%) |
Disability Class by Sex by Age in Fort Lee borough
Disability Class: Hearing Difficulty
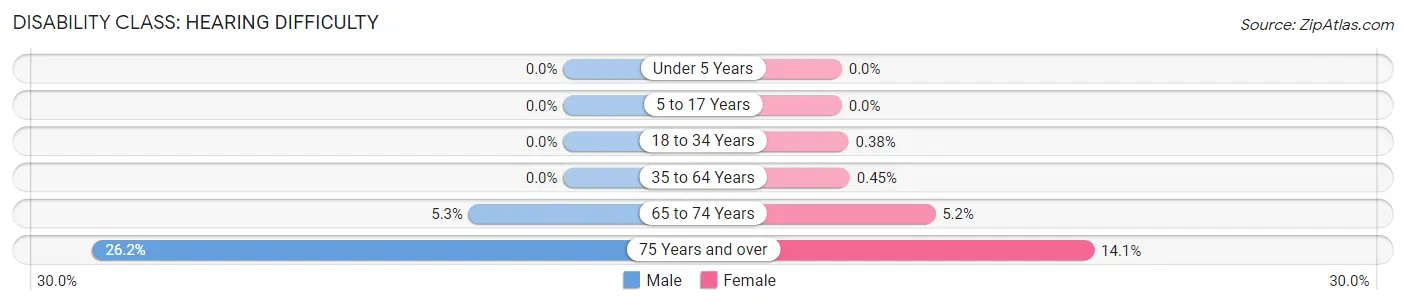
| Age Bracket | Male | Female |
| Under 5 Years | 0 (0.0%) | 0 (0.0%) |
| 5 to 17 Years | 0 (0.0%) | 0 (0.0%) |
| 18 to 34 Years | 0 (0.0%) | 11 (0.4%) |
| 35 to 64 Years | 0 (0.0%) | 38 (0.4%) |
| 65 to 74 Years | 114 (5.3%) | 125 (5.2%) |
| 75 Years and over | 512 (26.2%) | 479 (14.1%) |
Disability Class: Vision Difficulty
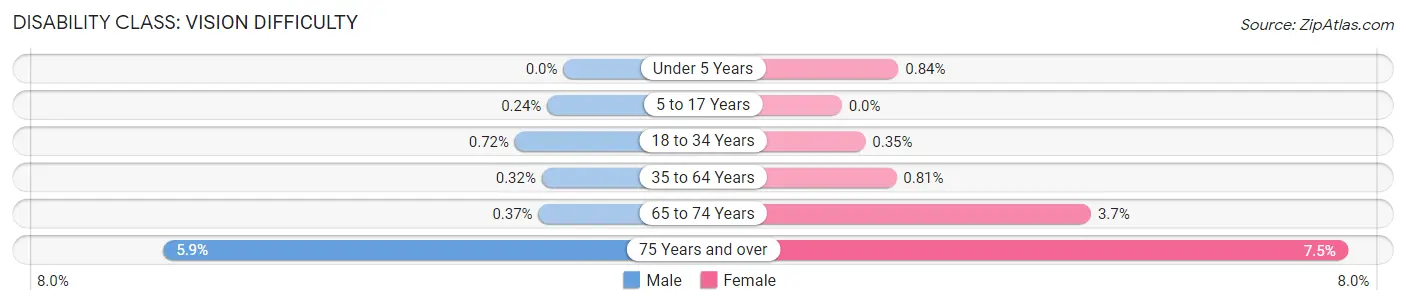
| Age Bracket | Male | Female |
| Under 5 Years | 0 (0.0%) | 9 (0.8%) |
| 5 to 17 Years | 6 (0.2%) | 0 (0.0%) |
| 18 to 34 Years | 22 (0.7%) | 10 (0.4%) |
| 35 to 64 Years | 27 (0.3%) | 69 (0.8%) |
| 65 to 74 Years | 8 (0.4%) | 89 (3.7%) |
| 75 Years and over | 116 (5.9%) | 256 (7.5%) |
Disability Class: Cognitive Difficulty
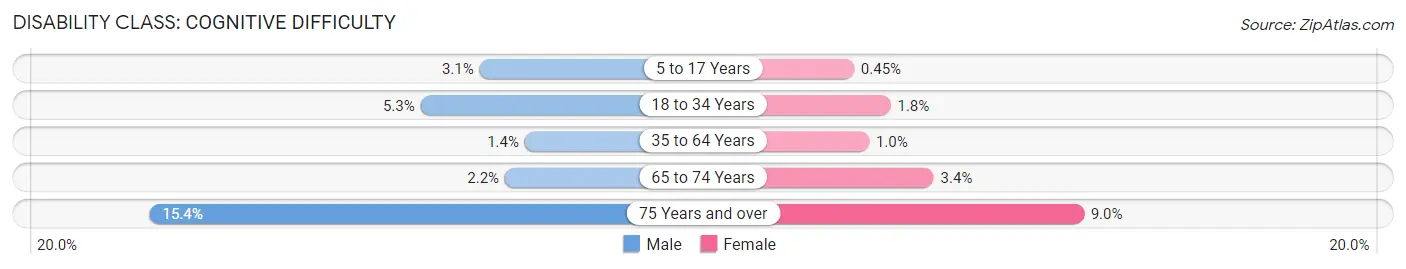
| Age Bracket | Male | Female |
| 5 to 17 Years | 78 (3.1%) | 10 (0.4%) |
| 18 to 34 Years | 162 (5.3%) | 52 (1.8%) |
| 35 to 64 Years | 121 (1.4%) | 86 (1.0%) |
| 65 to 74 Years | 47 (2.2%) | 82 (3.4%) |
| 75 Years and over | 300 (15.4%) | 306 (9.0%) |
Disability Class: Ambulatory Difficulty
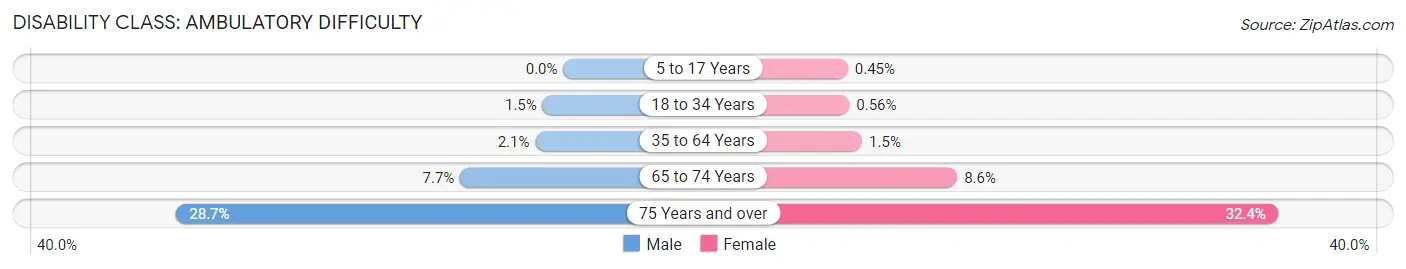
| Age Bracket | Male | Female |
| 5 to 17 Years | 0 (0.0%) | 10 (0.4%) |
| 18 to 34 Years | 47 (1.5%) | 16 (0.6%) |
| 35 to 64 Years | 176 (2.1%) | 128 (1.5%) |
| 65 to 74 Years | 166 (7.7%) | 206 (8.6%) |
| 75 Years and over | 561 (28.7%) | 1,103 (32.4%) |
Disability Class: Self-Care Difficulty
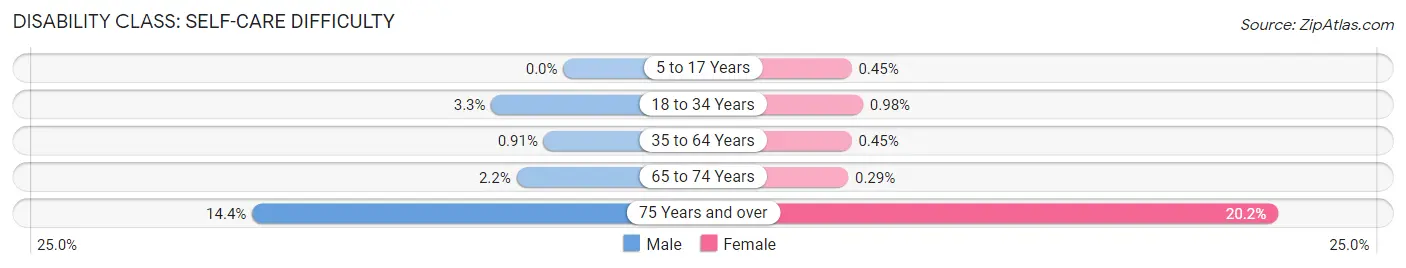
| Age Bracket | Male | Female |
| 5 to 17 Years | 0 (0.0%) | 10 (0.4%) |
| 18 to 34 Years | 102 (3.3%) | 28 (1.0%) |
| 35 to 64 Years | 77 (0.9%) | 38 (0.4%) |
| 65 to 74 Years | 47 (2.2%) | 7 (0.3%) |
| 75 Years and over | 282 (14.4%) | 690 (20.2%) |
Technology Access in Fort Lee borough
Computing Device Access in Fort Lee borough
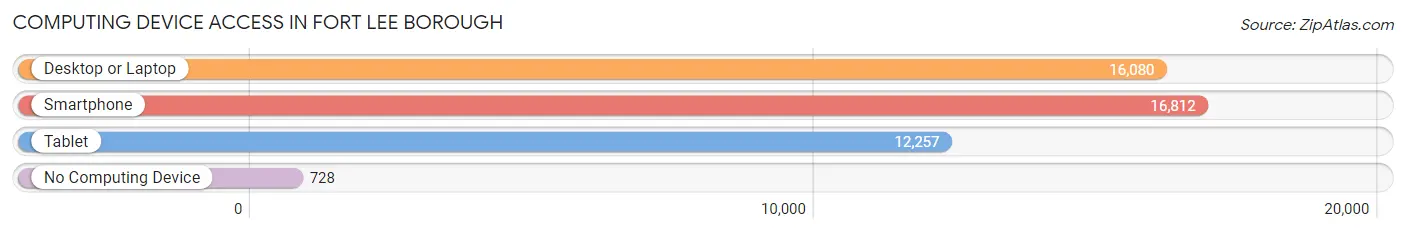
| Device Type | # Households | % Households |
| Desktop or Laptop | 16,080 | 87.8% |
| Smartphone | 16,812 | 91.8% |
| Tablet | 12,257 | 66.9% |
| No Computing Device | 728 | 4.0% |
| Total | 18,312 | 100.0% |
Internet Access in Fort Lee borough
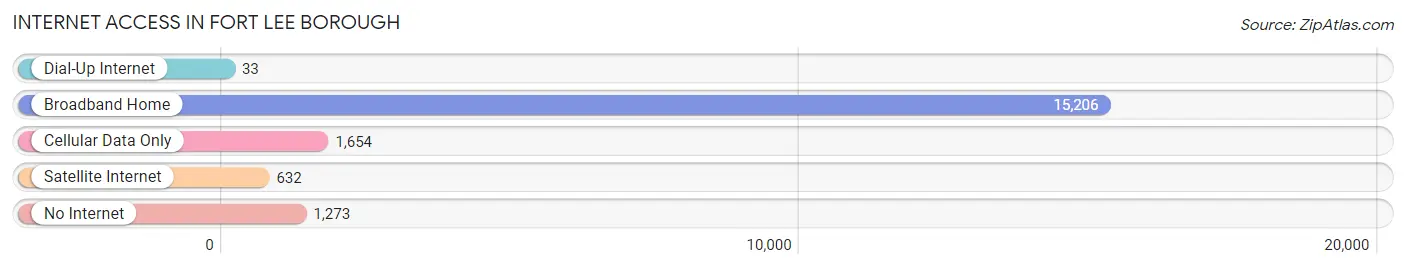
| Internet Type | # Households | % Households |
| Dial-Up Internet | 33 | 0.2% |
| Broadband Home | 15,206 | 83.0% |
| Cellular Data Only | 1,654 | 9.0% |
| Satellite Internet | 632 | 3.5% |
| No Internet | 1,273 | 7.0% |
| Total | 18,312 | 100.0% |
Fort Lee borough Summary
Fort Lee Borough is a borough located in Bergen County, New Jersey, United States. As of the 2010 United States Census, the borough had a population of 35,345, reflecting an increase of 3,464 (+10.9%) from the 31,881 counted in the 2000 Census, which had in turn increased by 5,528 (+20.7%) from the 26,353 counted in the 1990 Census.
History
Fort Lee was formed by an act of the New Jersey Legislature on March 29, 1904, from the remaining portions of Ridgefield Township. With the creation of Fort Lee, Ridgefield Township was dissolved. The borough was named for General Charles Lee, the second-in-command of the Continental Army during the Revolutionary War.
Geography
Fort Lee is located atop the Hudson Palisades, the northern part of the New Jersey Palisades. The borough is situated atop a bluff on the west bank of the Hudson River, overlooking the George Washington Bridge, which connects Fort Lee to Manhattan. The borough is bisected by the confluence of roads at GWB Plaza leading to the George Washington Bridge. Unincorporated communities, localities and place names located partially or completely within the borough include Coytesville, Grantwood and Taylorville.
The borough borders the Bergen County municipalities of Cliffside Park, Edgewater, Englewood, Englewood Cliffs, Leonia, Palisades Park, Ridgefield and Teaneck.
Demographics
As of the 2010 United States Census, there were 35,345 people, 15,632 households, and 8,717.945 families residing in the borough. The population density was 11,837.3 per square mile (4,567.2/km2). There were 16,364 housing units at an average density of 5,427.2 per square mile (2,097.7/km2). The racial makeup of the borough was 64.2% (22,845) White, 1.6% (564) Black or African American, 0.2% (68) Native American, 29.5% (10,406) Asian, 0.0% (13) Pacific Islander, 2.8% (976) from other races, and 2.0% (717) from two or more races. Hispanic or Latino of any race were 11.0% (3,876) of the population.
Economy
Fort Lee is home to many corporate headquarters, including Unilever, Toys "R" Us, and Hudson News. The borough is also home to the headquarters of the Port Authority of New York and New Jersey, which operates the George Washington Bridge, the Lincoln Tunnel, and other regional transportation facilities.
Fort Lee is also home to a number of shopping centers, including the Fort Lee Shopping Center, the Palisades Center, and the Shops at Riverside. The borough is also home to a number of restaurants, including the popular Italian restaurant, La Dolce Vita.
Conclusion
Fort Lee is a borough located in Bergen County, New Jersey, United States. As of the 2010 United States Census, the borough had a population of 35,345. The borough was named for General Charles Lee, the second-in-command of the Continental Army during the Revolutionary War. Fort Lee is located atop the Hudson Palisades, the northern part of the New Jersey Palisades. The borough is situated atop a bluff on the west bank of the Hudson River, overlooking the George Washington Bridge, which connects Fort Lee to Manhattan. The borough is home to many corporate headquarters, including Unilever, Toys "R" Us, and Hudson News. The borough is also home to a number of shopping centers, restaurants, and other businesses. Fort Lee is a vibrant and diverse community that offers its residents a variety of amenities and attractions.
Common Questions
What is Per Capita Income in Fort Lee borough?
Per Capita income in Fort Lee borough is $62,802.
What is the Median Family Income in Fort Lee borough?
Median Family Income in Fort Lee borough is $127,906.
What is the Median Household income in Fort Lee borough?
Median Household Income in Fort Lee borough is $101,573.
What is Income or Wage Gap in Fort Lee borough?
Income or Wage Gap in Fort Lee borough is 27.4%.
Women in Fort Lee borough earn 72.6 cents for every dollar earned by a man.
What is Inequality or Gini Index in Fort Lee borough?
Inequality or Gini Index in Fort Lee borough is 0.47.
What is the Total Population of Fort Lee borough?
Total Population of Fort Lee borough is 39,799.
What is the Total Male Population of Fort Lee borough?
Total Male Population of Fort Lee borough is 19,356.
What is the Total Female Population of Fort Lee borough?
Total Female Population of Fort Lee borough is 20,443.
What is the Ratio of Males per 100 Females in Fort Lee borough?
There are 94.68 Males per 100 Females in Fort Lee borough.
What is the Ratio of Females per 100 Males in Fort Lee borough?
There are 105.62 Females per 100 Males in Fort Lee borough.
What is the Median Population Age in Fort Lee borough?
Median Population Age in Fort Lee borough is 46.6 Years.
What is the Average Family Size in Fort Lee borough
Average Family Size in Fort Lee borough is 2.9 People.
What is the Average Household Size in Fort Lee borough
Average Household Size in Fort Lee borough is 2.2 People.
How Large is the Labor Force in Fort Lee borough?
There are 20,909 People in the Labor Forcein in Fort Lee borough.
What is the Percentage of People in the Labor Force in Fort Lee borough?
62.1% of People are in the Labor Force in Fort Lee borough.
What is the Unemployment Rate in Fort Lee borough?
Unemployment Rate in Fort Lee borough is 4.8%.