Cities with the Highest Percentage of Asian Population in Iowa
RELATED REPORTS & OPTIONS
Asian
Iowa
Compare Cities
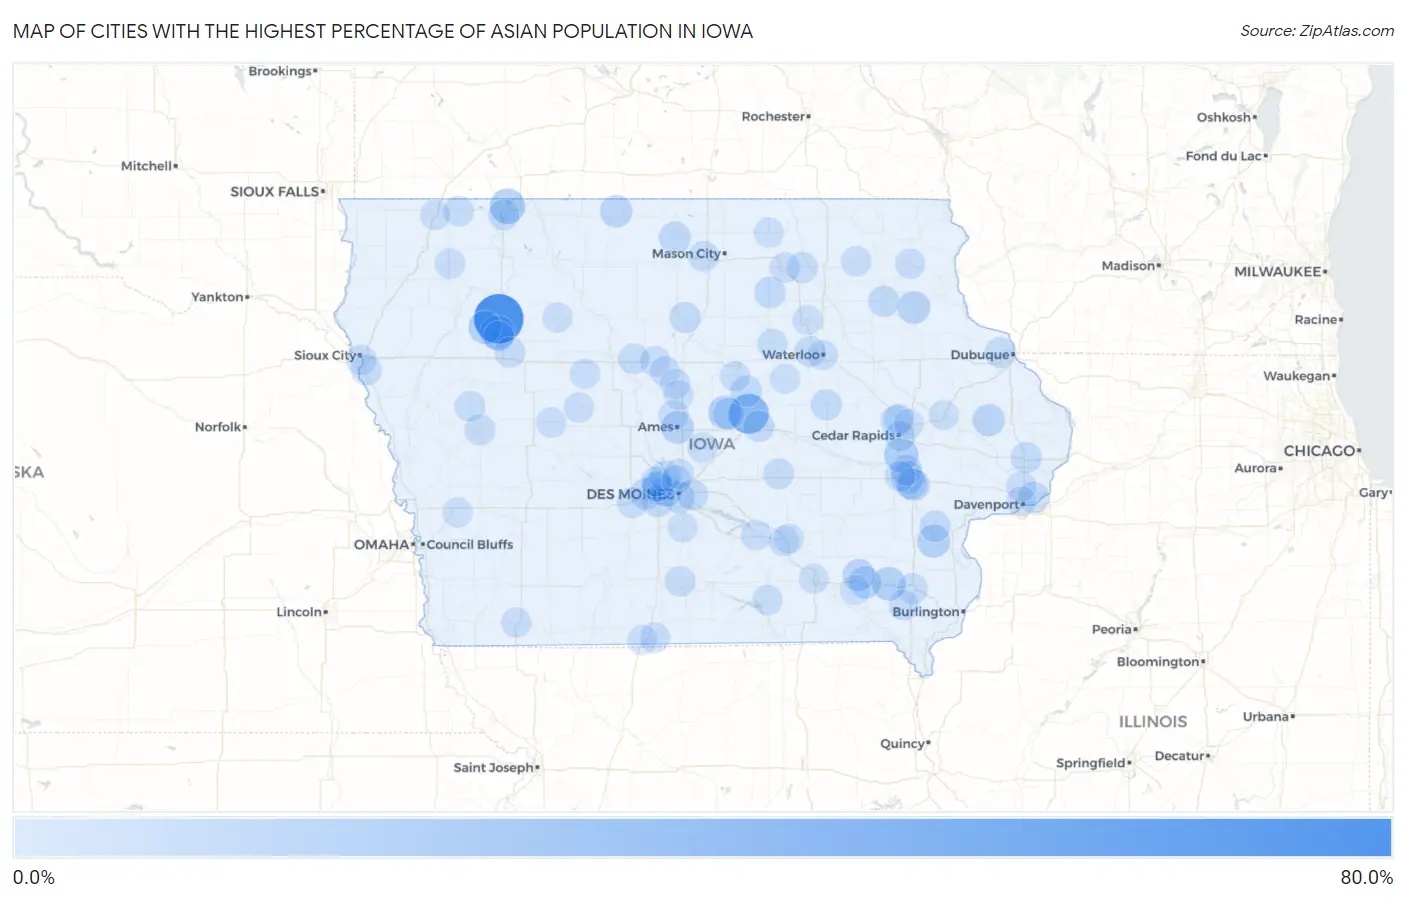
Map of Cities with the Highest Percentage of Asian Population in Iowa
0.0%
80.0%
Cities with the Highest Percentage of Asian Population in Iowa
| City | Asian | vs State | vs National | |
| 1. | Truesdale | 65.2% | 2.5%(+62.8)#1 | 5.8%(+59.5)#22 |
| 2. | Albion | 33.4% | 2.5%(+30.9)#2 | 5.8%(+27.6)#219 |
| 3. | Orleans | 18.0% | 2.5%(+15.5)#3 | 5.8%(+12.2)#635 |
| 4. | Storm Lake | 15.3% | 2.5%(+12.8)#4 | 5.8%(+9.55)#813 |
| 5. | Shueyville | 14.8% | 2.5%(+12.3)#5 | 5.8%(+8.99)#849 |
| 6. | Lockridge | 12.9% | 2.5%(+10.5)#6 | 5.8%(+7.17)#1,017 |
| 7. | St Anthony | 12.5% | 2.5%(+10.0)#7 | 5.8%(+6.73)#1,056 |
| 8. | Alta | 11.1% | 2.5%(+8.58)#8 | 5.8%(+5.28)#1,259 |
| 9. | Columbus Junction | 10.7% | 2.5%(+8.22)#9 | 5.8%(+4.92)#1,309 |
| 10. | Volga | 10.2% | 2.5%(+7.77)#10 | 5.8%(+4.47)#1,377 |
| 11. | Ames | 10.1% | 2.5%(+7.62)#11 | 5.8%(+4.32)#1,391 |
| 12. | Coralville | 9.4% | 2.5%(+6.95)#12 | 5.8%(+3.65)#1,519 |
| 13. | Ledyard | 8.9% | 2.5%(+6.39)#13 | 5.8%(+3.09)#1,632 |
| 14. | Fairfield | 8.7% | 2.5%(+6.22)#14 | 5.8%(+2.92)#1,665 |
| 15. | Monmouth | 8.5% | 2.5%(+5.98)#15 | 5.8%(+2.68)#1,710 |
| 16. | Maharishi Vedic City | 8.0% | 2.5%(+5.52)#16 | 5.8%(+2.23)#1,814 |
| 17. | Iowa City | 7.9% | 2.5%(+5.40)#17 | 5.8%(+2.10)#1,840 |
| 18. | Oak Hills | 7.8% | 2.5%(+5.28)#18 | 5.8%(+1.99)#1,871 |
| 19. | Forest City | 7.5% | 2.5%(+4.98)#19 | 5.8%(+1.68)#1,950 |
| 20. | Clemons | 7.2% | 2.5%(+4.71)#20 | 5.8%(+1.42)#2,024 |
| 21. | Bettendorf | 6.7% | 2.5%(+4.22)#21 | 5.8%(+0.925)#2,195 |
| 22. | Des Moines | 6.6% | 2.5%(+4.14)#22 | 5.8%(+0.838)#2,229 |
| 23. | Waukee | 6.5% | 2.5%(+4.02)#23 | 5.8%(+0.720)#2,268 |
| 24. | Clive | 6.2% | 2.5%(+3.68)#24 | 5.8%(+0.380)#2,403 |
| 25. | West Des Moines | 6.1% | 2.5%(+3.67)#25 | 5.8%(+0.375)#2,408 |
| 26. | Hiawatha | 6.1% | 2.5%(+3.63)#26 | 5.8%(+0.329)#2,427 |
| 27. | Windsor Heights | 6.1% | 2.5%(+3.60)#27 | 5.8%(+0.304)#2,442 |
| 28. | Whitten | 6.0% | 2.5%(+3.54)#28 | 5.8%(+0.242)#2,465 |
| 29. | University Heights | 5.9% | 2.5%(+3.44)#29 | 5.8%(+0.140)#2,511 |
| 30. | Greene | 5.8% | 2.5%(+3.37)#30 | 5.8%(+0.068)#2,545 |
| 31. | Johnston | 5.8% | 2.5%(+3.36)#31 | 5.8%(+0.058)#2,552 |
| 32. | Fayette | 5.5% | 2.5%(+3.04)#32 | 5.8%(-0.259)#2,713 |
| 33. | Conesville | 5.4% | 2.5%(+2.88)#33 | 5.8%(-0.419)#2,800 |
| 34. | Urbandale | 5.2% | 2.5%(+2.75)#34 | 5.8%(-0.548)#2,869 |
| 35. | Marshalltown | 5.2% | 2.5%(+2.74)#35 | 5.8%(-0.557)#2,876 |
| 36. | Rowan | 5.0% | 2.5%(+2.52)#36 | 5.8%(-0.773)#2,989 |
| 37. | Dysart | 4.9% | 2.5%(+2.45)#37 | 5.8%(-0.844)#3,027 |
| 38. | North Liberty | 4.7% | 2.5%(+2.22)#38 | 5.8%(-1.07)#3,159 |
| 39. | Dewitt | 4.6% | 2.5%(+2.17)#39 | 5.8%(-1.12)#3,192 |
| 40. | Okoboji | 4.5% | 2.5%(+1.99)#40 | 5.8%(-1.31)#3,334 |
| 41. | Pleasant Hill | 4.4% | 2.5%(+1.90)#41 | 5.8%(-1.40)#3,390 |
| 42. | De Soto | 4.2% | 2.5%(+1.74)#42 | 5.8%(-1.56)#3,519 |
| 43. | Grinnell | 4.2% | 2.5%(+1.74)#43 | 5.8%(-1.56)#3,520 |
| 44. | Clear Lake | 4.2% | 2.5%(+1.70)#44 | 5.8%(-1.60)#3,555 |
| 45. | Sergeant Bluff | 4.2% | 2.5%(+1.68)#45 | 5.8%(-1.62)#3,570 |
| 46. | Woodburn | 4.0% | 2.5%(+1.52)#46 | 5.8%(-1.77)#3,693 |
| 47. | Bassett | 4.0% | 2.5%(+1.52)#47 | 5.8%(-1.77)#3,695 |
| 48. | Cedar Falls | 4.0% | 2.5%(+1.49)#48 | 5.8%(-1.81)#3,728 |
| 49. | Nemaha | 4.0% | 2.5%(+1.48)#49 | 5.8%(-1.81)#3,731 |
| 50. | Denison | 3.9% | 2.5%(+1.46)#50 | 5.8%(-1.84)#3,751 |
| 51. | Duncombe | 3.9% | 2.5%(+1.39)#51 | 5.8%(-1.91)#3,818 |
| 52. | Asbury | 3.8% | 2.5%(+1.36)#52 | 5.8%(-1.94)#3,835 |
| 53. | Mount Pleasant | 3.7% | 2.5%(+1.19)#53 | 5.8%(-2.10)#3,976 |
| 54. | Schleswig | 3.4% | 2.5%(+0.954)#54 | 5.8%(-2.34)#4,224 |
| 55. | Ocheyedan | 3.3% | 2.5%(+0.817)#55 | 5.8%(-2.48)#4,371 |
| 56. | Ankeny | 3.3% | 2.5%(+0.775)#56 | 5.8%(-2.52)#4,404 |
| 57. | Charles City | 3.1% | 2.5%(+0.661)#57 | 5.8%(-2.64)#4,560 |
| 58. | Primghar | 3.1% | 2.5%(+0.628)#58 | 5.8%(-2.67)#4,602 |
| 59. | Salem | 3.0% | 2.5%(+0.483)#59 | 5.8%(-2.81)#4,790 |
| 60. | Tiffin | 2.9% | 2.5%(+0.435)#60 | 5.8%(-2.86)#4,848 |
| 61. | Harvey | 2.9% | 2.5%(+0.431)#61 | 5.8%(-2.87)#4,857 |
| 62. | Moravia | 2.9% | 2.5%(+0.396)#62 | 5.8%(-2.90)#4,913 |
| 63. | Lakeside | 2.9% | 2.5%(+0.377)#63 | 5.8%(-2.92)#4,935 |
| 64. | Eldora | 2.8% | 2.5%(+0.360)#64 | 5.8%(-2.94)#4,963 |
| 65. | Webster City | 2.8% | 2.5%(+0.350)#65 | 5.8%(-2.95)#4,974 |
| 66. | Maxwell | 2.7% | 2.5%(+0.231)#66 | 5.8%(-3.07)#5,134 |
| 67. | Jackson Junction | 2.7% | 2.5%(+0.227)#67 | 5.8%(-3.07)#5,143 |
| 68. | Cedar Rapids | 2.7% | 2.5%(+0.216)#68 | 5.8%(-3.08)#5,165 |
| 69. | Waterloo | 2.7% | 2.5%(+0.186)#69 | 5.8%(-3.11)#5,211 |
| 70. | Grimes | 2.6% | 2.5%(+0.167)#70 | 5.8%(-3.13)#5,232 |
| 71. | Eldridge | 2.6% | 2.5%(+0.139)#71 | 5.8%(-3.16)#5,278 |
| 72. | Sioux City | 2.6% | 2.5%(+0.120)#72 | 5.8%(-3.18)#5,309 |
| 73. | Gilbert | 2.5% | 2.5%(+0.056)#73 | 5.8%(-3.24)#5,387 |
| 74. | Kamrar | 2.5% | 2.5%(+0.024)#74 | 5.8%(-3.27)#5,432 |
| 75. | Beacon | 2.4% | 2.5%(-0.051)#75 | 5.8%(-3.35)#5,555 |
| 76. | Jewell Junction | 2.4% | 2.5%(-0.061)#76 | 5.8%(-3.36)#5,568 |
| 77. | Clarinda | 2.4% | 2.5%(-0.111)#77 | 5.8%(-3.41)#5,655 |
| 78. | Parkersburg | 2.4% | 2.5%(-0.116)#78 | 5.8%(-3.41)#5,663 |
| 79. | Churdan | 2.3% | 2.5%(-0.145)#79 | 5.8%(-3.44)#5,723 |
| 80. | Davis City | 2.3% | 2.5%(-0.161)#80 | 5.8%(-3.46)#5,750 |
| 81. | Pocahontas | 2.3% | 2.5%(-0.183)#81 | 5.8%(-3.48)#5,787 |
| 82. | Somers | 2.2% | 2.5%(-0.237)#82 | 5.8%(-3.53)#5,886 |
| 83. | Sibley | 2.2% | 2.5%(-0.285)#83 | 5.8%(-3.58)#5,977 |
| 84. | Postville | 2.2% | 2.5%(-0.289)#84 | 5.8%(-3.59)#5,988 |
| 85. | Glidden | 2.2% | 2.5%(-0.297)#85 | 5.8%(-3.59)#6,001 |
| 86. | Osage | 2.1% | 2.5%(-0.359)#86 | 5.8%(-3.66)#6,127 |
| 87. | Ottumwa | 2.0% | 2.5%(-0.433)#87 | 5.8%(-3.73)#6,285 |
| 88. | Anamosa | 2.0% | 2.5%(-0.455)#88 | 5.8%(-3.75)#6,321 |
| 89. | Robins | 1.9% | 2.5%(-0.539)#89 | 5.8%(-3.84)#6,512 |
| 90. | Minden | 1.9% | 2.5%(-0.552)#90 | 5.8%(-3.85)#6,543 |
| 91. | Randall | 1.9% | 2.5%(-0.565)#91 | 5.8%(-3.86)#6,562 |
| 92. | Davenport | 1.9% | 2.5%(-0.571)#92 | 5.8%(-3.87)#6,583 |
| 93. | Libertyville | 1.8% | 2.5%(-0.629)#93 | 5.8%(-3.93)#6,704 |
| 94. | Lamoni | 1.8% | 2.5%(-0.637)#94 | 5.8%(-3.93)#6,713 |
| 95. | Waverly | 1.7% | 2.5%(-0.735)#95 | 5.8%(-4.03)#6,954 |
| 96. | Oskaloosa | 1.7% | 2.5%(-0.761)#96 | 5.8%(-4.06)#7,030 |
| 97. | Marion | 1.7% | 2.5%(-0.782)#97 | 5.8%(-4.08)#7,088 |
| 98. | Indianola | 1.7% | 2.5%(-0.809)#98 | 5.8%(-4.11)#7,167 |
| 99. | Saylorville | 1.7% | 2.5%(-0.819)#99 | 5.8%(-4.12)#7,183 |
| 100. | Morrison | 1.6% | 2.5%(-0.836)#100 | 5.8%(-4.13)#7,233 |
Common Questions
What are the Top 10 Cities with the Highest Percentage of Asian Population in Iowa?
Top 10 Cities with the Highest Percentage of Asian Population in Iowa are:
#1
65.2%
#2
33.4%
#3
18.0%
#4
15.3%
#5
14.8%
#6
12.9%
#7
12.5%
#8
11.1%
#9
10.7%
#10
10.2%
What city has the Highest Percentage of Asian Population in Iowa?
Truesdale has the Highest Percentage of Asian Population in Iowa with 65.2%.
What is the Percentage of Asian Population in the State of Iowa?
Percentage of Asian Population in Iowa is 2.5%.
What is the Percentage of Asian Population in the United States?
Percentage of Asian Population in the United States is 5.8%.