Cities with the Highest Percentage of Asian Population in Alabama
RELATED REPORTS & OPTIONS
Asian
Alabama
Compare Cities
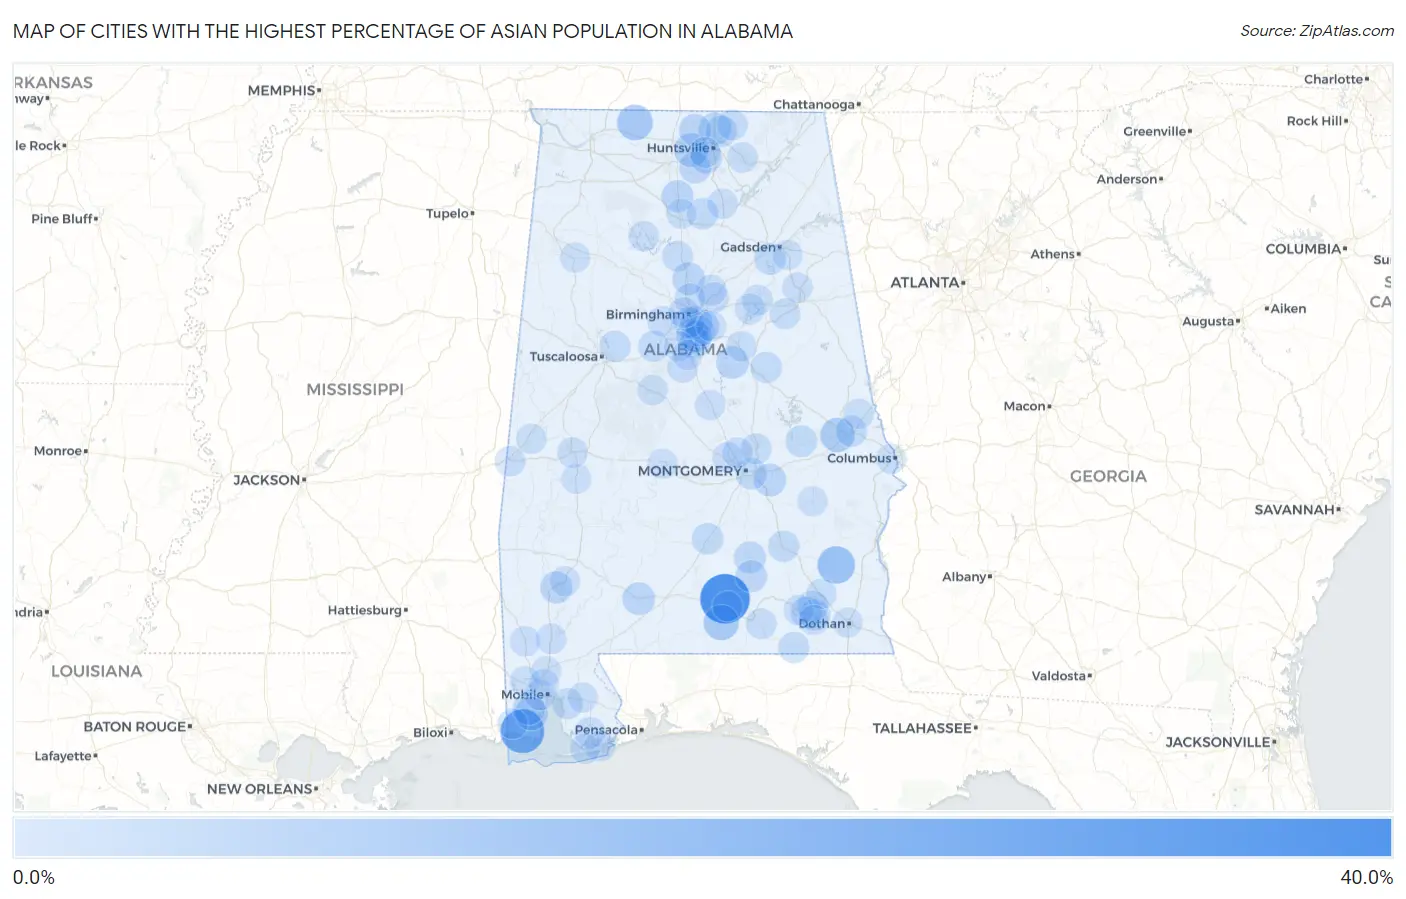
Map of Cities with the Highest Percentage of Asian Population in Alabama
0.0%
40.0%
Cities with the Highest Percentage of Asian Population in Alabama
| City | Asian | vs State | vs National | |
| 1. | Gantt | 34.2% | 1.4%(+32.8)#1 | 5.8%(+28.5)#207 |
| 2. | Bayou La Batre | 24.2% | 1.4%(+22.8)#2 | 5.8%(+18.4)#407 |
| 3. | Blue Springs | 13.2% | 1.4%(+11.8)#3 | 5.8%(+7.43)#996 |
| 4. | Anderson | 10.0% | 1.4%(+8.57)#4 | 5.8%(+4.19)#1,417 |
| 5. | Carolina | 9.7% | 1.4%(+8.29)#5 | 5.8%(+3.90)#1,479 |
| 6. | Auburn | 8.2% | 1.4%(+6.77)#6 | 5.8%(+2.39)#1,771 |
| 7. | Madison | 7.3% | 1.4%(+5.91)#7 | 5.8%(+1.53)#1,991 |
| 8. | Theodore | 6.1% | 1.4%(+4.70)#8 | 5.8%(+0.318)#2,435 |
| 9. | Brook Highland | 6.0% | 1.4%(+4.64)#9 | 5.8%(+0.259)#2,454 |
| 10. | Eagle Point | 5.7% | 1.4%(+4.33)#10 | 5.8%(-0.055)#2,598 |
| 11. | Hoover | 5.4% | 1.4%(+3.98)#11 | 5.8%(-0.405)#2,789 |
| 12. | Fayetteville | 5.2% | 1.4%(+3.85)#12 | 5.8%(-0.535)#2,862 |
| 13. | Repton | 5.2% | 1.4%(+3.80)#13 | 5.8%(-0.582)#2,891 |
| 14. | Kimberly | 5.2% | 1.4%(+3.78)#14 | 5.8%(-0.606)#2,908 |
| 15. | Pike Road | 5.1% | 1.4%(+3.72)#15 | 5.8%(-0.664)#2,934 |
| 16. | Meridianville | 5.0% | 1.4%(+3.65)#16 | 5.8%(-0.735)#2,970 |
| 17. | Vestavia Hills | 4.9% | 1.4%(+3.55)#17 | 5.8%(-0.830)#3,017 |
| 18. | Tillmans Corner | 4.6% | 1.4%(+3.25)#18 | 5.8%(-1.13)#3,197 |
| 19. | Leroy | 4.3% | 1.4%(+2.95)#19 | 5.8%(-1.44)#3,415 |
| 20. | Harvest | 4.3% | 1.4%(+2.91)#20 | 5.8%(-1.47)#3,448 |
| 21. | Falkville | 4.3% | 1.4%(+2.90)#21 | 5.8%(-1.48)#3,452 |
| 22. | Luverne | 4.1% | 1.4%(+2.68)#22 | 5.8%(-1.70)#3,635 |
| 23. | Redstone Arsenal | 4.0% | 1.4%(+2.65)#23 | 5.8%(-1.74)#3,660 |
| 24. | Brantley | 4.0% | 1.4%(+2.60)#24 | 5.8%(-1.78)#3,701 |
| 25. | Triana | 3.9% | 1.4%(+2.50)#25 | 5.8%(-1.89)#3,797 |
| 26. | Pelham | 3.6% | 1.4%(+2.20)#26 | 5.8%(-2.19)#4,059 |
| 27. | Rainbow City | 3.5% | 1.4%(+2.10)#27 | 5.8%(-2.29)#4,156 |
| 28. | Montgomery | 3.5% | 1.4%(+2.08)#28 | 5.8%(-2.31)#4,177 |
| 29. | Reeltown | 3.5% | 1.4%(+2.07)#29 | 5.8%(-2.31)#4,182 |
| 30. | Greenville | 3.3% | 1.4%(+1.93)#30 | 5.8%(-2.46)#4,344 |
| 31. | Moores Mill | 3.3% | 1.4%(+1.92)#31 | 5.8%(-2.46)#4,346 |
| 32. | Troy | 3.3% | 1.4%(+1.89)#32 | 5.8%(-2.49)#4,380 |
| 33. | Level Plains | 3.1% | 1.4%(+1.73)#33 | 5.8%(-2.65)#4,573 |
| 34. | Opelika | 3.1% | 1.4%(+1.72)#34 | 5.8%(-2.66)#4,587 |
| 35. | Fairview | 3.1% | 1.4%(+1.70)#35 | 5.8%(-2.69)#4,619 |
| 36. | Lake View | 3.0% | 1.4%(+1.63)#36 | 5.8%(-2.75)#4,720 |
| 37. | Daleville | 3.0% | 1.4%(+1.61)#37 | 5.8%(-2.77)#4,740 |
| 38. | Indian Springs Village | 2.9% | 1.4%(+1.56)#38 | 5.8%(-2.83)#4,802 |
| 39. | Homewood | 2.8% | 1.4%(+1.41)#39 | 5.8%(-2.98)#5,026 |
| 40. | Geneva | 2.8% | 1.4%(+1.37)#40 | 5.8%(-3.01)#5,071 |
| 41. | Tuscaloosa | 2.7% | 1.4%(+1.32)#41 | 5.8%(-3.07)#5,136 |
| 42. | Fort Rucker | 2.7% | 1.4%(+1.30)#42 | 5.8%(-3.08)#5,160 |
| 43. | Daphne | 2.7% | 1.4%(+1.27)#43 | 5.8%(-3.11)#5,207 |
| 44. | Hollins | 2.6% | 1.4%(+1.22)#44 | 5.8%(-3.16)#5,281 |
| 45. | Wetumpka | 2.4% | 1.4%(+0.996)#45 | 5.8%(-3.39)#5,616 |
| 46. | Munford | 2.4% | 1.4%(+0.964)#46 | 5.8%(-3.42)#5,678 |
| 47. | Colony | 2.3% | 1.4%(+0.946)#47 | 5.8%(-3.44)#5,711 |
| 48. | Foley | 2.2% | 1.4%(+0.767)#48 | 5.8%(-3.62)#6,052 |
| 49. | Kinston | 2.1% | 1.4%(+0.745)#49 | 5.8%(-3.64)#6,093 |
| 50. | Huntsville | 2.1% | 1.4%(+0.718)#50 | 5.8%(-3.67)#6,155 |
| 51. | New Market | 2.1% | 1.4%(+0.712)#51 | 5.8%(-3.67)#6,173 |
| 52. | Clay | 2.1% | 1.4%(+0.696)#52 | 5.8%(-3.69)#6,212 |
| 53. | Fultondale | 2.0% | 1.4%(+0.641)#53 | 5.8%(-3.74)#6,310 |
| 54. | Concord | 1.9% | 1.4%(+0.555)#54 | 5.8%(-3.83)#6,501 |
| 55. | Paint Rock | 1.9% | 1.4%(+0.535)#55 | 5.8%(-3.85)#6,544 |
| 56. | Prattville | 1.9% | 1.4%(+0.513)#56 | 5.8%(-3.87)#6,592 |
| 57. | Mobile | 1.9% | 1.4%(+0.491)#57 | 5.8%(-3.89)#6,639 |
| 58. | Trussville | 1.9% | 1.4%(+0.477)#58 | 5.8%(-3.91)#6,672 |
| 59. | Mount Vernon | 1.8% | 1.4%(+0.457)#59 | 5.8%(-3.93)#6,705 |
| 60. | Demopolis | 1.8% | 1.4%(+0.405)#60 | 5.8%(-3.98)#6,840 |
| 61. | Montevallo | 1.8% | 1.4%(+0.395)#61 | 5.8%(-3.99)#6,863 |
| 62. | Arab | 1.8% | 1.4%(+0.377)#62 | 5.8%(-4.01)#6,898 |
| 63. | Grand Bay | 1.7% | 1.4%(+0.331)#63 | 5.8%(-4.05)#7,016 |
| 64. | Orange Beach | 1.7% | 1.4%(+0.314)#64 | 5.8%(-4.07)#7,052 |
| 65. | Riverside | 1.7% | 1.4%(+0.314)#65 | 5.8%(-4.07)#7,054 |
| 66. | Saks | 1.7% | 1.4%(+0.284)#66 | 5.8%(-4.10)#7,143 |
| 67. | Centreville | 1.6% | 1.4%(+0.229)#67 | 5.8%(-4.16)#7,284 |
| 68. | Pell City | 1.6% | 1.4%(+0.224)#68 | 5.8%(-4.16)#7,295 |
| 69. | Arley | 1.6% | 1.4%(+0.193)#69 | 5.8%(-4.19)#7,392 |
| 70. | Ozark | 1.5% | 1.4%(+0.156)#70 | 5.8%(-4.23)#7,495 |
| 71. | Meadowbrook | 1.5% | 1.4%(+0.154)#71 | 5.8%(-4.23)#7,507 |
| 72. | Cuba | 1.5% | 1.4%(+0.141)#72 | 5.8%(-4.24)#7,543 |
| 73. | Millbrook | 1.5% | 1.4%(+0.133)#73 | 5.8%(-4.25)#7,559 |
| 74. | Clanton | 1.5% | 1.4%(+0.104)#74 | 5.8%(-4.28)#7,655 |
| 75. | Birmingham | 1.5% | 1.4%(+0.094)#75 | 5.8%(-4.29)#7,689 |
| 76. | Citronelle | 1.5% | 1.4%(+0.087)#76 | 5.8%(-4.30)#7,711 |
| 77. | Childersburg | 1.5% | 1.4%(+0.066)#77 | 5.8%(-4.32)#7,777 |
| 78. | Cusseta | 1.4% | 1.4%(+0.040)#78 | 5.8%(-4.34)#7,855 |
| 79. | Livingston | 1.4% | 1.4%(+0.037)#79 | 5.8%(-4.35)#7,865 |
| 80. | Winfield | 1.3% | 1.4%(-0.043)#80 | 5.8%(-4.43)#8,116 |
| 81. | Selma | 1.3% | 1.4%(-0.046)#81 | 5.8%(-4.43)#8,125 |
| 82. | Enterprise | 1.3% | 1.4%(-0.049)#82 | 5.8%(-4.43)#8,135 |
| 83. | Helena | 1.3% | 1.4%(-0.067)#83 | 5.8%(-4.45)#8,190 |
| 84. | Phenix City | 1.3% | 1.4%(-0.100)#84 | 5.8%(-4.48)#8,323 |
| 85. | Union Springs | 1.3% | 1.4%(-0.101)#85 | 5.8%(-4.49)#8,330 |
| 86. | Alabaster | 1.3% | 1.4%(-0.102)#86 | 5.8%(-4.49)#8,331 |
| 87. | Shoal Creek | 1.3% | 1.4%(-0.107)#87 | 5.8%(-4.49)#8,355 |
| 88. | South Vinemont | 1.3% | 1.4%(-0.117)#88 | 5.8%(-4.50)#8,387 |
| 89. | Dothan | 1.3% | 1.4%(-0.122)#89 | 5.8%(-4.51)#8,410 |
| 90. | Satsuma | 1.3% | 1.4%(-0.127)#90 | 5.8%(-4.51)#8,435 |
| 91. | Mccalla | 1.2% | 1.4%(-0.141)#91 | 5.8%(-4.53)#8,466 |
| 92. | Gulf Shores | 1.2% | 1.4%(-0.150)#92 | 5.8%(-4.53)#8,505 |
| 93. | Jackson | 1.2% | 1.4%(-0.159)#93 | 5.8%(-4.54)#8,530 |
| 94. | Semmes | 1.2% | 1.4%(-0.178)#94 | 5.8%(-4.56)#8,588 |
| 95. | Chickasaw | 1.2% | 1.4%(-0.216)#95 | 5.8%(-4.60)#8,706 |
| 96. | Loxley | 1.2% | 1.4%(-0.217)#96 | 5.8%(-4.60)#8,710 |
| 97. | Clayhatchee | 1.2% | 1.4%(-0.217)#97 | 5.8%(-4.60)#8,713 |
| 98. | Linden | 1.2% | 1.4%(-0.229)#98 | 5.8%(-4.61)#8,755 |
| 99. | Glencoe | 1.1% | 1.4%(-0.247)#99 | 5.8%(-4.63)#8,822 |
| 100. | Heath | 1.1% | 1.4%(-0.252)#100 | 5.8%(-4.64)#8,839 |
Common Questions
What are the Top 10 Cities with the Highest Percentage of Asian Population in Alabama?
Top 10 Cities with the Highest Percentage of Asian Population in Alabama are:
#1
34.2%
#2
24.2%
#3
13.2%
#4
10.0%
#5
9.7%
#6
8.2%
#7
7.3%
#8
6.1%
#9
6.0%
#10
5.4%
What city has the Highest Percentage of Asian Population in Alabama?
Gantt has the Highest Percentage of Asian Population in Alabama with 34.2%.
What is the Percentage of Asian Population in the State of Alabama?
Percentage of Asian Population in Alabama is 1.4%.
What is the Percentage of Asian Population in the United States?
Percentage of Asian Population in the United States is 5.8%.