Cities with the Highest Percentage of Asian Population in Michigan
RELATED REPORTS & OPTIONS
Asian
Michigan
Compare Cities
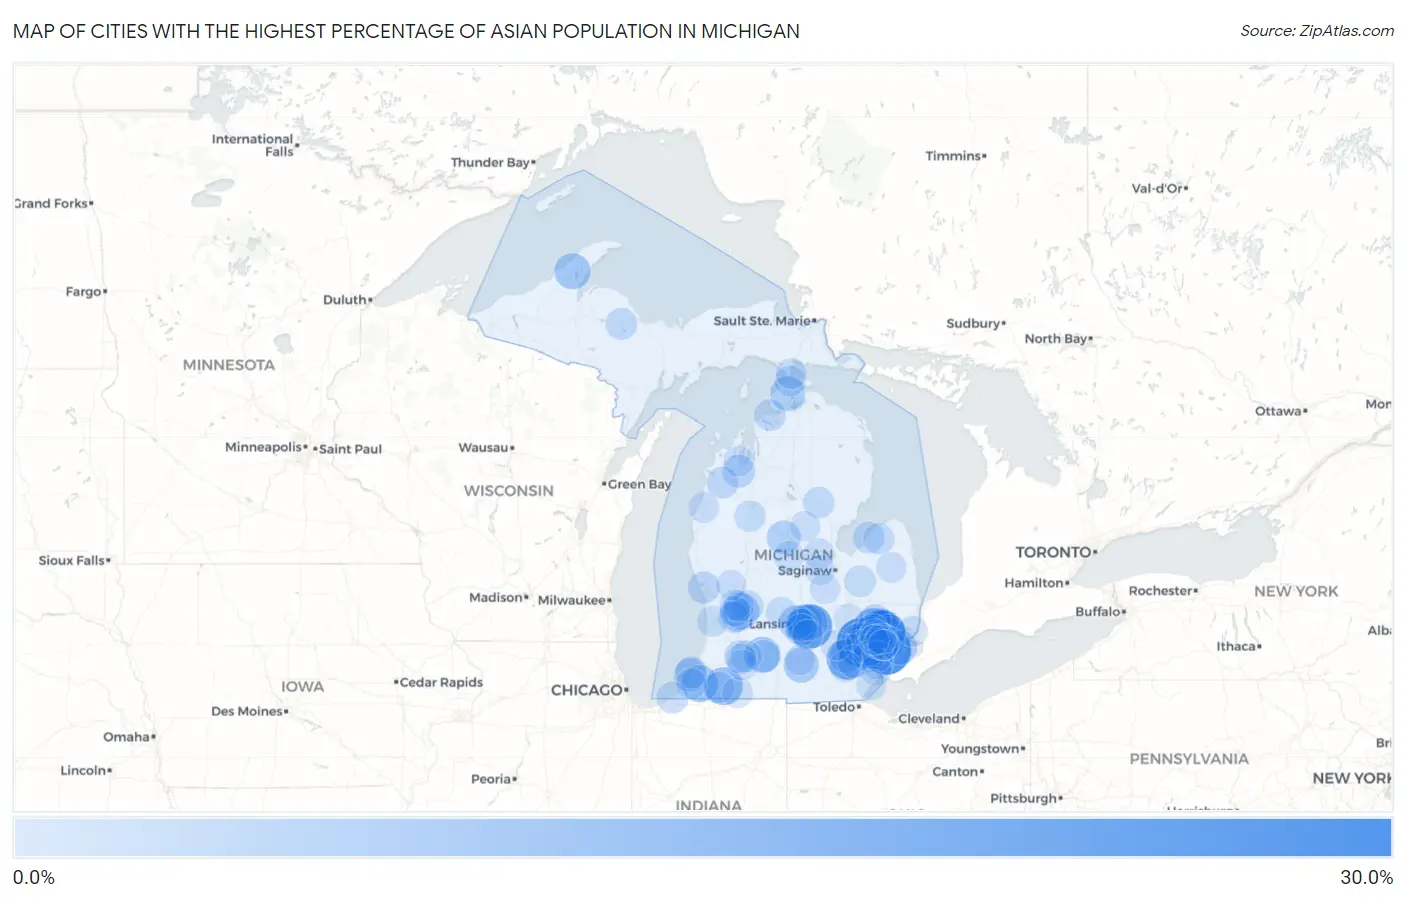
Map of Cities with the Highest Percentage of Asian Population in Michigan
0.0%
30.0%
Cities with the Highest Percentage of Asian Population in Michigan
| City | Asian | vs State | vs National | |
| 1. | Hamtramck | 26.1% | 3.3%(+22.8)#1 | 5.8%(+20.3)#353 |
| 2. | Troy | 26.0% | 3.3%(+22.7)#2 | 5.8%(+20.2)#354 |
| 3. | Novi | 25.4% | 3.3%(+22.1)#3 | 5.8%(+19.6)#370 |
| 4. | Okemos | 19.8% | 3.3%(+16.5)#4 | 5.8%(+14.0)#542 |
| 5. | Farmington | 18.6% | 3.3%(+15.3)#5 | 5.8%(+12.8)#602 |
| 6. | Ann Arbor | 16.1% | 3.3%(+12.9)#6 | 5.8%(+10.4)#755 |
| 7. | Auburn Hills | 15.8% | 3.3%(+12.6)#7 | 5.8%(+10.0)#777 |
| 8. | Farmington Hills | 14.5% | 3.3%(+11.2)#8 | 5.8%(+8.72)#861 |
| 9. | Rochester Hills | 13.7% | 3.3%(+10.5)#9 | 5.8%(+7.94)#929 |
| 10. | Vandalia | 11.6% | 3.3%(+8.31)#10 | 5.8%(+5.80)#1,177 |
| 11. | Warren | 10.7% | 3.3%(+7.43)#11 | 5.8%(+4.91)#1,311 |
| 12. | Orchard Lake Village | 10.7% | 3.3%(+7.42)#12 | 5.8%(+4.90)#1,315 |
| 13. | Berrien Springs | 9.8% | 3.3%(+6.54)#13 | 5.8%(+4.02)#1,452 |
| 14. | Kentwood | 9.4% | 3.3%(+6.16)#14 | 5.8%(+3.65)#1,521 |
| 15. | Springfield | 9.4% | 3.3%(+6.10)#15 | 5.8%(+3.59)#1,529 |
| 16. | East Lansing | 9.2% | 3.3%(+5.99)#16 | 5.8%(+3.47)#1,551 |
| 17. | Houghton | 9.1% | 3.3%(+5.86)#17 | 5.8%(+3.34)#1,575 |
| 18. | Sterling Heights | 8.9% | 3.3%(+5.60)#18 | 5.8%(+3.09)#1,633 |
| 19. | Haslett | 8.3% | 3.3%(+5.00)#19 | 5.8%(+2.49)#1,752 |
| 20. | Spring Arbor | 8.1% | 3.3%(+4.88)#20 | 5.8%(+2.36)#1,782 |
| 21. | Levering | 7.7% | 3.3%(+4.44)#21 | 5.8%(+1.92)#1,887 |
| 22. | Rochester | 7.5% | 3.3%(+4.29)#22 | 5.8%(+1.77)#1,920 |
| 23. | Waverly | 7.2% | 3.3%(+3.93)#23 | 5.8%(+1.41)#2,025 |
| 24. | Village Of Grosse Pointe Shores | 7.2% | 3.3%(+3.91)#24 | 5.8%(+1.39)#2,034 |
| 25. | Wixom | 6.9% | 3.3%(+3.59)#25 | 5.8%(+1.08)#2,148 |
| 26. | Franklin | 6.6% | 3.3%(+3.38)#26 | 5.8%(+0.861)#2,223 |
| 27. | Farwell | 6.5% | 3.3%(+3.23)#27 | 5.8%(+0.713)#2,271 |
| 28. | Madison Heights | 6.4% | 3.3%(+3.13)#28 | 5.8%(+0.616)#2,310 |
| 29. | Utica | 6.3% | 3.3%(+3.02)#29 | 5.8%(+0.503)#2,358 |
| 30. | Barton Hills | 6.1% | 3.3%(+2.82)#30 | 5.8%(+0.308)#2,438 |
| 31. | Walled Lake | 5.8% | 3.3%(+2.55)#31 | 5.8%(+0.038)#2,559 |
| 32. | Northville | 5.7% | 3.3%(+2.48)#32 | 5.8%(-0.040)#2,592 |
| 33. | Cutlerville | 5.7% | 3.3%(+2.41)#33 | 5.8%(-0.109)#2,627 |
| 34. | Center Line | 5.7% | 3.3%(+2.40)#34 | 5.8%(-0.121)#2,634 |
| 35. | Shoreham | 5.6% | 3.3%(+2.39)#35 | 5.8%(-0.127)#2,637 |
| 36. | Naubinway | 5.3% | 3.3%(+2.08)#36 | 5.8%(-0.439)#2,819 |
| 37. | Chums Corner | 5.3% | 3.3%(+2.04)#37 | 5.8%(-0.478)#2,839 |
| 38. | Ypsilanti | 5.2% | 3.3%(+1.93)#38 | 5.8%(-0.586)#2,895 |
| 39. | Lansing | 5.0% | 3.3%(+1.71)#39 | 5.8%(-0.802)#3,000 |
| 40. | Birmingham | 4.7% | 3.3%(+1.48)#40 | 5.8%(-1.03)#3,125 |
| 41. | Battle Creek | 4.7% | 3.3%(+1.44)#41 | 5.8%(-1.07)#3,156 |
| 42. | Holt | 4.7% | 3.3%(+1.44)#42 | 5.8%(-1.08)#3,165 |
| 43. | Roosevelt Park | 4.6% | 3.3%(+1.36)#43 | 5.8%(-1.16)#3,221 |
| 44. | St Joseph | 4.4% | 3.3%(+1.10)#44 | 5.8%(-1.42)#3,401 |
| 45. | Lake Orion | 4.3% | 3.3%(+1.03)#45 | 5.8%(-1.48)#3,454 |
| 46. | Forest Hills | 4.3% | 3.3%(+1.02)#46 | 5.8%(-1.49)#3,463 |
| 47. | Michiana | 4.2% | 3.3%(+0.954)#47 | 5.8%(-1.56)#3,526 |
| 48. | Thompsonville | 4.2% | 3.3%(+0.947)#48 | 5.8%(-1.57)#3,531 |
| 49. | West Ishpeming | 4.1% | 3.3%(+0.872)#49 | 5.8%(-1.64)#3,592 |
| 50. | Bay Port | 4.1% | 3.3%(+0.804)#50 | 5.8%(-1.71)#3,645 |
| 51. | Pontiac | 4.0% | 3.3%(+0.754)#51 | 5.8%(-1.76)#3,683 |
| 52. | Westwood | 4.0% | 3.3%(+0.745)#52 | 5.8%(-1.77)#3,690 |
| 53. | Bay Shore | 3.9% | 3.3%(+0.683)#53 | 5.8%(-1.83)#3,745 |
| 54. | Millington | 3.8% | 3.3%(+0.572)#54 | 5.8%(-1.94)#3,840 |
| 55. | Beverly Hills | 3.8% | 3.3%(+0.563)#55 | 5.8%(-1.95)#3,846 |
| 56. | Cassopolis | 3.7% | 3.3%(+0.400)#56 | 5.8%(-2.12)#3,982 |
| 57. | Livonia | 3.7% | 3.3%(+0.396)#57 | 5.8%(-2.12)#3,987 |
| 58. | Westland | 3.6% | 3.3%(+0.386)#58 | 5.8%(-2.13)#3,998 |
| 59. | West Branch | 3.6% | 3.3%(+0.383)#59 | 5.8%(-2.13)#4,000 |
| 60. | Bloomfield Hills | 3.6% | 3.3%(+0.378)#60 | 5.8%(-2.14)#4,006 |
| 61. | Comstock Northwest | 3.6% | 3.3%(+0.368)#61 | 5.8%(-2.15)#4,018 |
| 62. | Saline | 3.6% | 3.3%(+0.332)#62 | 5.8%(-2.18)#4,053 |
| 63. | Byron Center | 3.5% | 3.3%(+0.278)#63 | 5.8%(-2.24)#4,108 |
| 64. | Royal Oak | 3.5% | 3.3%(+0.268)#64 | 5.8%(-2.25)#4,112 |
| 65. | Portland | 3.4% | 3.3%(+0.176)#65 | 5.8%(-2.34)#4,220 |
| 66. | Tustin | 3.4% | 3.3%(+0.141)#66 | 5.8%(-2.37)#4,251 |
| 67. | Mackinaw City | 3.4% | 3.3%(+0.102)#67 | 5.8%(-2.41)#4,301 |
| 68. | Elkton | 3.4% | 3.3%(+0.095)#68 | 5.8%(-2.42)#4,308 |
| 69. | Walker | 3.2% | 3.3%(-0.047)#69 | 5.8%(-2.56)#4,475 |
| 70. | Holland | 3.1% | 3.3%(-0.179)#70 | 5.8%(-2.70)#4,627 |
| 71. | Pinckney | 2.9% | 3.3%(-0.385)#71 | 5.8%(-2.90)#4,912 |
| 72. | Midland | 2.8% | 3.3%(-0.424)#72 | 5.8%(-2.94)#4,970 |
| 73. | Grand Rapids | 2.8% | 3.3%(-0.434)#73 | 5.8%(-2.95)#4,977 |
| 74. | St Ignace | 2.8% | 3.3%(-0.435)#74 | 5.8%(-2.95)#4,979 |
| 75. | Southgate | 2.8% | 3.3%(-0.438)#75 | 5.8%(-2.95)#4,983 |
| 76. | Constantine | 2.8% | 3.3%(-0.456)#76 | 5.8%(-2.97)#5,011 |
| 77. | Baroda | 2.8% | 3.3%(-0.466)#77 | 5.8%(-2.98)#5,035 |
| 78. | Mason | 2.8% | 3.3%(-0.480)#78 | 5.8%(-3.00)#5,058 |
| 79. | Mount Pleasant | 2.8% | 3.3%(-0.503)#79 | 5.8%(-3.02)#5,082 |
| 80. | Greilickville | 2.7% | 3.3%(-0.530)#80 | 5.8%(-3.05)#5,118 |
| 81. | Pearl Beach | 2.7% | 3.3%(-0.562)#81 | 5.8%(-3.08)#5,158 |
| 82. | Snover | 2.7% | 3.3%(-0.564)#82 | 5.8%(-3.08)#5,163 |
| 83. | Portage | 2.7% | 3.3%(-0.582)#83 | 5.8%(-3.10)#5,187 |
| 84. | Wyoming | 2.7% | 3.3%(-0.589)#84 | 5.8%(-3.10)#5,198 |
| 85. | Hemlock | 2.6% | 3.3%(-0.647)#85 | 5.8%(-3.16)#5,287 |
| 86. | Stronach | 2.6% | 3.3%(-0.652)#86 | 5.8%(-3.17)#5,296 |
| 87. | Kalamazoo | 2.5% | 3.3%(-0.733)#87 | 5.8%(-3.25)#5,393 |
| 88. | Dearborn | 2.5% | 3.3%(-0.743)#88 | 5.8%(-3.26)#5,408 |
| 89. | Gladwin | 2.5% | 3.3%(-0.745)#89 | 5.8%(-3.26)#5,413 |
| 90. | Woodhaven | 2.5% | 3.3%(-0.746)#90 | 5.8%(-3.26)#5,417 |
| 91. | Oak Park | 2.5% | 3.3%(-0.748)#91 | 5.8%(-3.26)#5,420 |
| 92. | Casnovia | 2.5% | 3.3%(-0.764)#92 | 5.8%(-3.28)#5,440 |
| 93. | Ferndale | 2.5% | 3.3%(-0.791)#93 | 5.8%(-3.31)#5,476 |
| 94. | Chesaning | 2.4% | 3.3%(-0.808)#94 | 5.8%(-3.32)#5,506 |
| 95. | Parma | 2.4% | 3.3%(-0.843)#95 | 5.8%(-3.36)#5,570 |
| 96. | Woodland Beach | 2.4% | 3.3%(-0.870)#96 | 5.8%(-3.39)#5,615 |
| 97. | Fenton | 2.3% | 3.3%(-0.984)#97 | 5.8%(-3.50)#5,819 |
| 98. | Hazel Park | 2.1% | 3.3%(-1.13)#98 | 5.8%(-3.64)#6,097 |
| 99. | Clawson | 2.1% | 3.3%(-1.14)#99 | 5.8%(-3.66)#6,132 |
| 100. | Bingham Farms | 2.1% | 3.3%(-1.16)#100 | 5.8%(-3.68)#6,189 |
Common Questions
What are the Top 10 Cities with the Highest Percentage of Asian Population in Michigan?
Top 10 Cities with the Highest Percentage of Asian Population in Michigan are:
#1
26.1%
#2
26.0%
#3
25.4%
#4
19.8%
#5
18.6%
#6
16.1%
#7
15.8%
#8
14.5%
#9
13.7%
#10
11.6%
What city has the Highest Percentage of Asian Population in Michigan?
Hamtramck has the Highest Percentage of Asian Population in Michigan with 26.1%.
What is the Percentage of Asian Population in the State of Michigan?
Percentage of Asian Population in Michigan is 3.3%.
What is the Percentage of Asian Population in the United States?
Percentage of Asian Population in the United States is 5.8%.