Cities with the Highest Percentage of Asian Population in Massachusetts
RELATED REPORTS & OPTIONS
Asian
Massachusetts
Compare Cities
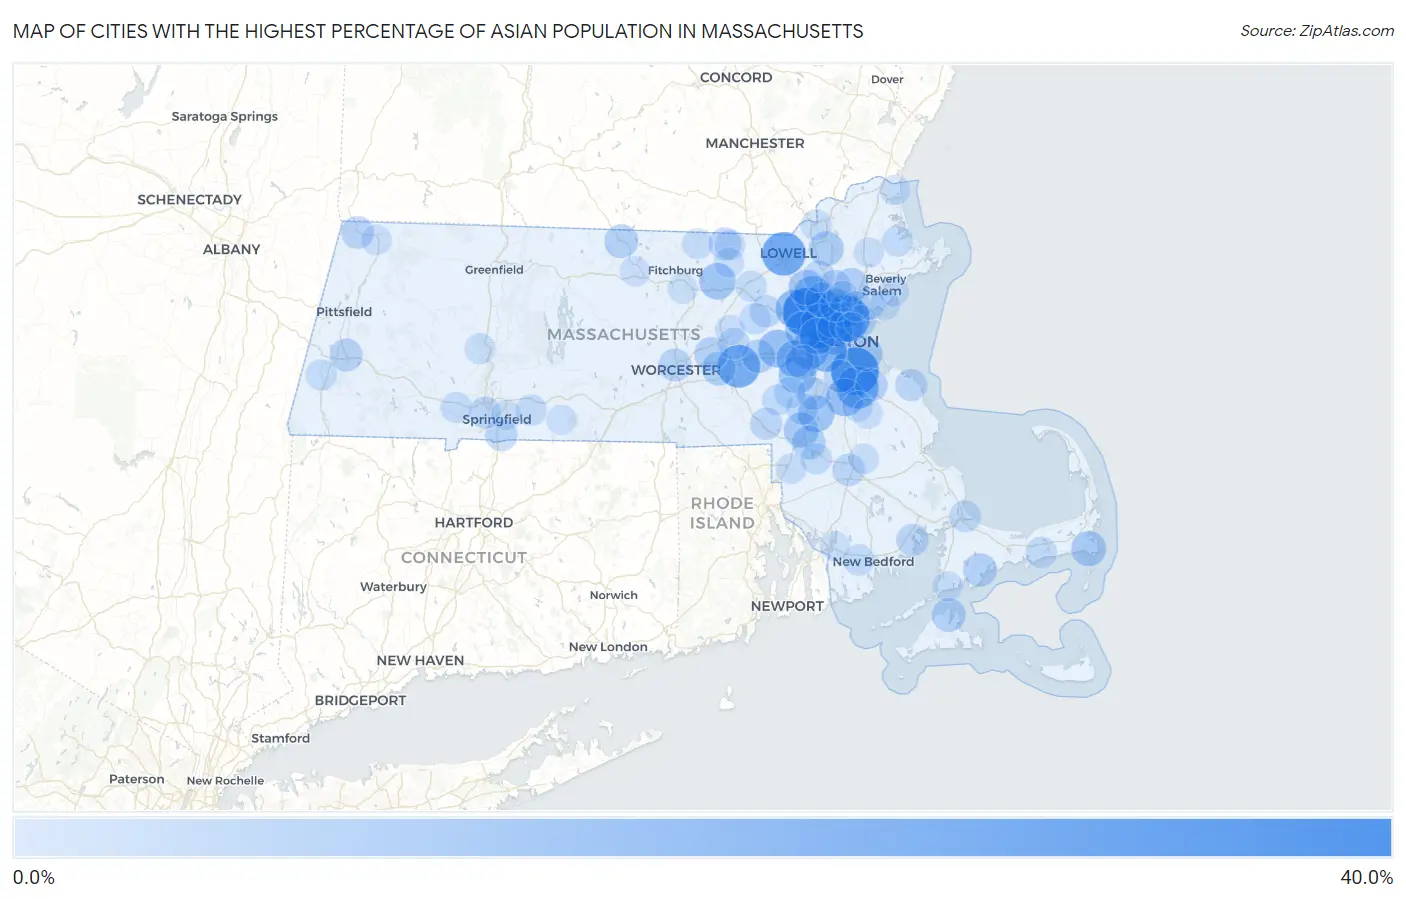
Map of Cities with the Highest Percentage of Asian Population in Massachusetts
0.0%
40.0%
Cities with the Highest Percentage of Asian Population in Massachusetts
| City | Asian | vs State | vs National | |
| 1. | Lexington | 31.6% | 7.0%(+24.6)#1 | 5.8%(+25.9)#244 |
| 2. | Quincy | 28.9% | 7.0%(+21.9)#2 | 5.8%(+23.1)#297 |
| 3. | Malden | 27.5% | 7.0%(+20.5)#3 | 5.8%(+21.7)#320 |
| 4. | Lowell | 22.6% | 7.0%(+15.6)#4 | 5.8%(+16.8)#438 |
| 5. | Cordaville | 21.4% | 7.0%(+14.4)#5 | 5.8%(+15.6)#478 |
| 6. | Braintree Town | 20.7% | 7.0%(+13.8)#6 | 5.8%(+15.0)#503 |
| 7. | Cambridge | 19.3% | 7.0%(+12.3)#7 | 5.8%(+13.5)#568 |
| 8. | Brookline | 18.4% | 7.0%(+11.4)#8 | 5.8%(+12.6)#613 |
| 9. | Belmont | 18.1% | 7.0%(+11.1)#9 | 5.8%(+12.3)#632 |
| 10. | Winchester | 15.8% | 7.0%(+8.80)#10 | 5.8%(+10.0)#779 |
| 11. | Hanscom Afb | 15.0% | 7.0%(+7.98)#11 | 5.8%(+9.19)#838 |
| 12. | Burlington | 14.5% | 7.0%(+7.51)#12 | 5.8%(+8.72)#860 |
| 13. | Newton | 14.3% | 7.0%(+7.34)#13 | 5.8%(+8.55)#874 |
| 14. | Randolph Town | 14.1% | 7.0%(+7.11)#14 | 5.8%(+8.31)#893 |
| 15. | Cochituate | 14.0% | 7.0%(+7.00)#15 | 5.8%(+8.21)#898 |
| 16. | Amherst | 13.5% | 7.0%(+6.47)#16 | 5.8%(+7.68)#959 |
| 17. | Dover | 13.4% | 7.0%(+6.43)#17 | 5.8%(+7.64)#967 |
| 18. | Arlington | 13.3% | 7.0%(+6.32)#18 | 5.8%(+7.53)#978 |
| 19. | Wellesley | 13.3% | 7.0%(+6.30)#19 | 5.8%(+7.51)#979 |
| 20. | Waltham | 13.0% | 7.0%(+6.02)#20 | 5.8%(+7.23)#1,015 |
| 21. | Sharon | 12.1% | 7.0%(+5.09)#21 | 5.8%(+6.29)#1,113 |
| 22. | Devens | 12.0% | 7.0%(+5.04)#22 | 5.8%(+6.25)#1,117 |
| 23. | Watertown Town | 11.7% | 7.0%(+4.72)#23 | 5.8%(+5.93)#1,158 |
| 24. | Medford | 11.3% | 7.0%(+4.33)#24 | 5.8%(+5.53)#1,225 |
| 25. | Somerville | 10.5% | 7.0%(+3.52)#25 | 5.8%(+4.73)#1,336 |
| 26. | Pinehurst | 10.3% | 7.0%(+3.34)#26 | 5.8%(+4.54)#1,363 |
| 27. | Foxborough | 9.9% | 7.0%(+2.97)#27 | 5.8%(+4.18)#1,421 |
| 28. | West Chatham | 9.9% | 7.0%(+2.94)#28 | 5.8%(+4.15)#1,428 |
| 29. | Boston | 9.7% | 7.0%(+2.69)#29 | 5.8%(+3.90)#1,485 |
| 30. | Woburn | 9.6% | 7.0%(+2.60)#30 | 5.8%(+3.81)#1,496 |
| 31. | Needham | 9.6% | 7.0%(+2.58)#31 | 5.8%(+3.79)#1,498 |
| 32. | Melrose | 9.5% | 7.0%(+2.49)#32 | 5.8%(+3.70)#1,509 |
| 33. | Andover | 9.3% | 7.0%(+2.36)#33 | 5.8%(+3.57)#1,534 |
| 34. | Everett | 8.9% | 7.0%(+1.93)#34 | 5.8%(+3.14)#1,623 |
| 35. | Lynnfield | 8.3% | 7.0%(+1.30)#35 | 5.8%(+2.51)#1,746 |
| 36. | Vineyard Haven | 8.2% | 7.0%(+1.17)#36 | 5.8%(+2.38)#1,774 |
| 37. | Westborough | 8.1% | 7.0%(+1.17)#37 | 5.8%(+2.38)#1,775 |
| 38. | Winchendon | 8.1% | 7.0%(+1.11)#38 | 5.8%(+2.32)#1,791 |
| 39. | Mansfield Center | 7.8% | 7.0%(+0.821)#39 | 5.8%(+2.03)#1,854 |
| 40. | Mashpee Neck | 7.7% | 7.0%(+0.735)#40 | 5.8%(+1.94)#1,875 |
| 41. | Northborough | 7.7% | 7.0%(+0.717)#41 | 5.8%(+1.93)#1,885 |
| 42. | Framingham | 7.5% | 7.0%(+0.539)#42 | 5.8%(+1.75)#1,930 |
| 43. | Stoneham | 7.4% | 7.0%(+0.443)#43 | 5.8%(+1.65)#1,961 |
| 44. | Lee | 7.0% | 7.0%(-0.014)#44 | 5.8%(+1.19)#2,104 |
| 45. | Weymouth Town | 6.8% | 7.0%(-0.149)#45 | 5.8%(+1.06)#2,155 |
| 46. | Worcester | 6.8% | 7.0%(-0.204)#46 | 5.8%(+1.00)#2,174 |
| 47. | Norwood | 6.7% | 7.0%(-0.320)#47 | 5.8%(+0.889)#2,214 |
| 48. | Williamstown | 6.5% | 7.0%(-0.512)#48 | 5.8%(+0.697)#2,276 |
| 49. | Reading | 6.4% | 7.0%(-0.560)#49 | 5.8%(+0.649)#2,295 |
| 50. | Pepperell | 6.3% | 7.0%(-0.678)#50 | 5.8%(+0.531)#2,342 |
| 51. | Raynham Center | 6.1% | 7.0%(-0.832)#51 | 5.8%(+0.376)#2,404 |
| 52. | Milton | 6.0% | 7.0%(-0.957)#52 | 5.8%(+0.252)#2,459 |
| 53. | Marion Center | 5.9% | 7.0%(-1.06)#53 | 5.8%(+0.146)#2,509 |
| 54. | Revere | 5.9% | 7.0%(-1.07)#54 | 5.8%(+0.137)#2,515 |
| 55. | Longmeadow | 5.9% | 7.0%(-1.12)#55 | 5.8%(+0.092)#2,535 |
| 56. | Lynn | 5.8% | 7.0%(-1.21)#56 | 5.8%(-0.000)#2,574 |
| 57. | West Concord | 5.7% | 7.0%(-1.29)#57 | 5.8%(-0.083)#2,612 |
| 58. | Franklin Town | 5.7% | 7.0%(-1.32)#58 | 5.8%(-0.113)#2,628 |
| 59. | North Scituate | 5.6% | 7.0%(-1.34)#59 | 5.8%(-0.134)#2,640 |
| 60. | North Attleborough | 5.5% | 7.0%(-1.48)#60 | 5.8%(-0.273)#2,719 |
| 61. | West Springfield Town | 5.3% | 7.0%(-1.66)#61 | 5.8%(-0.452)#2,826 |
| 62. | Sagamore | 5.2% | 7.0%(-1.76)#62 | 5.8%(-0.553)#2,873 |
| 63. | Marlborough | 5.2% | 7.0%(-1.82)#63 | 5.8%(-0.607)#2,910 |
| 64. | Wilmington | 5.2% | 7.0%(-1.82)#64 | 5.8%(-0.611)#2,911 |
| 65. | Walpole | 5.0% | 7.0%(-1.98)#65 | 5.8%(-0.767)#2,984 |
| 66. | South Yarmouth | 4.8% | 7.0%(-2.18)#66 | 5.8%(-0.970)#3,091 |
| 67. | Medfield | 4.5% | 7.0%(-2.44)#67 | 5.8%(-1.23)#3,278 |
| 68. | Smith Mills | 4.5% | 7.0%(-2.46)#68 | 5.8%(-1.25)#3,287 |
| 69. | Wilbraham | 4.5% | 7.0%(-2.48)#69 | 5.8%(-1.27)#3,297 |
| 70. | Norton Center | 4.5% | 7.0%(-2.49)#70 | 5.8%(-1.28)#3,309 |
| 71. | Westfield | 4.3% | 7.0%(-2.64)#71 | 5.8%(-1.43)#3,407 |
| 72. | Maynard | 4.3% | 7.0%(-2.67)#72 | 5.8%(-1.46)#3,434 |
| 73. | Millis Clicquot | 4.2% | 7.0%(-2.78)#73 | 5.8%(-1.58)#3,536 |
| 74. | Methuen Town | 4.2% | 7.0%(-2.81)#74 | 5.8%(-1.60)#3,554 |
| 75. | Housatonic | 4.2% | 7.0%(-2.82)#75 | 5.8%(-1.61)#3,564 |
| 76. | Wakefield | 4.1% | 7.0%(-2.92)#76 | 5.8%(-1.71)#3,641 |
| 77. | Littleton Common | 4.0% | 7.0%(-2.94)#77 | 5.8%(-1.73)#3,658 |
| 78. | Ipswich | 3.9% | 7.0%(-3.10)#78 | 5.8%(-1.89)#3,804 |
| 79. | Northampton | 3.8% | 7.0%(-3.16)#79 | 5.8%(-1.96)#3,849 |
| 80. | Townsend | 3.6% | 7.0%(-3.36)#80 | 5.8%(-2.15)#4,017 |
| 81. | East Pepperell | 3.5% | 7.0%(-3.53)#81 | 5.8%(-2.32)#4,196 |
| 82. | Attleboro | 3.4% | 7.0%(-3.58)#82 | 5.8%(-2.37)#4,240 |
| 83. | North Adams | 3.4% | 7.0%(-3.61)#83 | 5.8%(-2.40)#4,288 |
| 84. | Holbrook | 3.3% | 7.0%(-3.66)#84 | 5.8%(-2.45)#4,335 |
| 85. | Gardner | 3.2% | 7.0%(-3.77)#85 | 5.8%(-2.56)#4,466 |
| 86. | Salisbury | 3.1% | 7.0%(-3.87)#86 | 5.8%(-2.66)#4,586 |
| 87. | Salem | 3.1% | 7.0%(-3.91)#87 | 5.8%(-2.70)#4,645 |
| 88. | Falmouth | 3.1% | 7.0%(-3.92)#88 | 5.8%(-2.71)#4,650 |
| 89. | Saugus | 3.0% | 7.0%(-3.96)#89 | 5.8%(-2.75)#4,714 |
| 90. | Topsfield | 3.0% | 7.0%(-4.02)#90 | 5.8%(-2.81)#4,783 |
| 91. | Leominster | 3.0% | 7.0%(-4.03)#91 | 5.8%(-2.82)#4,797 |
| 92. | Bridgewater Town | 2.9% | 7.0%(-4.04)#92 | 5.8%(-2.84)#4,815 |
| 93. | Abington | 2.9% | 7.0%(-4.06)#93 | 5.8%(-2.85)#4,827 |
| 94. | Groton | 2.9% | 7.0%(-4.06)#94 | 5.8%(-2.85)#4,829 |
| 95. | Swampscott | 2.9% | 7.0%(-4.07)#95 | 5.8%(-2.86)#4,850 |
| 96. | Hudson | 2.9% | 7.0%(-4.08)#96 | 5.8%(-2.87)#4,863 |
| 97. | Springfield | 2.9% | 7.0%(-4.10)#97 | 5.8%(-2.89)#4,897 |
| 98. | Chelsea | 2.9% | 7.0%(-4.13)#98 | 5.8%(-2.92)#4,932 |
| 99. | Monson Center | 2.8% | 7.0%(-4.17)#99 | 5.8%(-2.96)#4,997 |
| 100. | Fall River | 2.7% | 7.0%(-4.32)#100 | 5.8%(-3.11)#5,213 |
Common Questions
What are the Top 10 Cities with the Highest Percentage of Asian Population in Massachusetts?
Top 10 Cities with the Highest Percentage of Asian Population in Massachusetts are:
#1
31.6%
#2
28.9%
#3
27.5%
#4
22.6%
#5
21.4%
#6
20.7%
#7
19.3%
#8
18.4%
#9
18.1%
#10
15.8%
What city has the Highest Percentage of Asian Population in Massachusetts?
Lexington has the Highest Percentage of Asian Population in Massachusetts with 31.6%.
What is the Percentage of Asian Population in the State of Massachusetts?
Percentage of Asian Population in Massachusetts is 7.0%.
What is the Percentage of Asian Population in the United States?
Percentage of Asian Population in the United States is 5.8%.