Cities with the Highest Percentage of Asian Population in Kansas
RELATED REPORTS & OPTIONS
Asian
Kansas
Compare Cities
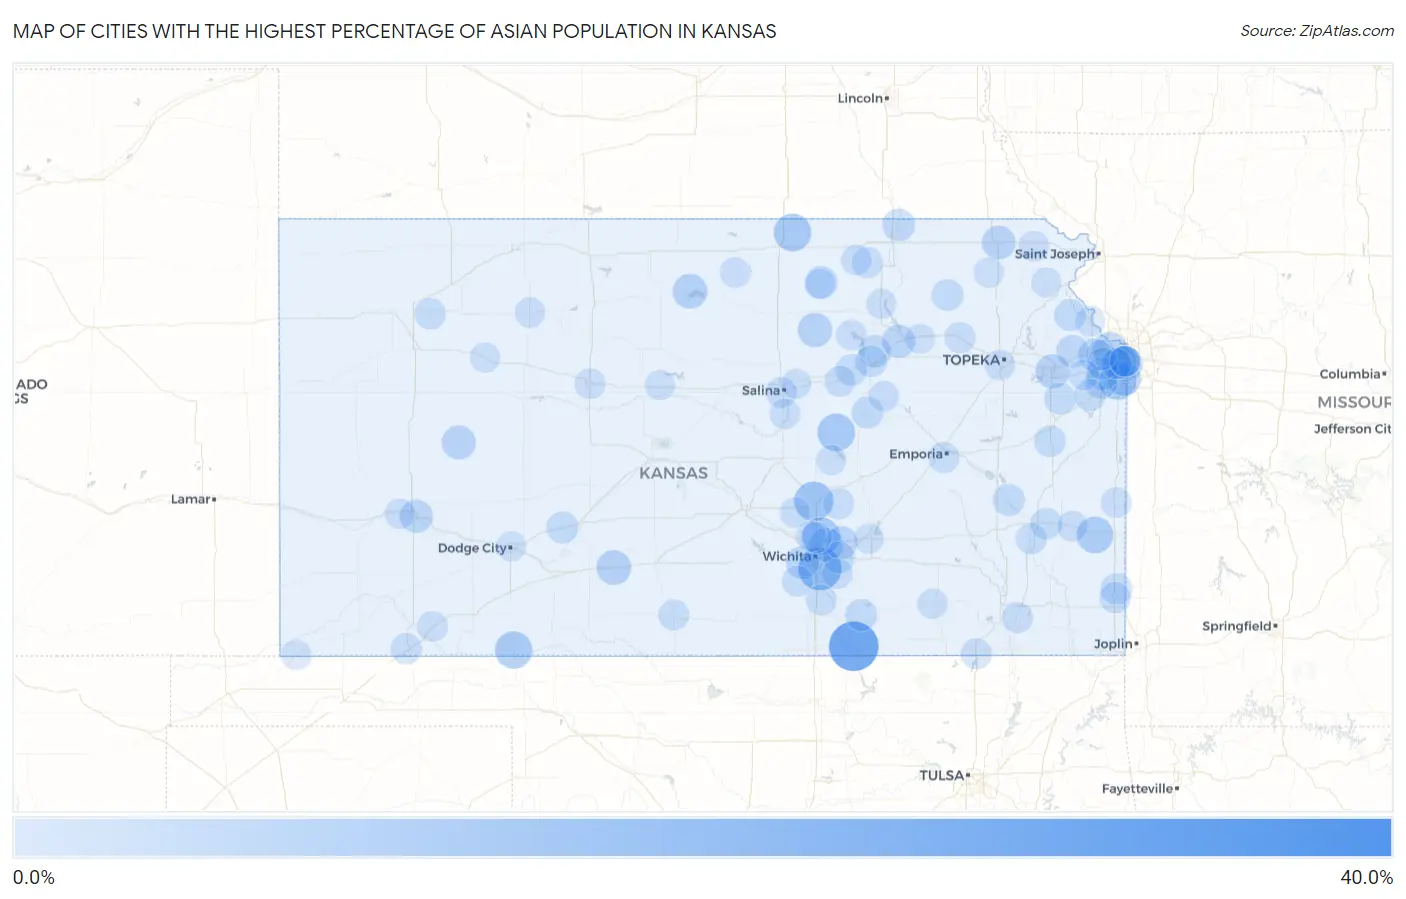
Map of Cities with the Highest Percentage of Asian Population in Kansas
0.0%
40.0%
Cities with the Highest Percentage of Asian Population in Kansas
| City | Asian | vs State | vs National | |
| 1. | Keats | 32.1% | 3.0%(+29.1)#1 | 5.8%(+26.4)#236 |
| 2. | Parkerfield | 23.4% | 3.0%(+20.4)#2 | 5.8%(+17.6)#420 |
| 3. | Oaklawn Sunview | 16.1% | 3.0%(+13.0)#3 | 5.8%(+10.3)#759 |
| 4. | North Newton | 11.5% | 3.0%(+8.53)#4 | 5.8%(+5.77)#1,182 |
| 5. | Tampa | 9.9% | 3.0%(+6.91)#5 | 5.8%(+4.15)#1,427 |
| 6. | Munden | 9.8% | 3.0%(+6.76)#6 | 5.8%(+4.00)#1,459 |
| 7. | Kechi | 9.6% | 3.0%(+6.58)#7 | 5.8%(+3.82)#1,495 |
| 8. | Englewood | 9.4% | 3.0%(+6.40)#8 | 5.8%(+3.64)#1,523 |
| 9. | Overland Park | 9.0% | 3.0%(+6.02)#9 | 5.8%(+3.26)#1,594 |
| 10. | Monument | 9.0% | 3.0%(+5.96)#10 | 5.8%(+3.20)#1,606 |
| 11. | Redfield | 8.7% | 3.0%(+5.68)#11 | 5.8%(+2.92)#1,667 |
| 12. | Mission Hills | 6.9% | 3.0%(+3.85)#12 | 5.8%(+1.10)#2,144 |
| 13. | Haviland | 6.6% | 3.0%(+3.60)#13 | 5.8%(+0.838)#2,230 |
| 14. | Cawker City | 6.6% | 3.0%(+3.57)#14 | 5.8%(+0.816)#2,235 |
| 15. | Oak Hill | 6.2% | 3.0%(+3.24)#15 | 5.8%(+0.477)#2,370 |
| 16. | Leawood | 6.0% | 3.0%(+2.97)#16 | 5.8%(+0.210)#2,480 |
| 17. | Lawrence | 5.9% | 3.0%(+2.91)#17 | 5.8%(+0.157)#2,502 |
| 18. | Bel Aire | 5.9% | 3.0%(+2.85)#18 | 5.8%(+0.090)#2,537 |
| 19. | Dighton | 5.7% | 3.0%(+2.68)#19 | 5.8%(-0.083)#2,613 |
| 20. | Kansas City | 5.4% | 3.0%(+2.38)#20 | 5.8%(-0.383)#2,770 |
| 21. | Fairview | 5.4% | 3.0%(+2.37)#21 | 5.8%(-0.383)#2,771 |
| 22. | Bonner Springs | 4.9% | 3.0%(+1.91)#22 | 5.8%(-0.843)#3,026 |
| 23. | Manhattan | 4.9% | 3.0%(+1.91)#23 | 5.8%(-0.852)#3,032 |
| 24. | Wichita | 4.8% | 3.0%(+1.83)#24 | 5.8%(-0.927)#3,073 |
| 25. | Garden City | 4.8% | 3.0%(+1.82)#25 | 5.8%(-0.936)#3,077 |
| 26. | Mission | 4.6% | 3.0%(+1.63)#26 | 5.8%(-1.12)#3,191 |
| 27. | Benton | 4.6% | 3.0%(+1.61)#27 | 5.8%(-1.15)#3,213 |
| 28. | Fairway | 4.6% | 3.0%(+1.60)#28 | 5.8%(-1.16)#3,222 |
| 29. | Tonganoxie | 4.3% | 3.0%(+1.27)#29 | 5.8%(-1.49)#3,459 |
| 30. | Clifton | 4.2% | 3.0%(+1.23)#30 | 5.8%(-1.53)#3,504 |
| 31. | Oketo | 4.2% | 3.0%(+1.19)#31 | 5.8%(-1.57)#3,533 |
| 32. | Fort Riley | 4.2% | 3.0%(+1.15)#32 | 5.8%(-1.61)#3,561 |
| 33. | Lenexa | 4.1% | 3.0%(+1.12)#33 | 5.8%(-1.64)#3,585 |
| 34. | Olathe | 4.1% | 3.0%(+1.11)#34 | 5.8%(-1.65)#3,596 |
| 35. | Winfield | 3.8% | 3.0%(+0.772)#35 | 5.8%(-1.99)#3,870 |
| 36. | Leroy | 3.8% | 3.0%(+0.745)#36 | 5.8%(-2.01)#3,895 |
| 37. | Offerle | 3.6% | 3.0%(+0.573)#37 | 5.8%(-2.19)#4,054 |
| 38. | Easton | 3.5% | 3.0%(+0.460)#38 | 5.8%(-2.30)#4,168 |
| 39. | Herington | 3.4% | 3.0%(+0.409)#39 | 5.8%(-2.35)#4,228 |
| 40. | Onaga | 3.4% | 3.0%(+0.383)#40 | 5.8%(-2.37)#4,250 |
| 41. | Andover | 3.4% | 3.0%(+0.336)#41 | 5.8%(-2.42)#4,309 |
| 42. | Shawnee | 3.3% | 3.0%(+0.316)#42 | 5.8%(-2.44)#4,329 |
| 43. | Baldwin City | 3.2% | 3.0%(+0.226)#43 | 5.8%(-2.53)#4,426 |
| 44. | Gardner | 3.2% | 3.0%(+0.200)#44 | 5.8%(-2.56)#4,467 |
| 45. | Junction City | 3.1% | 3.0%(+0.095)#45 | 5.8%(-2.66)#4,592 |
| 46. | Chapman | 3.1% | 3.0%(+0.055)#46 | 5.8%(-2.70)#4,642 |
| 47. | La Harpe | 3.1% | 3.0%(+0.048)#47 | 5.8%(-2.71)#4,654 |
| 48. | Princeton | 2.9% | 3.0%(-0.130)#48 | 5.8%(-2.89)#4,889 |
| 49. | Frontenac | 2.8% | 3.0%(-0.178)#49 | 5.8%(-2.94)#4,962 |
| 50. | Pittsburg | 2.8% | 3.0%(-0.201)#50 | 5.8%(-2.96)#4,993 |
| 51. | Menlo | 2.7% | 3.0%(-0.312)#51 | 5.8%(-3.07)#5,144 |
| 52. | St Marys | 2.7% | 3.0%(-0.347)#52 | 5.8%(-3.10)#5,197 |
| 53. | Barnes | 2.7% | 3.0%(-0.348)#53 | 5.8%(-3.11)#5,200 |
| 54. | Liberal | 2.7% | 3.0%(-0.360)#54 | 5.8%(-3.12)#5,218 |
| 55. | Elbing | 2.6% | 3.0%(-0.432)#55 | 5.8%(-3.19)#5,324 |
| 56. | Humboldt | 2.5% | 3.0%(-0.490)#56 | 5.8%(-3.25)#5,392 |
| 57. | Clearwater | 2.5% | 3.0%(-0.499)#57 | 5.8%(-3.26)#5,404 |
| 58. | Emporia | 2.5% | 3.0%(-0.506)#58 | 5.8%(-3.26)#5,422 |
| 59. | Enterprise | 2.4% | 3.0%(-0.579)#59 | 5.8%(-3.34)#5,529 |
| 60. | Park City | 2.4% | 3.0%(-0.587)#60 | 5.8%(-3.34)#5,548 |
| 61. | Belle Plaine | 2.4% | 3.0%(-0.593)#61 | 5.8%(-3.35)#5,557 |
| 62. | Westwood | 2.4% | 3.0%(-0.609)#62 | 5.8%(-3.37)#5,586 |
| 63. | Cherryvale | 2.4% | 3.0%(-0.638)#63 | 5.8%(-3.40)#5,629 |
| 64. | Merriam | 2.4% | 3.0%(-0.648)#64 | 5.8%(-3.41)#5,650 |
| 65. | Caney | 2.3% | 3.0%(-0.682)#65 | 5.8%(-3.44)#5,717 |
| 66. | Medicine Lodge | 2.3% | 3.0%(-0.691)#66 | 5.8%(-3.45)#5,731 |
| 67. | Salina | 2.3% | 3.0%(-0.723)#67 | 5.8%(-3.48)#5,788 |
| 68. | Prescott | 2.2% | 3.0%(-0.773)#68 | 5.8%(-3.53)#5,879 |
| 69. | Bronson | 2.2% | 3.0%(-0.788)#69 | 5.8%(-3.55)#5,909 |
| 70. | Valley Center | 2.1% | 3.0%(-0.872)#70 | 5.8%(-3.63)#6,073 |
| 71. | Edwardsville | 2.1% | 3.0%(-0.886)#71 | 5.8%(-3.64)#6,104 |
| 72. | White City | 2.1% | 3.0%(-0.891)#72 | 5.8%(-3.65)#6,115 |
| 73. | Robinson | 2.1% | 3.0%(-0.898)#73 | 5.8%(-3.66)#6,130 |
| 74. | Kismet | 2.1% | 3.0%(-0.910)#74 | 5.8%(-3.67)#6,161 |
| 75. | Rose Hill | 2.0% | 3.0%(-0.972)#75 | 5.8%(-3.73)#6,284 |
| 76. | De Soto | 2.0% | 3.0%(-0.982)#76 | 5.8%(-3.74)#6,307 |
| 77. | Hill City | 2.0% | 3.0%(-1.01)#77 | 5.8%(-3.76)#6,354 |
| 78. | Hays | 2.0% | 3.0%(-1.02)#78 | 5.8%(-3.78)#6,390 |
| 79. | Assaria | 2.0% | 3.0%(-1.05)#79 | 5.8%(-3.81)#6,470 |
| 80. | Mission Woods | 1.9% | 3.0%(-1.08)#80 | 5.8%(-3.84)#6,518 |
| 81. | Greenleaf | 1.9% | 3.0%(-1.10)#81 | 5.8%(-3.86)#6,556 |
| 82. | Holcomb | 1.9% | 3.0%(-1.14)#82 | 5.8%(-3.89)#6,640 |
| 83. | Topeka | 1.8% | 3.0%(-1.18)#83 | 5.8%(-3.94)#6,727 |
| 84. | Halstead | 1.8% | 3.0%(-1.19)#84 | 5.8%(-3.94)#6,747 |
| 85. | Randall | 1.8% | 3.0%(-1.19)#85 | 5.8%(-3.95)#6,749 |
| 86. | Wakefield | 1.8% | 3.0%(-1.21)#86 | 5.8%(-3.96)#6,797 |
| 87. | Moline | 1.8% | 3.0%(-1.22)#87 | 5.8%(-3.98)#6,835 |
| 88. | Wetmore | 1.7% | 3.0%(-1.30)#88 | 5.8%(-4.05)#7,018 |
| 89. | Elkhart | 1.7% | 3.0%(-1.33)#89 | 5.8%(-4.09)#7,102 |
| 90. | Bunker Hill | 1.7% | 3.0%(-1.35)#90 | 5.8%(-4.11)#7,160 |
| 91. | Dodge City | 1.7% | 3.0%(-1.35)#91 | 5.8%(-4.11)#7,162 |
| 92. | Randolph | 1.6% | 3.0%(-1.37)#92 | 5.8%(-4.12)#7,203 |
| 93. | Hillsboro | 1.6% | 3.0%(-1.37)#93 | 5.8%(-4.13)#7,224 |
| 94. | New Cambria | 1.6% | 3.0%(-1.38)#94 | 5.8%(-4.13)#7,231 |
| 95. | Vining | 1.6% | 3.0%(-1.38)#95 | 5.8%(-4.13)#7,234 |
| 96. | Leavenworth | 1.6% | 3.0%(-1.41)#96 | 5.8%(-4.17)#7,332 |
| 97. | Lancaster | 1.6% | 3.0%(-1.43)#97 | 5.8%(-4.19)#7,387 |
| 98. | Quinter | 1.6% | 3.0%(-1.46)#98 | 5.8%(-4.22)#7,477 |
| 99. | El Dorado | 1.5% | 3.0%(-1.50)#99 | 5.8%(-4.26)#7,592 |
| 100. | St George | 1.5% | 3.0%(-1.50)#100 | 5.8%(-4.26)#7,593 |
Common Questions
What are the Top 10 Cities with the Highest Percentage of Asian Population in Kansas?
Top 10 Cities with the Highest Percentage of Asian Population in Kansas are:
#1
23.4%
#2
16.1%
#3
11.5%
#4
9.9%
#5
9.8%
#6
9.6%
#7
9.4%
#8
9.0%
#9
8.7%
#10
6.9%
What city has the Highest Percentage of Asian Population in Kansas?
Parkerfield has the Highest Percentage of Asian Population in Kansas with 23.4%.
What is the Percentage of Asian Population in the State of Kansas?
Percentage of Asian Population in Kansas is 3.0%.
What is the Percentage of Asian Population in the United States?
Percentage of Asian Population in the United States is 5.8%.