Cities with the Highest Percentage of Population with a Degree in Psychology in Nevada
RELATED REPORTS & OPTIONS
Psychology
Nevada
Compare Cities
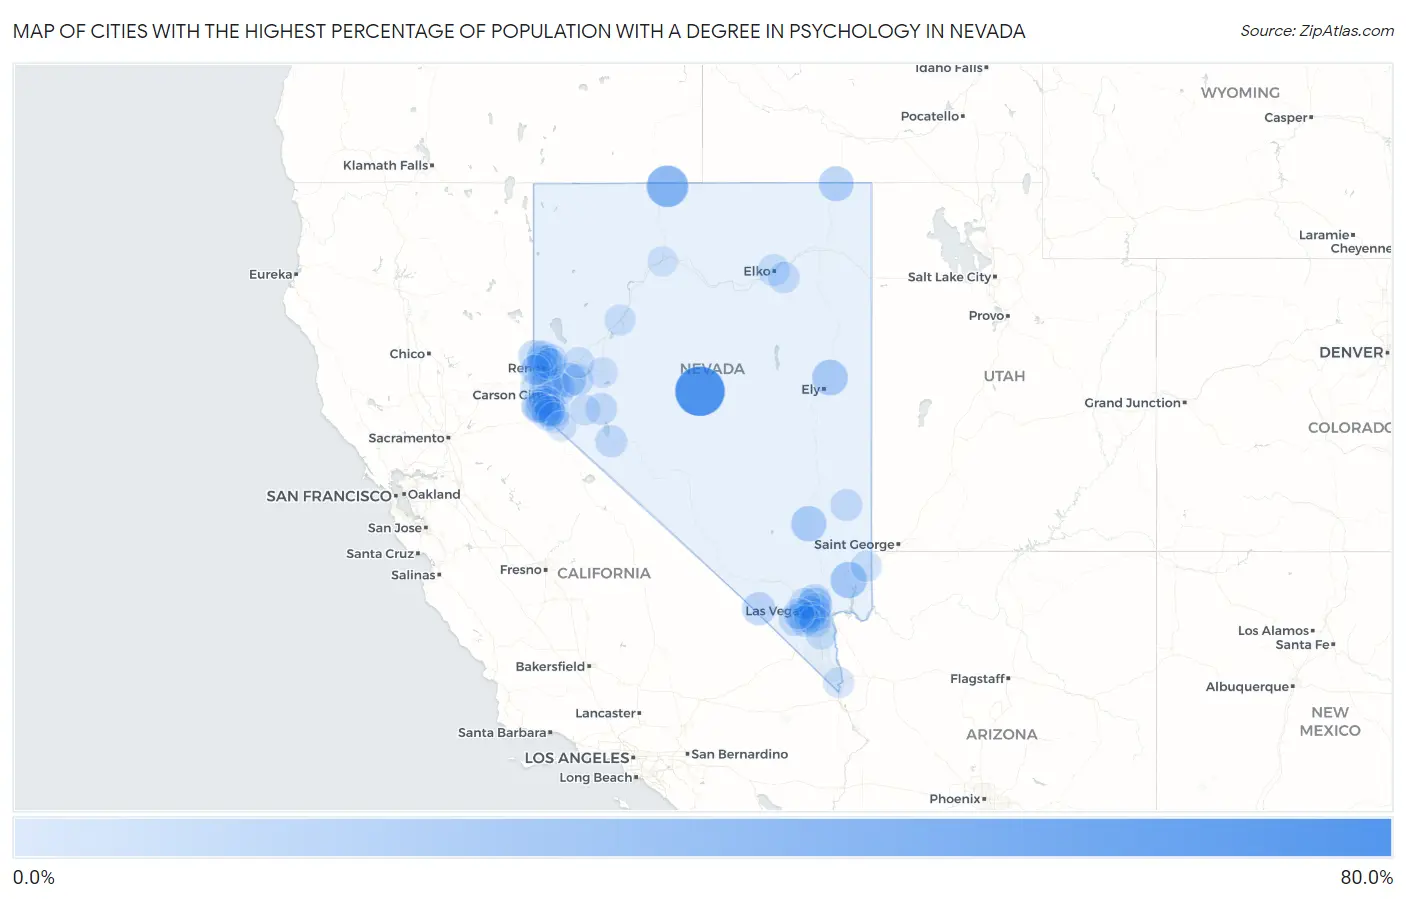
Map of Cities with the Highest Percentage of Population with a Degree in Psychology in Nevada
0.0%
80.0%
Cities with the Highest Percentage of Population with a Degree in Psychology in Nevada
| City | % Graduates | vs State | vs National | |
| 1. | Kingston | 65.2% | 5.1%(+60.1)#1 | 5.1%(+60.2)#99 |
| 2. | Fort Mcdermitt | 37.5% | 5.1%(+32.4)#2 | 5.1%(+32.4)#344 |
| 3. | Moapa Valley | 19.9% | 5.1%(+14.9)#3 | 5.1%(+14.9)#1,073 |
| 4. | Mcgill | 17.9% | 5.1%(+12.8)#4 | 5.1%(+12.8)#1,275 |
| 5. | Alamo | 16.7% | 5.1%(+11.6)#5 | 5.1%(+11.6)#1,400 |
| 6. | Jackpot | 14.9% | 5.1%(+9.83)#6 | 5.1%(+9.85)#1,703 |
| 7. | Nellis Afb | 14.6% | 5.1%(+9.56)#7 | 5.1%(+9.58)#1,759 |
| 8. | Stagecoach | 13.8% | 5.1%(+8.70)#8 | 5.1%(+8.72)#1,958 |
| 9. | Virginia City | 10.2% | 5.1%(+5.10)#9 | 5.1%(+5.12)#3,269 |
| 10. | Dayton | 10.1% | 5.1%(+5.00)#10 | 5.1%(+5.02)#3,316 |
| 11. | Washoe Valley | 9.9% | 5.1%(+4.82)#11 | 5.1%(+4.84)#3,435 |
| 12. | Pahrump | 9.4% | 5.1%(+4.29)#12 | 5.1%(+4.31)#3,750 |
| 13. | Genoa | 9.0% | 5.1%(+3.91)#13 | 5.1%(+3.92)#4,043 |
| 14. | Whitney | 8.9% | 5.1%(+3.86)#14 | 5.1%(+3.88)#4,076 |
| 15. | Golden Valley | 8.3% | 5.1%(+3.23)#15 | 5.1%(+3.25)#4,612 |
| 16. | Sun Valley | 8.3% | 5.1%(+3.19)#16 | 5.1%(+3.21)#4,647 |
| 17. | Cold Springs | 8.3% | 5.1%(+3.19)#17 | 5.1%(+3.21)#4,649 |
| 18. | Winchester | 7.2% | 5.1%(+2.12)#18 | 5.1%(+2.14)#5,771 |
| 19. | Johnson Lane | 6.2% | 5.1%(+1.09)#19 | 5.1%(+1.11)#7,411 |
| 20. | North Las Vegas | 6.1% | 5.1%(+1.06)#20 | 5.1%(+1.07)#7,472 |
| 21. | Hawthorne | 6.1% | 5.1%(+1.000)#21 | 5.1%(+1.02)#7,583 |
| 22. | Schurz | 5.8% | 5.1%(+0.728)#22 | 5.1%(+0.746)#8,116 |
| 23. | Sunrise Manor | 5.8% | 5.1%(+0.690)#23 | 5.1%(+0.708)#8,207 |
| 24. | Spring Valley | 5.8% | 5.1%(+0.681)#24 | 5.1%(+0.699)#8,232 |
| 25. | Spanish Springs | 5.7% | 5.1%(+0.630)#25 | 5.1%(+0.647)#8,344 |
| 26. | Blue Diamond | 5.6% | 5.1%(+0.487)#26 | 5.1%(+0.504)#8,638 |
| 27. | Caliente | 5.5% | 5.1%(+0.448)#27 | 5.1%(+0.466)#8,702 |
| 28. | Silver Springs | 5.4% | 5.1%(+0.346)#28 | 5.1%(+0.363)#8,928 |
| 29. | Gardnerville | 5.4% | 5.1%(+0.305)#29 | 5.1%(+0.323)#9,022 |
| 30. | Elko | 5.3% | 5.1%(+0.270)#30 | 5.1%(+0.288)#9,109 |
| 31. | Fish Springs | 5.3% | 5.1%(+0.250)#31 | 5.1%(+0.268)#9,154 |
| 32. | Las Vegas | 5.2% | 5.1%(+0.175)#32 | 5.1%(+0.193)#9,342 |
| 33. | Paradise | 5.2% | 5.1%(+0.088)#33 | 5.1%(+0.106)#9,543 |
| 34. | Reno | 5.1% | 5.1%(+0.031)#34 | 5.1%(+0.049)#9,675 |
| 35. | Spring Creek | 4.9% | 5.1%(-0.134)#35 | 5.1%(-0.116)#10,079 |
| 36. | Mogul | 4.8% | 5.1%(-0.316)#36 | 5.1%(-0.298)#10,545 |
| 37. | Henderson | 4.7% | 5.1%(-0.387)#37 | 5.1%(-0.369)#10,725 |
| 38. | Incline Village | 4.6% | 5.1%(-0.488)#38 | 5.1%(-0.470)#10,951 |
| 39. | Lemmon Valley | 4.4% | 5.1%(-0.646)#39 | 5.1%(-0.628)#11,322 |
| 40. | Enterprise | 4.4% | 5.1%(-0.690)#40 | 5.1%(-0.672)#11,430 |
| 41. | Sparks | 4.3% | 5.1%(-0.793)#41 | 5.1%(-0.775)#11,665 |
| 42. | Boulder City | 4.2% | 5.1%(-0.861)#42 | 5.1%(-0.843)#11,829 |
| 43. | Skyland | 4.0% | 5.1%(-1.10)#43 | 5.1%(-1.08)#12,442 |
| 44. | Round Hill Village | 3.9% | 5.1%(-1.13)#44 | 5.1%(-1.11)#12,516 |
| 45. | Indian Hills | 3.9% | 5.1%(-1.22)#45 | 5.1%(-1.20)#12,686 |
| 46. | Carson | 3.8% | 5.1%(-1.23)#46 | 5.1%(-1.21)#12,750 |
| 47. | Summerlin South | 3.7% | 5.1%(-1.35)#47 | 5.1%(-1.33)#13,006 |
| 48. | Mesquite | 3.3% | 5.1%(-1.74)#48 | 5.1%(-1.73)#13,952 |
| 49. | Lovelock | 3.0% | 5.1%(-2.09)#49 | 5.1%(-2.07)#14,724 |
| 50. | Minden | 2.9% | 5.1%(-2.17)#50 | 5.1%(-2.15)#14,892 |
| 51. | Fernley | 2.8% | 5.1%(-2.30)#51 | 5.1%(-2.28)#15,180 |
| 52. | Laughlin | 2.6% | 5.1%(-2.42)#52 | 5.1%(-2.40)#15,415 |
| 53. | Gardnerville Ranchos | 2.5% | 5.1%(-2.60)#53 | 5.1%(-2.58)#15,718 |
| 54. | Yerington | 2.3% | 5.1%(-2.73)#54 | 5.1%(-2.71)#15,970 |
| 55. | Kingsbury | 2.2% | 5.1%(-2.86)#55 | 5.1%(-2.84)#16,205 |
| 56. | Fallon | 1.7% | 5.1%(-3.35)#56 | 5.1%(-3.33)#17,045 |
| 57. | Carter Springs | 1.6% | 5.1%(-3.43)#57 | 5.1%(-3.41)#17,172 |
| 58. | Verdi | 1.5% | 5.1%(-3.60)#58 | 5.1%(-3.58)#17,392 |
| 59. | East Valley | 1.3% | 5.1%(-3.74)#59 | 5.1%(-3.73)#17,587 |
| 60. | Winnemucca | 0.89% | 5.1%(-4.18)#60 | 5.1%(-4.16)#18,061 |
| 61. | Topaz Ranch Estates | 0.53% | 5.1%(-4.54)#61 | 5.1%(-4.52)#18,259 |
1
2Common Questions
What are the Top 10 Cities with the Highest Percentage of Population with a Degree in Psychology in Nevada?
Top 10 Cities with the Highest Percentage of Population with a Degree in Psychology in Nevada are:
#1
65.2%
#2
37.5%
#3
19.9%
#4
17.9%
#5
16.7%
#6
14.9%
#7
14.6%
#8
13.8%
#9
10.2%
#10
10.1%
What city has the Highest Percentage of Population with a Degree in Psychology in Nevada?
Kingston has the Highest Percentage of Population with a Degree in Psychology in Nevada with 65.2%.
What is the Percentage of Population with a Degree in Psychology in the State of Nevada?
Percentage of Population with a Degree in Psychology in Nevada is 5.1%.
What is the Percentage of Population with a Degree in Psychology in the United States?
Percentage of Population with a Degree in Psychology in the United States is 5.1%.