Cities with the Highest Percentage of Population with a Degree in Psychology in Kentucky
RELATED REPORTS & OPTIONS
Psychology
Kentucky
Compare Cities
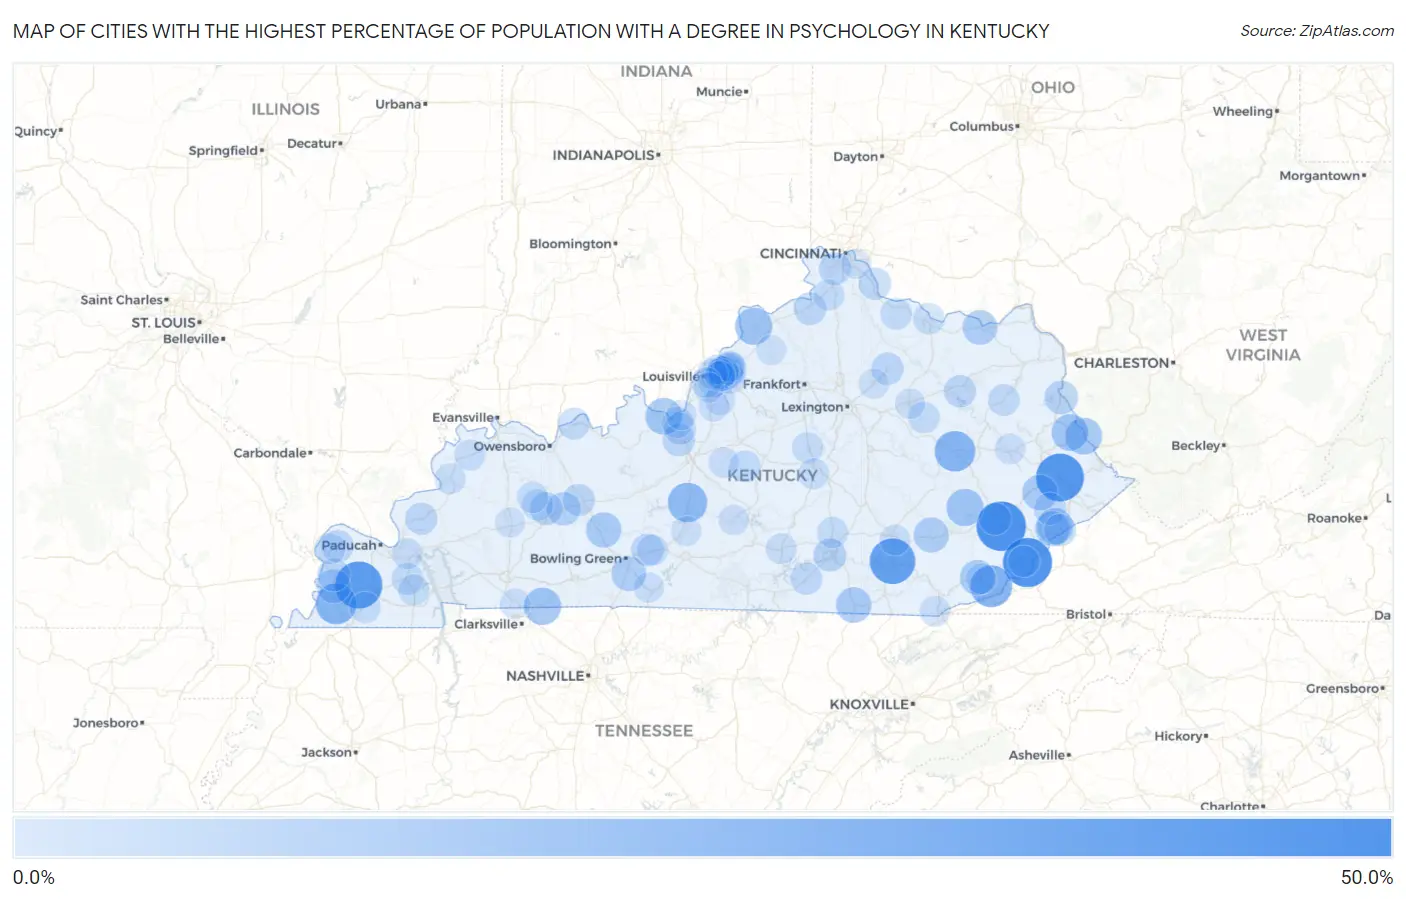
Map of Cities with the Highest Percentage of Population with a Degree in Psychology in Kentucky
0.0%
50.0%
Cities with the Highest Percentage of Population with a Degree in Psychology in Kentucky
| City | % Graduates | vs State | vs National | |
| 1. | Jeff | 50.0% | 4.7%(+45.3)#1 | 5.1%(+44.9)#177 |
| 2. | Lynch | 49.0% | 4.7%(+44.3)#2 | 5.1%(+43.9)#213 |
| 3. | Betsy Layne | 46.4% | 4.7%(+41.6)#3 | 5.1%(+41.3)#233 |
| 4. | Fancy Farm | 44.8% | 4.7%(+40.1)#4 | 5.1%(+39.7)#245 |
| 5. | North Corbin | 41.2% | 4.7%(+36.5)#5 | 5.1%(+36.2)#290 |
| 6. | Cawood | 32.6% | 4.7%(+27.8)#6 | 5.1%(+27.5)#444 |
| 7. | Clinton | 30.5% | 4.7%(+25.8)#7 | 5.1%(+25.4)#484 |
| 8. | Campton | 30.0% | 4.7%(+25.3)#8 | 5.1%(+24.9)#495 |
| 9. | Bonnieville | 27.3% | 4.7%(+22.6)#9 | 5.1%(+22.2)#589 |
| 10. | Guthrie | 22.4% | 4.7%(+17.7)#10 | 5.1%(+17.3)#848 |
| 11. | Bedford | 22.2% | 4.7%(+17.5)#11 | 5.1%(+17.2)#861 |
| 12. | Buckhorn | 22.2% | 4.7%(+17.5)#12 | 5.1%(+17.2)#873 |
| 13. | Warfield | 21.4% | 4.7%(+16.7)#13 | 5.1%(+16.4)#925 |
| 14. | Inez | 21.4% | 4.7%(+16.7)#14 | 5.1%(+16.3)#932 |
| 15. | Doe Valley | 21.2% | 4.7%(+16.4)#15 | 5.1%(+16.1)#945 |
| 16. | Mcroberts | 20.0% | 4.7%(+15.3)#16 | 5.1%(+14.9)#1,031 |
| 17. | Meadow Vale | 18.8% | 4.7%(+14.1)#17 | 5.1%(+13.8)#1,167 |
| 18. | Wayland | 18.8% | 4.7%(+14.0)#18 | 5.1%(+13.7)#1,174 |
| 19. | Pine Knot | 18.4% | 4.7%(+13.6)#19 | 5.1%(+13.3)#1,212 |
| 20. | Woodbury | 18.2% | 4.7%(+13.5)#20 | 5.1%(+13.1)#1,247 |
| 21. | Loyall | 17.6% | 4.7%(+12.9)#21 | 5.1%(+12.6)#1,307 |
| 22. | Manchester | 17.6% | 4.7%(+12.9)#22 | 5.1%(+12.6)#1,313 |
| 23. | Fleming Neon | 17.1% | 4.7%(+12.4)#23 | 5.1%(+12.1)#1,367 |
| 24. | Vanceburg | 17.0% | 4.7%(+12.3)#24 | 5.1%(+11.9)#1,373 |
| 25. | Plano | 16.9% | 4.7%(+12.2)#25 | 5.1%(+11.9)#1,380 |
| 26. | Arlington | 15.4% | 4.7%(+10.7)#26 | 5.1%(+10.3)#1,631 |
| 27. | Louisa | 14.6% | 4.7%(+9.86)#27 | 5.1%(+9.53)#1,774 |
| 28. | Rockport | 14.3% | 4.7%(+9.56)#28 | 5.1%(+9.23)#1,840 |
| 29. | Worthington Hills | 14.0% | 4.7%(+9.29)#29 | 5.1%(+8.96)#1,902 |
| 30. | Burnside | 13.5% | 4.7%(+8.74)#30 | 5.1%(+8.41)#2,012 |
| 31. | Bardwell | 12.9% | 4.7%(+8.18)#31 | 5.1%(+7.85)#2,154 |
| 32. | South Carrollton | 12.9% | 4.7%(+8.18)#32 | 5.1%(+7.85)#2,161 |
| 33. | Glencoe | 12.5% | 4.7%(+7.78)#33 | 5.1%(+7.45)#2,269 |
| 34. | Oakland | 12.5% | 4.7%(+7.78)#34 | 5.1%(+7.45)#2,281 |
| 35. | Vine Grove | 12.4% | 4.7%(+7.72)#35 | 5.1%(+7.39)#2,306 |
| 36. | Elsmere | 12.2% | 4.7%(+7.46)#36 | 5.1%(+7.13)#2,385 |
| 37. | Millersburg | 12.1% | 4.7%(+7.37)#37 | 5.1%(+7.04)#2,418 |
| 38. | Hazard | 12.0% | 4.7%(+7.31)#38 | 5.1%(+6.98)#2,436 |
| 39. | Beaver Dam | 11.9% | 4.7%(+7.21)#39 | 5.1%(+6.88)#2,481 |
| 40. | Mentor | 11.9% | 4.7%(+7.18)#40 | 5.1%(+6.85)#2,496 |
| 41. | Wheelwright | 11.9% | 4.7%(+7.14)#41 | 5.1%(+6.81)#2,505 |
| 42. | La Center | 11.7% | 4.7%(+6.98)#42 | 5.1%(+6.65)#2,569 |
| 43. | Salem | 11.6% | 4.7%(+6.91)#43 | 5.1%(+6.58)#2,591 |
| 44. | Lakeview Heights | 11.6% | 4.7%(+6.89)#44 | 5.1%(+6.56)#2,600 |
| 45. | Jenkins | 11.5% | 4.7%(+6.77)#45 | 5.1%(+6.44)#2,645 |
| 46. | Monticello | 11.2% | 4.7%(+6.51)#46 | 5.1%(+6.18)#2,745 |
| 47. | Fort Knox | 11.0% | 4.7%(+6.33)#47 | 5.1%(+6.00)#2,835 |
| 48. | Benton | 10.7% | 4.7%(+5.95)#48 | 5.1%(+5.62)#2,987 |
| 49. | Lewisport | 10.6% | 4.7%(+5.89)#49 | 5.1%(+5.56)#3,009 |
| 50. | Sandy Hook | 10.5% | 4.7%(+5.81)#50 | 5.1%(+5.48)#3,058 |
| 51. | Brooksville | 10.3% | 4.7%(+5.54)#51 | 5.1%(+5.21)#3,213 |
| 52. | Loretto | 10.3% | 4.7%(+5.54)#52 | 5.1%(+5.21)#3,215 |
| 53. | Jeffersonville | 10.1% | 4.7%(+5.34)#53 | 5.1%(+5.01)#3,326 |
| 54. | Benham | 10.0% | 4.7%(+5.28)#54 | 5.1%(+4.95)#3,363 |
| 55. | Plantation | 9.9% | 4.7%(+5.16)#55 | 5.1%(+4.83)#3,445 |
| 56. | Wingo | 9.8% | 4.7%(+5.08)#56 | 5.1%(+4.75)#3,488 |
| 57. | Maysville | 9.7% | 4.7%(+5.02)#57 | 5.1%(+4.69)#3,525 |
| 58. | Science Hill | 9.7% | 4.7%(+4.96)#58 | 5.1%(+4.63)#3,547 |
| 59. | Muldraugh | 9.6% | 4.7%(+4.89)#59 | 5.1%(+4.56)#3,580 |
| 60. | Hardin | 9.5% | 4.7%(+4.80)#60 | 5.1%(+4.47)#3,634 |
| 61. | Bremen | 9.5% | 4.7%(+4.80)#61 | 5.1%(+4.47)#3,640 |
| 62. | Sacramento | 9.4% | 4.7%(+4.65)#62 | 5.1%(+4.32)#3,737 |
| 63. | Verona | 9.3% | 4.7%(+4.55)#63 | 5.1%(+4.22)#3,812 |
| 64. | Harrodsburg | 9.3% | 4.7%(+4.54)#64 | 5.1%(+4.21)#3,826 |
| 65. | Smiths Grove | 9.1% | 4.7%(+4.37)#65 | 5.1%(+4.04)#3,943 |
| 66. | Barlow | 9.1% | 4.7%(+4.37)#66 | 5.1%(+4.04)#3,948 |
| 67. | Waverly | 9.1% | 4.7%(+4.37)#67 | 5.1%(+4.04)#3,955 |
| 68. | Junction City | 9.1% | 4.7%(+4.33)#68 | 5.1%(+4.00)#3,993 |
| 69. | London | 9.0% | 4.7%(+4.32)#69 | 5.1%(+3.99)#4,000 |
| 70. | Sturgis | 8.9% | 4.7%(+4.23)#70 | 5.1%(+3.90)#4,064 |
| 71. | Kingsley | 8.9% | 4.7%(+4.14)#71 | 5.1%(+3.81)#4,121 |
| 72. | Lyndon | 8.8% | 4.7%(+4.08)#72 | 5.1%(+3.75)#4,169 |
| 73. | Fincastle | 8.7% | 4.7%(+4.02)#73 | 5.1%(+3.69)#4,218 |
| 74. | Harlan | 8.7% | 4.7%(+4.00)#74 | 5.1%(+3.67)#4,228 |
| 75. | Calvert City | 8.6% | 4.7%(+3.90)#75 | 5.1%(+3.57)#4,319 |
| 76. | Middletown | 8.6% | 4.7%(+3.90)#76 | 5.1%(+3.57)#4,325 |
| 77. | Russell Springs | 8.6% | 4.7%(+3.85)#77 | 5.1%(+3.52)#4,350 |
| 78. | Glenview Hills | 8.5% | 4.7%(+3.81)#78 | 5.1%(+3.48)#4,386 |
| 79. | Orchard Grass Hills | 8.5% | 4.7%(+3.80)#79 | 5.1%(+3.47)#4,394 |
| 80. | Middlesborough | 8.5% | 4.7%(+3.77)#80 | 5.1%(+3.44)#4,414 |
| 81. | Salyersville | 8.4% | 4.7%(+3.65)#81 | 5.1%(+3.32)#4,510 |
| 82. | Graymoor Devondale | 8.4% | 4.7%(+3.65)#82 | 5.1%(+3.32)#4,517 |
| 83. | Hebron Estates | 8.3% | 4.7%(+3.61)#83 | 5.1%(+3.28)#4,544 |
| 84. | Murray Hill | 8.3% | 4.7%(+3.61)#84 | 5.1%(+3.28)#4,558 |
| 85. | Mockingbird Valley | 8.3% | 4.7%(+3.61)#85 | 5.1%(+3.28)#4,592 |
| 86. | New Haven | 8.2% | 4.7%(+3.50)#86 | 5.1%(+3.17)#4,683 |
| 87. | Oak Grove | 8.1% | 4.7%(+3.39)#87 | 5.1%(+3.06)#4,757 |
| 88. | Greensburg | 8.0% | 4.7%(+3.28)#88 | 5.1%(+2.95)#4,862 |
| 89. | Heritage Creek | 8.0% | 4.7%(+3.24)#89 | 5.1%(+2.91)#4,918 |
| 90. | Scottsville | 7.8% | 4.7%(+3.12)#90 | 5.1%(+2.79)#5,024 |
| 91. | Norwood | 7.7% | 4.7%(+3.01)#91 | 5.1%(+2.68)#5,130 |
| 92. | Mount Sterling | 7.7% | 4.7%(+2.99)#92 | 5.1%(+2.66)#5,152 |
| 93. | Parkway Village | 7.7% | 4.7%(+2.95)#93 | 5.1%(+2.62)#5,227 |
| 94. | New Castle | 7.6% | 4.7%(+2.92)#94 | 5.1%(+2.59)#5,245 |
| 95. | Lynnview | 7.6% | 4.7%(+2.84)#95 | 5.1%(+2.51)#5,314 |
| 96. | Horse Cave | 7.5% | 4.7%(+2.73)#96 | 5.1%(+2.40)#5,442 |
| 97. | Paris | 7.4% | 4.7%(+2.68)#97 | 5.1%(+2.35)#5,513 |
| 98. | Crestview | 7.4% | 4.7%(+2.63)#98 | 5.1%(+2.30)#5,575 |
| 99. | West Point | 7.3% | 4.7%(+2.62)#99 | 5.1%(+2.29)#5,588 |
| 100. | Mortons Gap | 7.3% | 4.7%(+2.60)#100 | 5.1%(+2.27)#5,619 |
Common Questions
What are the Top 10 Cities with the Highest Percentage of Population with a Degree in Psychology in Kentucky?
Top 10 Cities with the Highest Percentage of Population with a Degree in Psychology in Kentucky are:
#1
50.0%
#2
49.0%
#3
46.4%
#4
44.8%
#5
41.2%
#6
32.6%
#7
30.5%
#8
30.0%
#9
27.3%
#10
22.4%
What city has the Highest Percentage of Population with a Degree in Psychology in Kentucky?
Jeff has the Highest Percentage of Population with a Degree in Psychology in Kentucky with 50.0%.
What is the Percentage of Population with a Degree in Psychology in the State of Kentucky?
Percentage of Population with a Degree in Psychology in Kentucky is 4.7%.
What is the Percentage of Population with a Degree in Psychology in the United States?
Percentage of Population with a Degree in Psychology in the United States is 5.1%.