Cities with the Highest Percentage of Population with a Degree in Psychology in Nebraska
RELATED REPORTS & OPTIONS
Psychology
Nebraska
Compare Cities
Map of Cities with the Highest Percentage of Population with a Degree in Psychology in Nebraska
0.0%
100.0%
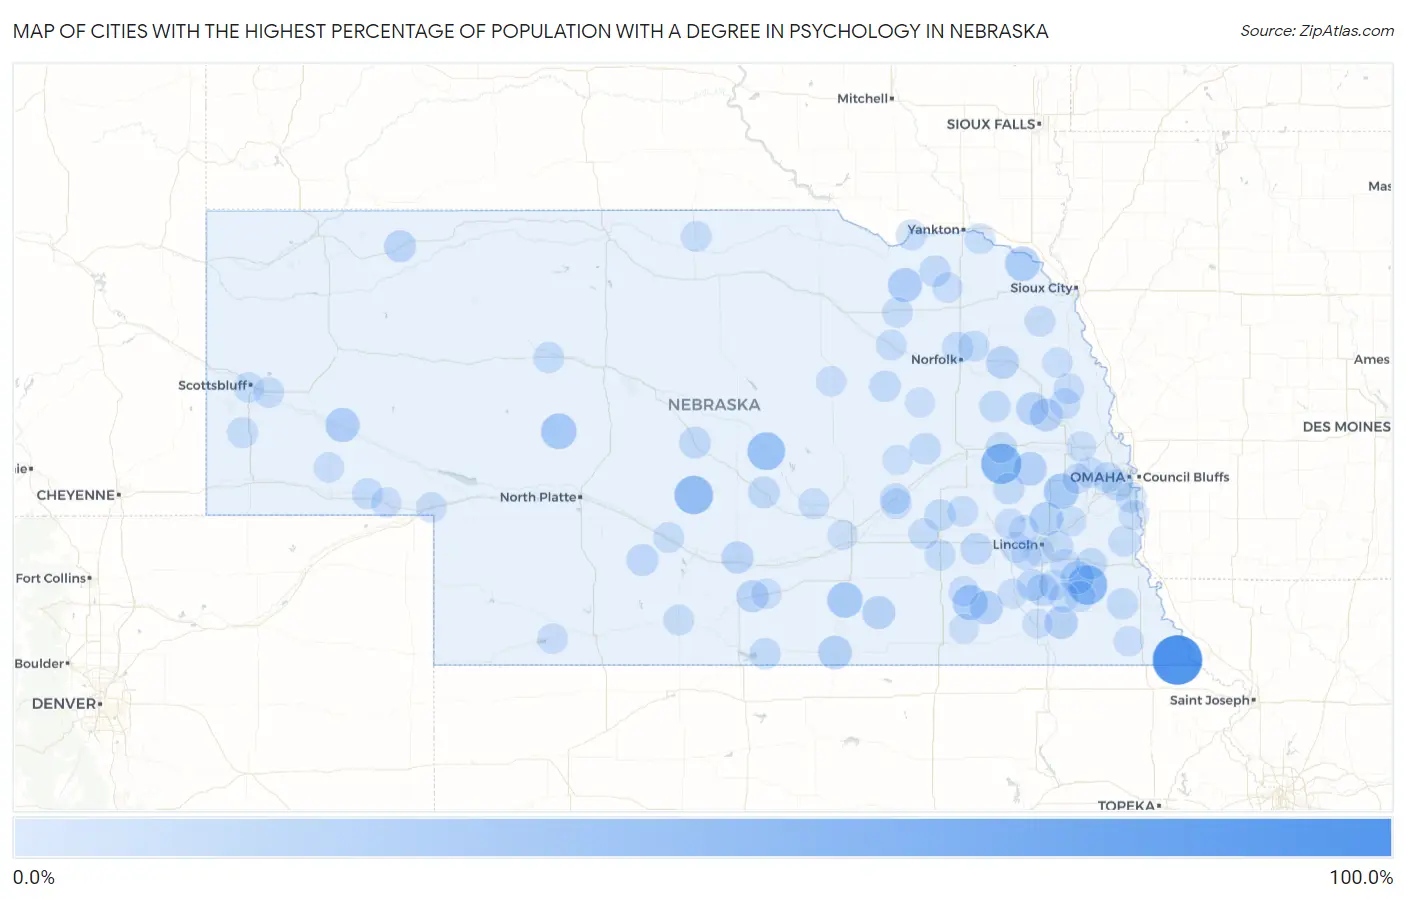
Cities with the Highest Percentage of Population with a Degree in Psychology in Nebraska
| City | % Graduates | vs State | vs National | |
| 1. | Preston | 100.0% | 4.3%(+95.7)#1 | 5.1%(+94.9)#46 |
| 2. | Octavia | 53.8% | 4.3%(+49.6)#2 | 5.1%(+48.8)#143 |
| 3. | Burr | 50.0% | 4.3%(+45.7)#3 | 5.1%(+44.9)#205 |
| 4. | Oconto | 45.9% | 4.3%(+41.7)#4 | 5.1%(+40.9)#238 |
| 5. | Arcadia | 41.7% | 4.3%(+37.4)#5 | 5.1%(+36.6)#284 |
| 6. | Tryon | 31.8% | 4.3%(+27.6)#6 | 5.1%(+26.8)#458 |
| 7. | Ayr | 30.8% | 4.3%(+26.5)#7 | 5.1%(+25.7)#478 |
| 8. | Ithaca | 30.0% | 4.3%(+25.7)#8 | 5.1%(+24.9)#497 |
| 9. | Tobias | 28.6% | 4.3%(+24.3)#9 | 5.1%(+23.5)#545 |
| 10. | Newcastle | 27.7% | 4.3%(+23.4)#10 | 5.1%(+22.6)#576 |
| 11. | Broadwater | 25.0% | 4.3%(+20.7)#11 | 5.1%(+19.9)#711 |
| 12. | Bazile Mills | 25.0% | 4.3%(+20.7)#12 | 5.1%(+19.9)#724 |
| 13. | Davey | 23.3% | 4.3%(+19.1)#13 | 5.1%(+18.3)#796 |
| 14. | Red Cloud | 22.8% | 4.3%(+18.5)#14 | 5.1%(+17.8)#822 |
| 15. | Prague | 21.7% | 4.3%(+17.5)#15 | 5.1%(+16.7)#898 |
| 16. | Western | 21.1% | 4.3%(+16.8)#16 | 5.1%(+16.0)#956 |
| 17. | Douglas | 20.8% | 4.3%(+16.6)#17 | 5.1%(+15.8)#976 |
| 18. | Filley | 20.0% | 4.3%(+15.7)#18 | 5.1%(+14.9)#1,062 |
| 19. | Deweese | 20.0% | 4.3%(+15.7)#19 | 5.1%(+14.9)#1,069 |
| 20. | Scribner | 19.4% | 4.3%(+15.1)#20 | 5.1%(+14.3)#1,115 |
| 21. | Snyder | 19.0% | 4.3%(+14.8)#21 | 5.1%(+14.0)#1,149 |
| 22. | Pilger | 18.9% | 4.3%(+14.7)#22 | 5.1%(+13.9)#1,163 |
| 23. | Princeton | 16.3% | 4.3%(+12.1)#23 | 5.1%(+11.3)#1,479 |
| 24. | Cortland | 16.1% | 4.3%(+11.8)#24 | 5.1%(+11.0)#1,516 |
| 25. | Elm Creek | 15.8% | 4.3%(+11.6)#25 | 5.1%(+10.8)#1,554 |
| 26. | Funk | 15.4% | 4.3%(+11.1)#26 | 5.1%(+10.3)#1,634 |
| 27. | Clinton | 15.4% | 4.3%(+11.1)#27 | 5.1%(+10.3)#1,640 |
| 28. | Beaver Crossing | 15.2% | 4.3%(+10.9)#28 | 5.1%(+10.1)#1,670 |
| 29. | Farnam | 14.7% | 4.3%(+10.4)#29 | 5.1%(+9.65)#1,736 |
| 30. | Hallam | 14.6% | 4.3%(+10.4)#30 | 5.1%(+9.58)#1,756 |
| 31. | Merna | 14.0% | 4.3%(+9.69)#31 | 5.1%(+8.90)#1,916 |
| 32. | Litchfield | 13.8% | 4.3%(+9.53)#32 | 5.1%(+8.74)#1,942 |
| 33. | Genoa | 13.3% | 4.3%(+9.07)#33 | 5.1%(+8.28)#2,043 |
| 34. | Petersburg | 13.2% | 4.3%(+8.98)#34 | 5.1%(+8.18)#2,086 |
| 35. | Bloomfield | 12.9% | 4.3%(+8.67)#35 | 5.1%(+7.88)#2,147 |
| 36. | Ralston | 12.8% | 4.3%(+8.57)#36 | 5.1%(+7.78)#2,174 |
| 37. | Clarkson | 12.8% | 4.3%(+8.53)#37 | 5.1%(+7.74)#2,185 |
| 38. | Unadilla | 12.8% | 4.3%(+8.53)#38 | 5.1%(+7.74)#2,186 |
| 39. | Brainard | 12.7% | 4.3%(+8.47)#39 | 5.1%(+7.68)#2,200 |
| 40. | Benedict | 12.5% | 4.3%(+8.24)#40 | 5.1%(+7.45)#2,264 |
| 41. | Naponee | 12.5% | 4.3%(+8.24)#41 | 5.1%(+7.45)#2,291 |
| 42. | Hadar | 12.1% | 4.3%(+7.86)#42 | 5.1%(+7.07)#2,410 |
| 43. | Johnson | 12.0% | 4.3%(+7.74)#43 | 5.1%(+6.95)#2,456 |
| 44. | Hoskins | 11.5% | 4.3%(+7.22)#44 | 5.1%(+6.42)#2,658 |
| 45. | Walton | 11.1% | 4.3%(+6.85)#45 | 5.1%(+6.06)#2,790 |
| 46. | Schuyler | 10.8% | 4.3%(+6.57)#46 | 5.1%(+5.78)#2,920 |
| 47. | Lodgepole | 10.8% | 4.3%(+6.55)#47 | 5.1%(+5.76)#2,931 |
| 48. | Mccool Junction | 10.8% | 4.3%(+6.51)#48 | 5.1%(+5.72)#2,948 |
| 49. | Mullen | 10.7% | 4.3%(+6.48)#49 | 5.1%(+5.69)#2,962 |
| 50. | Nehawka | 10.5% | 4.3%(+6.27)#50 | 5.1%(+5.48)#3,074 |
| 51. | Harrisburg | 10.5% | 4.3%(+6.27)#51 | 5.1%(+5.48)#3,076 |
| 52. | Overland | 10.4% | 4.3%(+6.19)#52 | 5.1%(+5.40)#3,118 |
| 53. | Offutt Afb | 10.4% | 4.3%(+6.13)#53 | 5.1%(+5.33)#3,142 |
| 54. | Sterling | 10.4% | 4.3%(+6.11)#54 | 5.1%(+5.32)#3,152 |
| 55. | Gresham | 10.3% | 4.3%(+6.09)#55 | 5.1%(+5.29)#3,174 |
| 56. | Howard City Boelus | 10.3% | 4.3%(+6.09)#56 | 5.1%(+5.29)#3,179 |
| 57. | Arapahoe | 10.3% | 4.3%(+6.01)#57 | 5.1%(+5.22)#3,205 |
| 58. | Uehling | 10.2% | 4.3%(+5.91)#58 | 5.1%(+5.12)#3,273 |
| 59. | Terrytown | 10.1% | 4.3%(+5.89)#59 | 5.1%(+5.09)#3,285 |
| 60. | Santee | 10.0% | 4.3%(+5.74)#60 | 5.1%(+4.95)#3,380 |
| 61. | St Helena | 10.0% | 4.3%(+5.74)#61 | 5.1%(+4.95)#3,397 |
| 62. | Neligh | 10.0% | 4.3%(+5.70)#62 | 5.1%(+4.91)#3,412 |
| 63. | Cozad | 9.9% | 4.3%(+5.65)#63 | 5.1%(+4.86)#3,431 |
| 64. | Springview | 9.7% | 4.3%(+5.42)#64 | 5.1%(+4.63)#3,556 |
| 65. | Bradshaw | 9.6% | 4.3%(+5.38)#65 | 5.1%(+4.59)#3,570 |
| 66. | Waterloo | 9.6% | 4.3%(+5.37)#66 | 5.1%(+4.58)#3,575 |
| 67. | Emerson | 9.6% | 4.3%(+5.36)#67 | 5.1%(+4.56)#3,582 |
| 68. | Boys Town | 9.6% | 4.3%(+5.36)#68 | 5.1%(+4.56)#3,583 |
| 69. | Minatare | 9.6% | 4.3%(+5.32)#69 | 5.1%(+4.52)#3,608 |
| 70. | Brunswick | 9.5% | 4.3%(+5.26)#70 | 5.1%(+4.47)#3,648 |
| 71. | Oakland | 9.5% | 4.3%(+5.21)#71 | 5.1%(+4.41)#3,680 |
| 72. | Central City | 9.2% | 4.3%(+4.96)#72 | 5.1%(+4.17)#3,850 |
| 73. | Big Springs | 8.9% | 4.3%(+4.60)#73 | 5.1%(+3.81)#4,120 |
| 74. | Yutan | 8.8% | 4.3%(+4.59)#74 | 5.1%(+3.80)#4,130 |
| 75. | Pleasant Dale | 8.7% | 4.3%(+4.44)#75 | 5.1%(+3.64)#4,261 |
| 76. | Wausa | 8.5% | 4.3%(+4.25)#76 | 5.1%(+3.46)#4,401 |
| 77. | Bartlett | 8.5% | 4.3%(+4.22)#77 | 5.1%(+3.42)#4,429 |
| 78. | Bancroft | 8.4% | 4.3%(+4.15)#78 | 5.1%(+3.36)#4,477 |
| 79. | Chappell | 8.3% | 4.3%(+4.07)#79 | 5.1%(+3.28)#4,551 |
| 80. | Trenton | 8.3% | 4.3%(+4.07)#80 | 5.1%(+3.28)#4,565 |
| 81. | Gurley | 8.3% | 4.3%(+4.07)#81 | 5.1%(+3.28)#4,575 |
| 82. | Axtell | 8.1% | 4.3%(+3.79)#82 | 5.1%(+3.00)#4,808 |
| 83. | Humboldt | 8.0% | 4.3%(+3.74)#83 | 5.1%(+2.95)#4,865 |
| 84. | Milligan | 8.0% | 4.3%(+3.74)#84 | 5.1%(+2.95)#4,879 |
| 85. | Firth | 8.0% | 4.3%(+3.70)#85 | 5.1%(+2.90)#4,922 |
| 86. | Garland | 7.7% | 4.3%(+3.43)#86 | 5.1%(+2.64)#5,201 |
| 87. | Plattsmouth | 7.6% | 4.3%(+3.32)#87 | 5.1%(+2.53)#5,297 |
| 88. | Greenwood | 7.5% | 4.3%(+3.27)#88 | 5.1%(+2.48)#5,358 |
| 89. | Alda | 7.4% | 4.3%(+3.15)#89 | 5.1%(+2.36)#5,492 |
| 90. | Yankee Hill | 7.3% | 4.3%(+3.06)#90 | 5.1%(+2.27)#5,623 |
| 91. | Adams | 7.3% | 4.3%(+3.01)#91 | 5.1%(+2.22)#5,667 |
| 92. | Newman Grove | 7.2% | 4.3%(+2.97)#92 | 5.1%(+2.18)#5,719 |
| 93. | Fullerton | 7.1% | 4.3%(+2.88)#93 | 5.1%(+2.09)#5,818 |
| 94. | Denton | 7.1% | 4.3%(+2.88)#94 | 5.1%(+2.09)#5,861 |
| 95. | Alexandria | 7.1% | 4.3%(+2.88)#95 | 5.1%(+2.09)#5,869 |
| 96. | Beatrice | 7.1% | 4.3%(+2.86)#96 | 5.1%(+2.07)#5,884 |
| 97. | Arlington | 7.0% | 4.3%(+2.74)#97 | 5.1%(+1.94)#6,042 |
| 98. | Bennet | 7.0% | 4.3%(+2.70)#98 | 5.1%(+1.91)#6,100 |
| 99. | Wilber | 6.8% | 4.3%(+2.53)#99 | 5.1%(+1.73)#6,346 |
| 100. | Malcolm | 6.7% | 4.3%(+2.47)#100 | 5.1%(+1.68)#6,423 |
Common Questions
What are the Top 10 Cities with the Highest Percentage of Population with a Degree in Psychology in Nebraska?
Top 10 Cities with the Highest Percentage of Population with a Degree in Psychology in Nebraska are:
What city has the Highest Percentage of Population with a Degree in Psychology in Nebraska?
Preston has the Highest Percentage of Population with a Degree in Psychology in Nebraska with 100.0%.
What is the Percentage of Population with a Degree in Psychology in the State of Nebraska?
Percentage of Population with a Degree in Psychology in Nebraska is 4.3%.
What is the Percentage of Population with a Degree in Psychology in the United States?
Percentage of Population with a Degree in Psychology in the United States is 5.1%.