Cities with the Highest Percentage of Population with a Degree in Psychology in Indiana
RELATED REPORTS & OPTIONS
Psychology
Indiana
Compare Cities
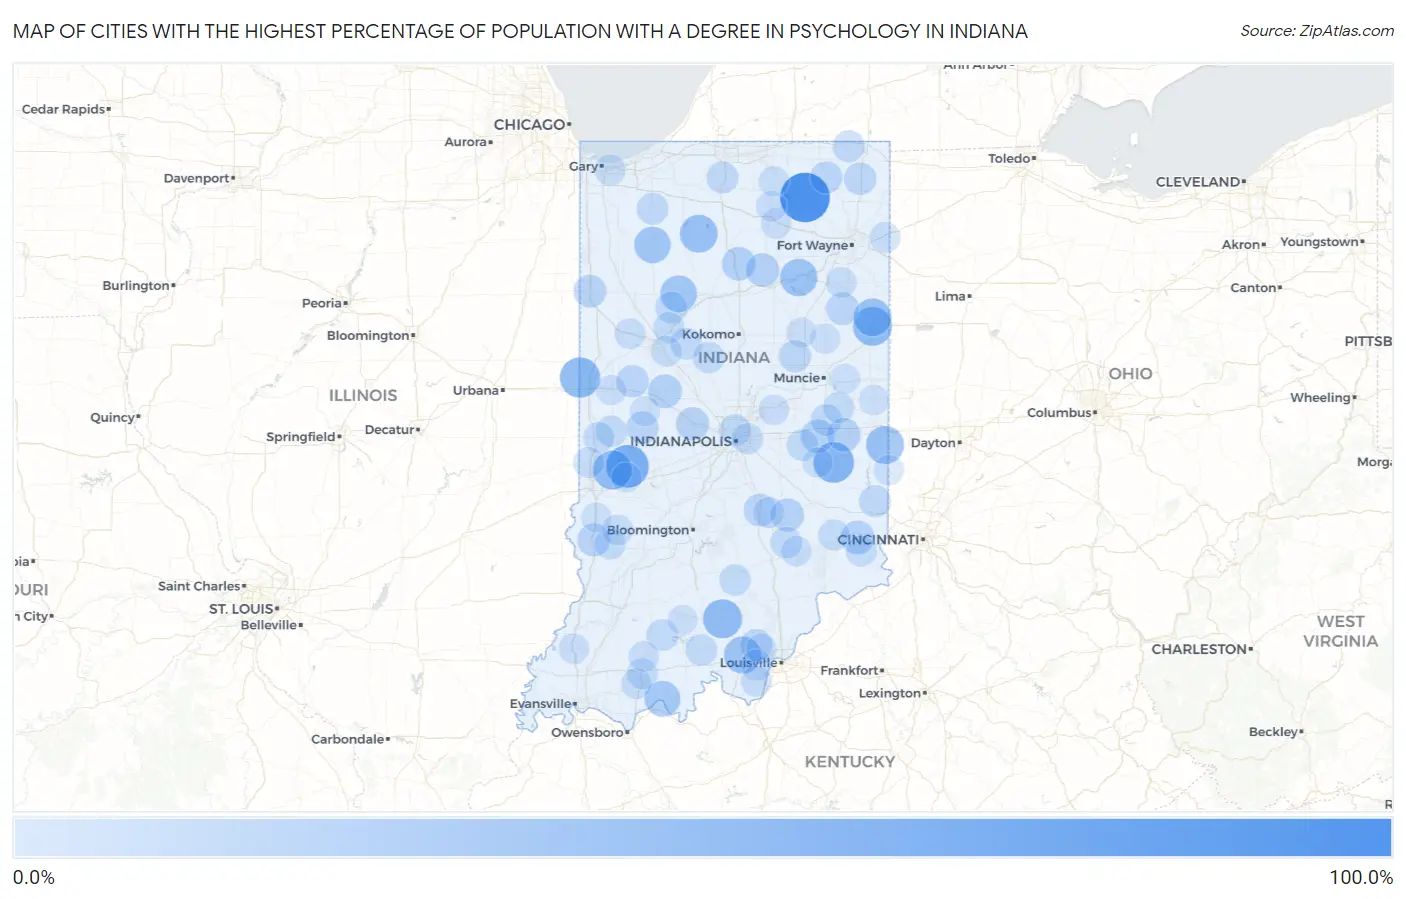
Map of Cities with the Highest Percentage of Population with a Degree in Psychology in Indiana
0.0%
100.0%
Cities with the Highest Percentage of Population with a Degree in Psychology in Indiana
| City | % Graduates | vs State | vs National | |
| 1. | Kimmell | 100.0% | 4.1%(+95.9)#1 | 5.1%(+94.9)#10 |
| 2. | Petersville | 100.0% | 4.1%(+95.9)#2 | 5.1%(+94.9)#23 |
| 3. | Letts | 100.0% | 4.1%(+95.9)#3 | 5.1%(+94.9)#35 |
| 4. | Leiters Ford | 73.7% | 4.1%(+69.6)#4 | 5.1%(+68.6)#66 |
| 5. | Royerton | 68.3% | 4.1%(+64.1)#5 | 5.1%(+63.2)#77 |
| 6. | Carbon | 66.7% | 4.1%(+62.6)#6 | 5.1%(+61.6)#83 |
| 7. | Glenwood | 57.1% | 4.1%(+53.0)#7 | 5.1%(+52.1)#128 |
| 8. | Otter Lake | 57.1% | 4.1%(+53.0)#8 | 5.1%(+52.1)#129 |
| 9. | State Line City | 55.6% | 4.1%(+51.4)#9 | 5.1%(+50.5)#134 |
| 10. | Bryant | 50.0% | 4.1%(+45.9)#10 | 5.1%(+44.9)#170 |
| 11. | Libertyville | 50.0% | 4.1%(+45.9)#11 | 5.1%(+44.9)#176 |
| 12. | Fontanet | 50.0% | 4.1%(+45.9)#12 | 5.1%(+44.9)#181 |
| 13. | Vicksburg | 50.0% | 4.1%(+45.9)#13 | 5.1%(+44.9)#183 |
| 14. | Livonia | 50.0% | 4.1%(+45.9)#14 | 5.1%(+44.9)#191 |
| 15. | Boston | 44.4% | 4.1%(+40.3)#15 | 5.1%(+39.4)#252 |
| 16. | Geneva | 44.0% | 4.1%(+39.9)#16 | 5.1%(+38.9)#256 |
| 17. | Monterey | 43.8% | 4.1%(+39.6)#17 | 5.1%(+38.7)#260 |
| 18. | Andrews | 42.0% | 4.1%(+37.9)#18 | 5.1%(+36.9)#276 |
| 19. | New Salisbury | 40.2% | 4.1%(+36.1)#19 | 5.1%(+35.1)#296 |
| 20. | Idaville | 38.5% | 4.1%(+34.3)#20 | 5.1%(+33.4)#331 |
| 21. | Medaryville | 37.5% | 4.1%(+33.4)#21 | 5.1%(+32.4)#341 |
| 22. | Reddington | 36.7% | 4.1%(+32.6)#22 | 5.1%(+31.7)#360 |
| 23. | Troy | 34.4% | 4.1%(+30.3)#23 | 5.1%(+29.3)#393 |
| 24. | Underwood | 25.7% | 4.1%(+21.6)#24 | 5.1%(+20.7)#655 |
| 25. | Darlington | 25.0% | 4.1%(+20.9)#25 | 5.1%(+19.9)#680 |
| 26. | Moores Hill | 25.0% | 4.1%(+20.9)#26 | 5.1%(+19.9)#683 |
| 27. | Dunreith | 25.0% | 4.1%(+20.9)#27 | 5.1%(+19.9)#694 |
| 28. | Macy | 25.0% | 4.1%(+20.9)#28 | 5.1%(+19.9)#696 |
| 29. | Dublin | 24.6% | 4.1%(+20.5)#29 | 5.1%(+19.6)#733 |
| 30. | Roann | 23.8% | 4.1%(+19.7)#30 | 5.1%(+18.8)#773 |
| 31. | Haysville | 23.2% | 4.1%(+19.1)#31 | 5.1%(+18.2)#804 |
| 32. | Lizton | 22.8% | 4.1%(+18.6)#32 | 5.1%(+17.7)#824 |
| 33. | Hartsville | 22.7% | 4.1%(+18.6)#33 | 5.1%(+17.7)#831 |
| 34. | Sullivan | 21.7% | 4.1%(+17.6)#34 | 5.1%(+16.7)#900 |
| 35. | Kentland | 20.9% | 4.1%(+16.8)#35 | 5.1%(+15.9)#966 |
| 36. | Taylorsville | 20.1% | 4.1%(+16.0)#36 | 5.1%(+15.1)#1,021 |
| 37. | Wingate | 20.0% | 4.1%(+15.9)#37 | 5.1%(+14.9)#1,041 |
| 38. | Poneto | 20.0% | 4.1%(+15.9)#38 | 5.1%(+14.9)#1,056 |
| 39. | Ashley | 19.0% | 4.1%(+14.9)#39 | 5.1%(+14.0)#1,145 |
| 40. | Carrollton | 18.9% | 4.1%(+14.8)#40 | 5.1%(+13.9)#1,162 |
| 41. | Russellville | 18.8% | 4.1%(+14.6)#41 | 5.1%(+13.7)#1,172 |
| 42. | Summitville | 18.4% | 4.1%(+14.3)#42 | 5.1%(+13.3)#1,213 |
| 43. | Greenville | 17.9% | 4.1%(+13.8)#43 | 5.1%(+12.9)#1,270 |
| 44. | Wolcottville | 17.8% | 4.1%(+13.7)#44 | 5.1%(+12.8)#1,286 |
| 45. | Lakeville | 16.7% | 4.1%(+12.6)#45 | 5.1%(+11.6)#1,406 |
| 46. | Orland | 16.7% | 4.1%(+12.6)#46 | 5.1%(+11.6)#1,416 |
| 47. | Cedar Grove | 16.7% | 4.1%(+12.6)#47 | 5.1%(+11.6)#1,432 |
| 48. | Yeoman | 16.7% | 4.1%(+12.6)#48 | 5.1%(+11.6)#1,434 |
| 49. | La Crosse | 16.3% | 4.1%(+12.2)#49 | 5.1%(+11.2)#1,488 |
| 50. | English | 15.4% | 4.1%(+11.3)#50 | 5.1%(+10.3)#1,618 |
| 51. | Dubois | 15.4% | 4.1%(+11.3)#51 | 5.1%(+10.3)#1,623 |
| 52. | Bloomingdale | 15.4% | 4.1%(+11.3)#52 | 5.1%(+10.3)#1,624 |
| 53. | Rossville | 15.2% | 4.1%(+11.1)#53 | 5.1%(+10.2)#1,659 |
| 54. | Carthage | 15.0% | 4.1%(+10.9)#54 | 5.1%(+9.95)#1,686 |
| 55. | Michigantown | 14.8% | 4.1%(+10.7)#55 | 5.1%(+9.76)#1,717 |
| 56. | Scipio | 14.8% | 4.1%(+10.7)#56 | 5.1%(+9.73)#1,727 |
| 57. | Rocky Ripple | 14.7% | 4.1%(+10.6)#57 | 5.1%(+9.62)#1,746 |
| 58. | St. Anthony | 14.7% | 4.1%(+10.6)#58 | 5.1%(+9.62)#1,748 |
| 59. | Medora | 14.6% | 4.1%(+10.5)#59 | 5.1%(+9.58)#1,750 |
| 60. | New Castle | 14.6% | 4.1%(+10.5)#60 | 5.1%(+9.58)#1,758 |
| 61. | Osgood | 14.3% | 4.1%(+10.2)#61 | 5.1%(+9.23)#1,812 |
| 62. | Mooreland | 14.3% | 4.1%(+10.2)#62 | 5.1%(+9.23)#1,827 |
| 63. | Merriam | 13.6% | 4.1%(+9.47)#63 | 5.1%(+8.53)#1,991 |
| 64. | Clifford | 13.3% | 4.1%(+9.22)#64 | 5.1%(+8.28)#2,057 |
| 65. | Fairview | 13.3% | 4.1%(+9.22)#65 | 5.1%(+8.28)#2,069 |
| 66. | Montezuma | 13.2% | 4.1%(+9.04)#66 | 5.1%(+8.11)#2,102 |
| 67. | Warren Park | 13.1% | 4.1%(+9.03)#67 | 5.1%(+8.09)#2,109 |
| 68. | Dale | 13.0% | 4.1%(+8.93)#68 | 5.1%(+7.99)#2,124 |
| 69. | Americus | 13.0% | 4.1%(+8.89)#69 | 5.1%(+7.96)#2,137 |
| 70. | Dugger | 12.9% | 4.1%(+8.79)#70 | 5.1%(+7.85)#2,153 |
| 71. | Lanesville | 12.7% | 4.1%(+8.61)#71 | 5.1%(+7.68)#2,199 |
| 72. | Lake Station | 12.7% | 4.1%(+8.59)#72 | 5.1%(+7.66)#2,207 |
| 73. | Dillsboro | 12.7% | 4.1%(+8.55)#73 | 5.1%(+7.62)#2,217 |
| 74. | Universal | 12.5% | 4.1%(+8.39)#74 | 5.1%(+7.45)#2,276 |
| 75. | Uniondale | 12.5% | 4.1%(+8.39)#75 | 5.1%(+7.45)#2,280 |
| 76. | Jasonville | 12.1% | 4.1%(+8.01)#76 | 5.1%(+7.07)#2,401 |
| 77. | Dayton | 12.0% | 4.1%(+7.89)#77 | 5.1%(+6.95)#2,448 |
| 78. | Elizabeth | 12.0% | 4.1%(+7.89)#78 | 5.1%(+6.95)#2,461 |
| 79. | Woodburn | 11.9% | 4.1%(+7.81)#79 | 5.1%(+6.88)#2,483 |
| 80. | Otterbein | 11.9% | 4.1%(+7.81)#80 | 5.1%(+6.87)#2,484 |
| 81. | Gentryville | 11.8% | 4.1%(+7.65)#81 | 5.1%(+6.71)#2,549 |
| 82. | Winona Lake | 11.2% | 4.1%(+7.10)#82 | 5.1%(+6.16)#2,751 |
| 83. | Leesburg | 11.1% | 4.1%(+7.00)#83 | 5.1%(+6.06)#2,780 |
| 84. | Galena | 11.0% | 4.1%(+6.84)#84 | 5.1%(+5.90)#2,869 |
| 85. | North Vernon | 10.9% | 4.1%(+6.80)#85 | 5.1%(+5.87)#2,882 |
| 86. | Princeton | 10.9% | 4.1%(+6.75)#86 | 5.1%(+5.82)#2,910 |
| 87. | Huntingburg | 10.6% | 4.1%(+6.44)#87 | 5.1%(+5.50)#3,043 |
| 88. | New Paris | 10.2% | 4.1%(+6.11)#88 | 5.1%(+5.18)#3,237 |
| 89. | Ingalls | 10.0% | 4.1%(+5.89)#89 | 5.1%(+4.95)#3,350 |
| 90. | Veedersburg | 9.8% | 4.1%(+5.71)#90 | 5.1%(+4.77)#3,478 |
| 91. | West College Corner | 9.7% | 4.1%(+5.62)#91 | 5.1%(+4.68)#3,526 |
| 92. | Rushville | 9.6% | 4.1%(+5.52)#92 | 5.1%(+4.59)#3,571 |
| 93. | Parker City | 9.5% | 4.1%(+5.37)#93 | 5.1%(+4.43)#3,669 |
| 94. | Farmersburg | 9.4% | 4.1%(+5.31)#94 | 5.1%(+4.37)#3,700 |
| 95. | Hartford City | 9.4% | 4.1%(+5.27)#95 | 5.1%(+4.33)#3,730 |
| 96. | Lake Holiday | 9.3% | 4.1%(+5.16)#96 | 5.1%(+4.22)#3,817 |
| 97. | Brazil | 9.1% | 4.1%(+5.03)#97 | 5.1%(+4.09)#3,896 |
| 98. | Gas City | 9.1% | 4.1%(+5.00)#98 | 5.1%(+4.06)#3,911 |
| 99. | Lynn | 9.1% | 4.1%(+4.98)#99 | 5.1%(+4.04)#3,932 |
| 100. | French Lick | 9.0% | 4.1%(+4.91)#100 | 5.1%(+3.98)#4,009 |
Common Questions
What are the Top 10 Cities with the Highest Percentage of Population with a Degree in Psychology in Indiana?
Top 10 Cities with the Highest Percentage of Population with a Degree in Psychology in Indiana are:
What city has the Highest Percentage of Population with a Degree in Psychology in Indiana?
Kimmell has the Highest Percentage of Population with a Degree in Psychology in Indiana with 100.0%.
What is the Percentage of Population with a Degree in Psychology in the State of Indiana?
Percentage of Population with a Degree in Psychology in Indiana is 4.1%.
What is the Percentage of Population with a Degree in Psychology in the United States?
Percentage of Population with a Degree in Psychology in the United States is 5.1%.