Cities with the Highest Percentage of Population with a Degree in Psychology in West Virginia
RELATED REPORTS & OPTIONS
Psychology
West Virginia
Compare Cities
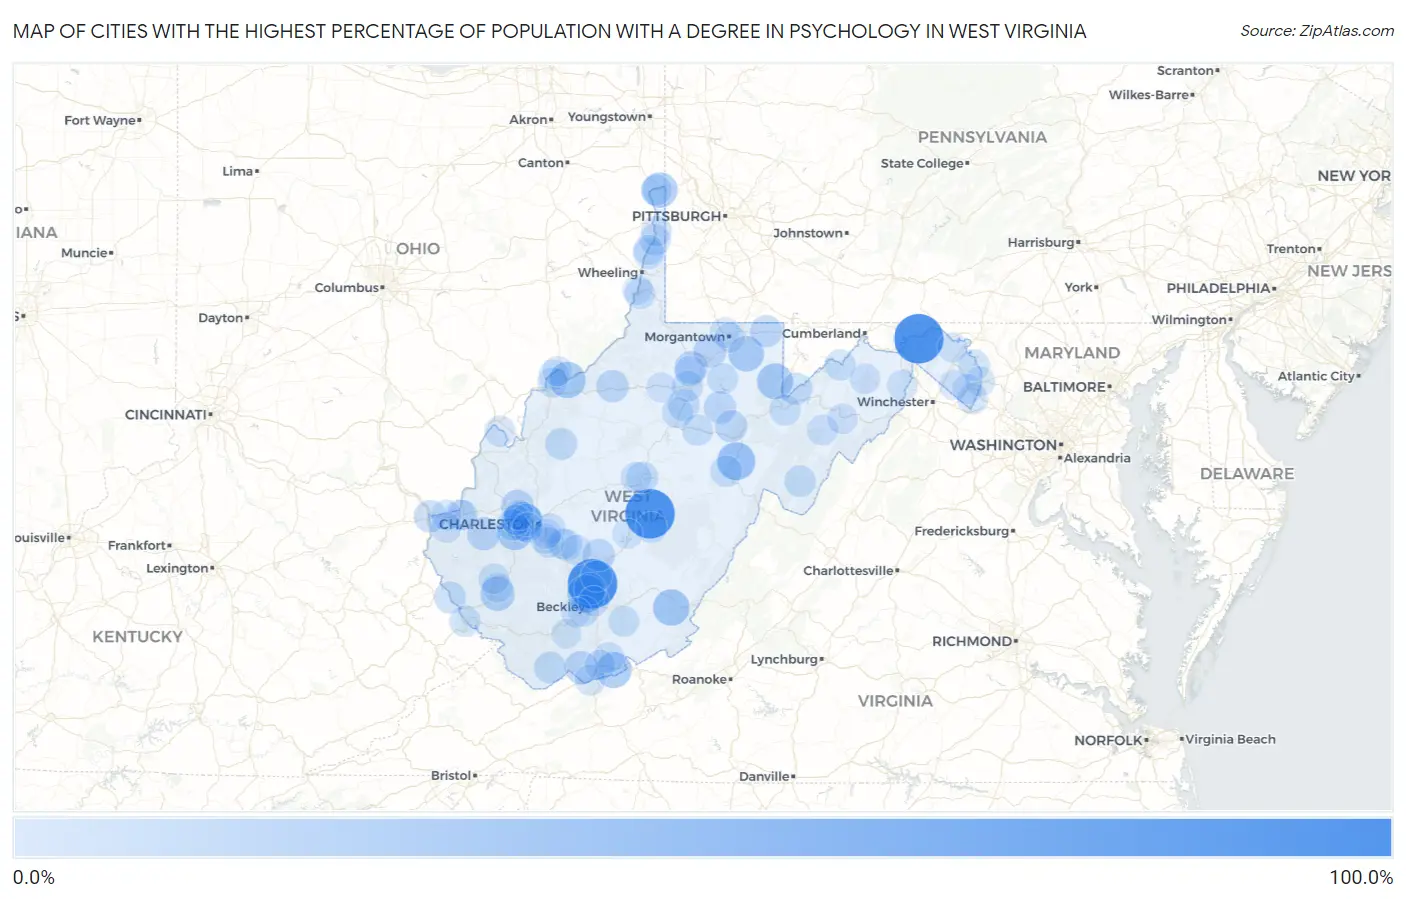
Map of Cities with the Highest Percentage of Population with a Degree in Psychology in West Virginia
0.0%
100.0%
Cities with the Highest Percentage of Population with a Degree in Psychology in West Virginia
| City | % Graduates | vs State | vs National | |
| 1. | Great Cacapon | 100.0% | 5.4%(+94.6)#1 | 5.1%(+94.9)#3 |
| 2. | Hilltop | 100.0% | 5.4%(+94.6)#2 | 5.1%(+94.9)#7 |
| 3. | Tioga | 100.0% | 5.4%(+94.6)#3 | 5.1%(+94.9)#9 |
| 4. | Adrian | 50.0% | 5.4%(+44.6)#4 | 5.1%(+44.9)#190 |
| 5. | Jefferson | 47.6% | 5.4%(+42.3)#5 | 5.1%(+42.6)#221 |
| 6. | East Dailey | 43.1% | 5.4%(+37.7)#6 | 5.1%(+38.0)#264 |
| 7. | Bradley | 41.9% | 5.4%(+36.5)#7 | 5.1%(+36.9)#278 |
| 8. | Fairlea | 35.4% | 5.4%(+30.1)#8 | 5.1%(+30.4)#378 |
| 9. | Waverly | 35.1% | 5.4%(+29.7)#9 | 5.1%(+30.0)#386 |
| 10. | Aurora | 33.3% | 5.4%(+28.0)#10 | 5.1%(+28.3)#415 |
| 11. | Oakvale | 33.3% | 5.4%(+28.0)#11 | 5.1%(+28.3)#419 |
| 12. | Reedsville | 32.1% | 5.4%(+26.8)#12 | 5.1%(+27.1)#449 |
| 13. | Alum Creek | 30.7% | 5.4%(+25.3)#13 | 5.1%(+25.6)#481 |
| 14. | Chester | 29.4% | 5.4%(+24.0)#14 | 5.1%(+24.3)#510 |
| 15. | West Logan | 25.9% | 5.4%(+20.6)#15 | 5.1%(+20.9)#648 |
| 16. | Montcalm | 21.1% | 5.4%(+15.7)#16 | 5.1%(+16.0)#951 |
| 17. | Hamlin | 20.1% | 5.4%(+14.8)#17 | 5.1%(+15.1)#1,022 |
| 18. | Poca | 19.8% | 5.4%(+14.4)#18 | 5.1%(+14.7)#1,079 |
| 19. | Enterprise | 19.5% | 5.4%(+14.1)#19 | 5.1%(+14.5)#1,099 |
| 20. | Rivesville | 18.9% | 5.4%(+13.5)#20 | 5.1%(+13.8)#1,166 |
| 21. | Ansted | 17.6% | 5.4%(+12.2)#21 | 5.1%(+12.5)#1,319 |
| 22. | Philippi | 17.2% | 5.4%(+11.8)#22 | 5.1%(+12.1)#1,359 |
| 23. | Pennsboro | 16.7% | 5.4%(+11.3)#23 | 5.1%(+11.6)#1,396 |
| 24. | Kenova | 16.1% | 5.4%(+10.8)#24 | 5.1%(+11.1)#1,506 |
| 25. | Dunbar | 16.1% | 5.4%(+10.7)#25 | 5.1%(+11.0)#1,517 |
| 26. | Belington | 15.8% | 5.4%(+10.4)#26 | 5.1%(+10.7)#1,569 |
| 27. | Booth | 15.4% | 5.4%(+10.0)#27 | 5.1%(+10.3)#1,627 |
| 28. | Brandonville | 15.1% | 5.4%(+9.73)#28 | 5.1%(+10.0)#1,679 |
| 29. | Gary | 14.8% | 5.4%(+9.45)#29 | 5.1%(+9.76)#1,716 |
| 30. | Kanawha | 14.8% | 5.4%(+9.45)#30 | 5.1%(+9.76)#1,722 |
| 31. | Bayard | 14.8% | 5.4%(+9.45)#31 | 5.1%(+9.76)#1,723 |
| 32. | Kermit | 14.3% | 5.4%(+8.92)#32 | 5.1%(+9.23)#1,843 |
| 33. | Reedy | 14.3% | 5.4%(+8.92)#33 | 5.1%(+9.23)#1,845 |
| 34. | Mount Hope | 14.1% | 5.4%(+8.72)#34 | 5.1%(+9.03)#1,882 |
| 35. | Lost Creek | 14.1% | 5.4%(+8.70)#35 | 5.1%(+9.01)#1,890 |
| 36. | Hinkleville | 13.7% | 5.4%(+8.36)#36 | 5.1%(+8.67)#1,969 |
| 37. | Sutton | 13.0% | 5.4%(+7.64)#37 | 5.1%(+7.96)#2,136 |
| 38. | Pratt | 12.8% | 5.4%(+7.40)#38 | 5.1%(+7.71)#2,191 |
| 39. | Franklin | 12.6% | 5.4%(+7.23)#39 | 5.1%(+7.55)#2,236 |
| 40. | Huttonsville | 12.5% | 5.4%(+7.13)#40 | 5.1%(+7.45)#2,285 |
| 41. | Tornado | 12.0% | 5.4%(+6.59)#41 | 5.1%(+6.91)#2,470 |
| 42. | Shepherdstown | 11.8% | 5.4%(+6.44)#42 | 5.1%(+6.75)#2,528 |
| 43. | Williamson | 11.3% | 5.4%(+5.98)#43 | 5.1%(+6.30)#2,706 |
| 44. | Craigsville | 11.3% | 5.4%(+5.94)#44 | 5.1%(+6.25)#2,723 |
| 45. | Davis | 11.3% | 5.4%(+5.91)#45 | 5.1%(+6.23)#2,729 |
| 46. | Clarksburg | 11.2% | 5.4%(+5.87)#46 | 5.1%(+6.18)#2,743 |
| 47. | Jane Lew | 11.1% | 5.4%(+5.75)#47 | 5.1%(+6.06)#2,786 |
| 48. | Windsor Heights | 11.1% | 5.4%(+5.75)#48 | 5.1%(+6.06)#2,787 |
| 49. | Wellsburg | 10.9% | 5.4%(+5.53)#49 | 5.1%(+5.85)#2,889 |
| 50. | Grafton | 10.8% | 5.4%(+5.43)#50 | 5.1%(+5.74)#2,936 |
| 51. | Keyser | 10.8% | 5.4%(+5.40)#51 | 5.1%(+5.72)#2,945 |
| 52. | Buckhannon | 10.7% | 5.4%(+5.34)#52 | 5.1%(+5.65)#2,975 |
| 53. | Oak Hill | 10.7% | 5.4%(+5.31)#53 | 5.1%(+5.62)#2,984 |
| 54. | Newell | 10.5% | 5.4%(+5.09)#54 | 5.1%(+5.41)#3,108 |
| 55. | Hinton | 10.4% | 5.4%(+5.00)#55 | 5.1%(+5.32)#3,154 |
| 56. | Shinnston | 10.3% | 5.4%(+4.94)#56 | 5.1%(+5.25)#3,195 |
| 57. | Glasgow | 10.3% | 5.4%(+4.89)#57 | 5.1%(+5.21)#3,212 |
| 58. | New Haven | 10.2% | 5.4%(+4.85)#58 | 5.1%(+5.16)#3,242 |
| 59. | Pea Ridge | 10.0% | 5.4%(+4.65)#59 | 5.1%(+4.96)#3,345 |
| 60. | Bluefield | 9.9% | 5.4%(+4.58)#60 | 5.1%(+4.89)#3,422 |
| 61. | Gassaway | 9.9% | 5.4%(+4.56)#61 | 5.1%(+4.87)#3,428 |
| 62. | Petersburg | 9.8% | 5.4%(+4.41)#62 | 5.1%(+4.73)#3,505 |
| 63. | Shannondale | 9.7% | 5.4%(+4.34)#63 | 5.1%(+4.66)#3,533 |
| 64. | Coal Fork | 9.7% | 5.4%(+4.31)#64 | 5.1%(+4.63)#3,545 |
| 65. | Athens | 9.3% | 5.4%(+3.98)#65 | 5.1%(+4.29)#3,763 |
| 66. | Moundsville | 9.2% | 5.4%(+3.82)#66 | 5.1%(+4.13)#3,873 |
| 67. | Chesapeake | 9.1% | 5.4%(+3.72)#67 | 5.1%(+4.04)#3,926 |
| 68. | Crab Orchard | 9.0% | 5.4%(+3.66)#68 | 5.1%(+3.97)#4,015 |
| 69. | Chapmanville | 9.0% | 5.4%(+3.62)#69 | 5.1%(+3.94)#4,035 |
| 70. | Princeton | 9.0% | 5.4%(+3.60)#70 | 5.1%(+3.91)#4,056 |
| 71. | Boaz | 8.6% | 5.4%(+3.22)#71 | 5.1%(+3.53)#4,346 |
| 72. | Follansbee | 8.5% | 5.4%(+3.10)#72 | 5.1%(+3.41)#4,434 |
| 73. | Barboursville | 8.4% | 5.4%(+3.03)#73 | 5.1%(+3.34)#4,497 |
| 74. | Capon Bridge | 8.3% | 5.4%(+2.97)#74 | 5.1%(+3.28)#4,562 |
| 75. | Smithers | 8.1% | 5.4%(+2.75)#75 | 5.1%(+3.07)#4,747 |
| 76. | Stanaford | 8.1% | 5.4%(+2.75)#76 | 5.1%(+3.07)#4,748 |
| 77. | Moorefield | 7.8% | 5.4%(+2.46)#77 | 5.1%(+2.77)#5,042 |
| 78. | Beech Bottom | 7.7% | 5.4%(+2.33)#78 | 5.1%(+2.64)#5,176 |
| 79. | Huntington | 7.7% | 5.4%(+2.28)#79 | 5.1%(+2.60)#5,237 |
| 80. | St Albans | 7.6% | 5.4%(+2.24)#80 | 5.1%(+2.55)#5,277 |
| 81. | Romney | 7.6% | 5.4%(+2.24)#81 | 5.1%(+2.55)#5,278 |
| 82. | Lavalette | 7.3% | 5.4%(+1.92)#82 | 5.1%(+2.24)#5,651 |
| 83. | Marmet | 7.2% | 5.4%(+1.85)#83 | 5.1%(+2.16)#5,731 |
| 84. | Mitchell Heights | 7.1% | 5.4%(+1.78)#84 | 5.1%(+2.09)#5,840 |
| 85. | Star City | 7.0% | 5.4%(+1.66)#85 | 5.1%(+1.98)#6,000 |
| 86. | Middleway | 6.9% | 5.4%(+1.53)#86 | 5.1%(+1.85)#6,182 |
| 87. | Hedgesville | 6.9% | 5.4%(+1.53)#87 | 5.1%(+1.85)#6,186 |
| 88. | Nitro | 6.8% | 5.4%(+1.47)#88 | 5.1%(+1.78)#6,270 |
| 89. | North Hills | 6.8% | 5.4%(+1.46)#89 | 5.1%(+1.77)#6,287 |
| 90. | Bolivar | 6.8% | 5.4%(+1.40)#90 | 5.1%(+1.72)#6,369 |
| 91. | Charles Town | 6.7% | 5.4%(+1.37)#91 | 5.1%(+1.68)#6,421 |
| 92. | South Charleston | 6.7% | 5.4%(+1.36)#92 | 5.1%(+1.67)#6,429 |
| 93. | Morgantown | 6.7% | 5.4%(+1.33)#93 | 5.1%(+1.64)#6,464 |
| 94. | Lester | 6.7% | 5.4%(+1.30)#94 | 5.1%(+1.62)#6,526 |
| 95. | Mullens | 6.6% | 5.4%(+1.23)#95 | 5.1%(+1.54)#6,632 |
| 96. | Glen Dale | 6.6% | 5.4%(+1.18)#96 | 5.1%(+1.50)#6,708 |
| 97. | Williamstown | 6.5% | 5.4%(+1.15)#97 | 5.1%(+1.46)#6,776 |
| 98. | Salem | 6.5% | 5.4%(+1.12)#98 | 5.1%(+1.44)#6,818 |
| 99. | Summersville | 6.5% | 5.4%(+1.09)#99 | 5.1%(+1.40)#6,876 |
| 100. | Rand | 6.5% | 5.4%(+1.09)#100 | 5.1%(+1.40)#6,884 |
Common Questions
What are the Top 10 Cities with the Highest Percentage of Population with a Degree in Psychology in West Virginia?
Top 10 Cities with the Highest Percentage of Population with a Degree in Psychology in West Virginia are:
#1
100.0%
#2
100.0%
#3
100.0%
#4
47.6%
#5
43.1%
#6
41.9%
#7
35.4%
#8
35.1%
#9
33.3%
#10
33.3%
What city has the Highest Percentage of Population with a Degree in Psychology in West Virginia?
Great Cacapon has the Highest Percentage of Population with a Degree in Psychology in West Virginia with 100.0%.
What is the Percentage of Population with a Degree in Psychology in the State of West Virginia?
Percentage of Population with a Degree in Psychology in West Virginia is 5.4%.
What is the Percentage of Population with a Degree in Psychology in the United States?
Percentage of Population with a Degree in Psychology in the United States is 5.1%.