Cities with the Highest Percentage of Population with a Degree in Psychology in Virginia
RELATED REPORTS & OPTIONS
Psychology
Virginia
Compare Cities
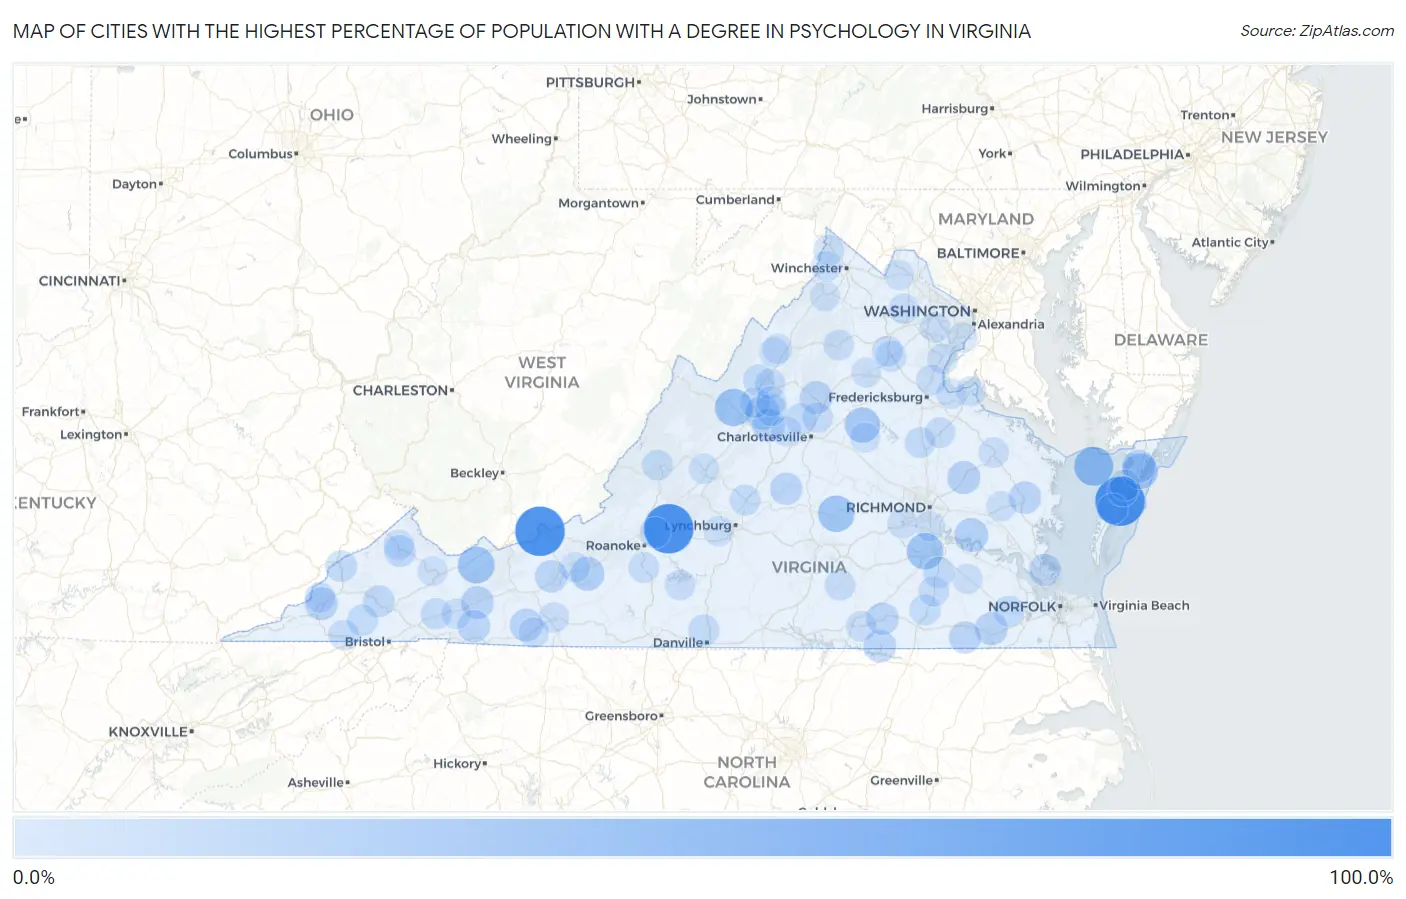
Map of Cities with the Highest Percentage of Population with a Degree in Psychology in Virginia
0.0%
100.0%
Cities with the Highest Percentage of Population with a Degree in Psychology in Virginia
| City | % Graduates | vs State | vs National | |
| 1. | Montvale | 100.0% | 5.3%(+94.7)#1 | 5.1%(+94.9)#11 |
| 2. | Glen Lyn | 100.0% | 5.3%(+94.7)#2 | 5.1%(+94.9)#38 |
| 3. | Mappsburg | 100.0% | 5.3%(+94.7)#3 | 5.1%(+94.9)#49 |
| 4. | Pounding Mill | 52.0% | 5.3%(+46.7)#4 | 5.1%(+46.9)#150 |
| 5. | Tangier | 50.0% | 5.3%(+44.7)#5 | 5.1%(+44.9)#166 |
| 6. | Afton | 50.0% | 5.3%(+44.7)#6 | 5.1%(+44.9)#169 |
| 7. | Churchville | 41.9% | 5.3%(+36.7)#7 | 5.1%(+36.9)#277 |
| 8. | Gratton | 39.2% | 5.3%(+33.9)#8 | 5.1%(+34.2)#321 |
| 9. | Matoaca | 37.7% | 5.3%(+32.4)#9 | 5.1%(+32.6)#339 |
| 10. | The University Of Virginia's College At Wise | 37.0% | 5.3%(+31.8)#10 | 5.1%(+32.0)#353 |
| 11. | Cumberland | 36.8% | 5.3%(+31.6)#11 | 5.1%(+31.8)#356 |
| 12. | Gargatha | 33.5% | 5.3%(+28.2)#12 | 5.1%(+28.5)#402 |
| 13. | Blue Ridge Shores | 32.4% | 5.3%(+27.2)#13 | 5.1%(+27.4)#445 |
| 14. | New Hope | 28.4% | 5.3%(+23.1)#14 | 5.1%(+23.3)#551 |
| 15. | Riner | 25.7% | 5.3%(+20.4)#15 | 5.1%(+20.6)#660 |
| 16. | Charles City | 25.0% | 5.3%(+19.7)#16 | 5.1%(+19.9)#723 |
| 17. | Central Garage | 22.1% | 5.3%(+16.8)#17 | 5.1%(+17.0)#878 |
| 18. | Big Stone Gap | 21.8% | 5.3%(+16.5)#18 | 5.1%(+16.8)#894 |
| 19. | Camptown | 21.4% | 5.3%(+16.2)#19 | 5.1%(+16.4)#920 |
| 20. | Nelsonia | 21.2% | 5.3%(+15.9)#20 | 5.1%(+16.2)#943 |
| 21. | Fries | 20.8% | 5.3%(+15.6)#21 | 5.1%(+15.8)#975 |
| 22. | Atkins | 20.8% | 5.3%(+15.5)#22 | 5.1%(+15.7)#979 |
| 23. | Dooms | 20.4% | 5.3%(+15.1)#23 | 5.1%(+15.3)#1,007 |
| 24. | Stanardsville | 20.2% | 5.3%(+14.9)#24 | 5.1%(+15.1)#1,020 |
| 25. | Pulaski | 19.6% | 5.3%(+14.4)#25 | 5.1%(+14.6)#1,089 |
| 26. | Saluda | 19.1% | 5.3%(+13.8)#26 | 5.1%(+14.0)#1,141 |
| 27. | Troutdale | 19.0% | 5.3%(+13.8)#27 | 5.1%(+14.0)#1,151 |
| 28. | Gasburg | 18.7% | 5.3%(+13.4)#28 | 5.1%(+13.6)#1,181 |
| 29. | Yogaville | 18.7% | 5.3%(+13.4)#29 | 5.1%(+13.6)#1,184 |
| 30. | Lawrenceville | 18.6% | 5.3%(+13.3)#30 | 5.1%(+13.5)#1,195 |
| 31. | Newsoms | 18.0% | 5.3%(+12.8)#31 | 5.1%(+13.0)#1,260 |
| 32. | Bethel Manor | 17.9% | 5.3%(+12.7)#32 | 5.1%(+12.9)#1,271 |
| 33. | Harriston | 16.7% | 5.3%(+11.4)#33 | 5.1%(+11.6)#1,399 |
| 34. | Castlewood | 16.1% | 5.3%(+10.8)#34 | 5.1%(+11.1)#1,511 |
| 35. | Vansant | 16.0% | 5.3%(+10.7)#35 | 5.1%(+10.9)#1,531 |
| 36. | Pound | 15.3% | 5.3%(+9.98)#36 | 5.1%(+10.2)#1,657 |
| 37. | Great Falls Crossing | 14.9% | 5.3%(+9.62)#37 | 5.1%(+9.85)#1,704 |
| 38. | Templeton | 14.3% | 5.3%(+9.01)#38 | 5.1%(+9.23)#1,853 |
| 39. | Dayton | 14.0% | 5.3%(+8.74)#39 | 5.1%(+8.97)#1,900 |
| 40. | Glade Spring | 13.9% | 5.3%(+8.66)#40 | 5.1%(+8.89)#1,921 |
| 41. | Free Union | 13.7% | 5.3%(+8.45)#41 | 5.1%(+8.67)#1,970 |
| 42. | Jarratt | 13.5% | 5.3%(+8.24)#42 | 5.1%(+8.46)#2,001 |
| 43. | Mount Hermon | 13.5% | 5.3%(+8.18)#43 | 5.1%(+8.40)#2,016 |
| 44. | Lake Caroline | 12.9% | 5.3%(+7.63)#44 | 5.1%(+7.86)#2,151 |
| 45. | Nickelsville | 12.9% | 5.3%(+7.63)#45 | 5.1%(+7.85)#2,159 |
| 46. | Amherst | 12.8% | 5.3%(+7.48)#46 | 5.1%(+7.71)#2,194 |
| 47. | Laymantown | 12.6% | 5.3%(+7.32)#47 | 5.1%(+7.55)#2,235 |
| 48. | Windsor | 12.5% | 5.3%(+7.26)#48 | 5.1%(+7.49)#2,247 |
| 49. | Onley | 12.1% | 5.3%(+6.87)#49 | 5.1%(+7.10)#2,395 |
| 50. | Mount Sidney | 12.0% | 5.3%(+6.76)#50 | 5.1%(+6.99)#2,431 |
| 51. | Boones Mill | 11.9% | 5.3%(+6.59)#51 | 5.1%(+6.81)#2,506 |
| 52. | Bealeton | 11.9% | 5.3%(+6.58)#52 | 5.1%(+6.81)#2,508 |
| 53. | Clifton Forge | 11.6% | 5.3%(+6.27)#53 | 5.1%(+6.50)#2,618 |
| 54. | Bowling Green | 11.5% | 5.3%(+6.21)#54 | 5.1%(+6.44)#2,649 |
| 55. | Gate City | 11.4% | 5.3%(+6.16)#55 | 5.1%(+6.38)#2,669 |
| 56. | Opal | 11.3% | 5.3%(+6.05)#56 | 5.1%(+6.28)#2,712 |
| 57. | Victoria | 11.3% | 5.3%(+5.99)#57 | 5.1%(+6.22)#2,731 |
| 58. | Stony Creek | 11.1% | 5.3%(+5.83)#58 | 5.1%(+6.06)#2,799 |
| 59. | Piney Mountain | 11.0% | 5.3%(+5.73)#59 | 5.1%(+5.96)#2,844 |
| 60. | Massanetta Springs | 11.0% | 5.3%(+5.73)#60 | 5.1%(+5.95)#2,847 |
| 61. | Bull Run Mountain Estates | 10.9% | 5.3%(+5.60)#61 | 5.1%(+5.82)#2,899 |
| 62. | Sperryville | 10.7% | 5.3%(+5.44)#62 | 5.1%(+5.66)#2,973 |
| 63. | Clifton | 10.7% | 5.3%(+5.38)#63 | 5.1%(+5.61)#2,990 |
| 64. | Grundy | 10.6% | 5.3%(+5.35)#64 | 5.1%(+5.58)#3,006 |
| 65. | Brodnax | 10.5% | 5.3%(+5.25)#65 | 5.1%(+5.48)#3,066 |
| 66. | Midlothian | 10.5% | 5.3%(+5.23)#66 | 5.1%(+5.46)#3,081 |
| 67. | Hillsville | 10.5% | 5.3%(+5.19)#67 | 5.1%(+5.41)#3,101 |
| 68. | Penhook | 10.4% | 5.3%(+5.14)#68 | 5.1%(+5.37)#3,124 |
| 69. | Moorefield | 10.4% | 5.3%(+5.10)#69 | 5.1%(+5.33)#3,147 |
| 70. | Lake Holiday | 10.4% | 5.3%(+5.10)#70 | 5.1%(+5.33)#3,150 |
| 71. | Dumfries | 10.3% | 5.3%(+5.07)#71 | 5.1%(+5.29)#3,164 |
| 72. | Exmore | 10.3% | 5.3%(+5.07)#72 | 5.1%(+5.29)#3,165 |
| 73. | Sully Square | 10.2% | 5.3%(+4.90)#73 | 5.1%(+5.13)#3,265 |
| 74. | Stafford Courthouse | 10.0% | 5.3%(+4.74)#74 | 5.1%(+4.97)#3,344 |
| 75. | Appalachia | 10.0% | 5.3%(+4.72)#75 | 5.1%(+4.95)#3,351 |
| 76. | Tappahannock | 9.9% | 5.3%(+4.63)#76 | 5.1%(+4.86)#3,432 |
| 77. | East Lexington | 9.7% | 5.3%(+4.41)#77 | 5.1%(+4.64)#3,539 |
| 78. | Shawneeland | 9.6% | 5.3%(+4.27)#78 | 5.1%(+4.50)#3,620 |
| 79. | Fairview Beach | 9.5% | 5.3%(+4.25)#79 | 5.1%(+4.47)#3,644 |
| 80. | Big Stone Gap East | 9.4% | 5.3%(+4.13)#80 | 5.1%(+4.36)#3,708 |
| 81. | Galax | 9.4% | 5.3%(+4.13)#81 | 5.1%(+4.35)#3,712 |
| 82. | Broadway | 9.4% | 5.3%(+4.09)#82 | 5.1%(+4.31)#3,742 |
| 83. | Forest | 9.4% | 5.3%(+4.09)#83 | 5.1%(+4.31)#3,744 |
| 84. | Grottoes | 9.4% | 5.3%(+4.08)#84 | 5.1%(+4.31)#3,748 |
| 85. | Woodlake | 9.3% | 5.3%(+4.00)#85 | 5.1%(+4.22)#3,811 |
| 86. | Dahlgren | 9.2% | 5.3%(+3.95)#86 | 5.1%(+4.17)#3,846 |
| 87. | Adwolf | 9.2% | 5.3%(+3.94)#87 | 5.1%(+4.17)#3,852 |
| 88. | West Point | 9.2% | 5.3%(+3.93)#88 | 5.1%(+4.15)#3,857 |
| 89. | Strasburg | 9.1% | 5.3%(+3.85)#89 | 5.1%(+4.07)#3,907 |
| 90. | Fort Belvoir | 9.1% | 5.3%(+3.84)#90 | 5.1%(+4.06)#3,908 |
| 91. | Culpeper | 9.1% | 5.3%(+3.83)#91 | 5.1%(+4.05)#3,916 |
| 92. | Louisa | 9.1% | 5.3%(+3.81)#92 | 5.1%(+4.04)#3,923 |
| 93. | Purcellville | 9.0% | 5.3%(+3.74)#93 | 5.1%(+3.97)#4,016 |
| 94. | Richlands | 9.0% | 5.3%(+3.70)#94 | 5.1%(+3.93)#4,037 |
| 95. | Melfa | 9.0% | 5.3%(+3.70)#95 | 5.1%(+3.92)#4,046 |
| 96. | Crozet | 8.8% | 5.3%(+3.57)#96 | 5.1%(+3.79)#4,131 |
| 97. | Radford | 8.8% | 5.3%(+3.53)#97 | 5.1%(+3.76)#4,166 |
| 98. | Waverly | 8.7% | 5.3%(+3.40)#98 | 5.1%(+3.63)#4,277 |
| 99. | Timberville | 8.7% | 5.3%(+3.40)#99 | 5.1%(+3.62)#4,285 |
| 100. | Bellwood | 8.6% | 5.3%(+3.34)#100 | 5.1%(+3.57)#4,324 |
Common Questions
What are the Top 10 Cities with the Highest Percentage of Population with a Degree in Psychology in Virginia?
Top 10 Cities with the Highest Percentage of Population with a Degree in Psychology in Virginia are:
#1
100.0%
#2
100.0%
#3
100.0%
#4
50.0%
#5
41.9%
#6
39.2%
#7
37.7%
#8
36.8%
#9
33.5%
#10
32.4%
What city has the Highest Percentage of Population with a Degree in Psychology in Virginia?
Montvale has the Highest Percentage of Population with a Degree in Psychology in Virginia with 100.0%.
What is the Percentage of Population with a Degree in Psychology in the State of Virginia?
Percentage of Population with a Degree in Psychology in Virginia is 5.3%.
What is the Percentage of Population with a Degree in Psychology in the United States?
Percentage of Population with a Degree in Psychology in the United States is 5.1%.