Cities with the Highest Percentage of Population with a Degree in Psychology in Michigan
RELATED REPORTS & OPTIONS
Psychology
Michigan
Compare Cities
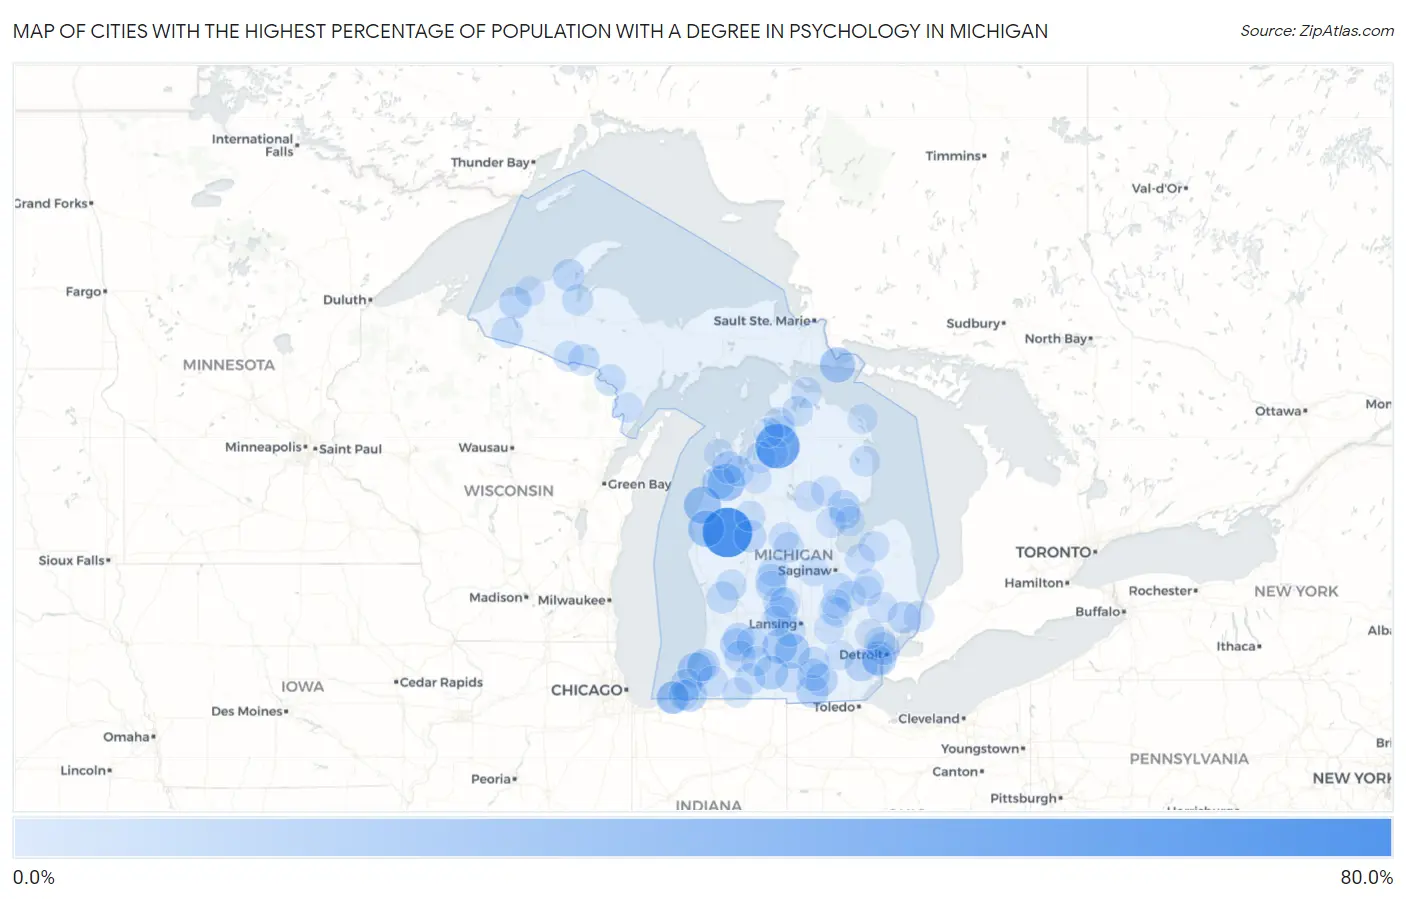
Map of Cities with the Highest Percentage of Population with a Degree in Psychology in Michigan
0.0%
80.0%
Cities with the Highest Percentage of Population with a Degree in Psychology in Michigan
| City | % Graduates | vs State | vs National | |
| 1. | Baldwin | 73.3% | 4.5%(+68.8)#1 | 5.1%(+68.2)#67 |
| 2. | Alba | 55.0% | 4.5%(+50.5)#2 | 5.1%(+49.9)#137 |
| 3. | Nessen City | 31.2% | 4.5%(+26.8)#3 | 5.1%(+26.2)#468 |
| 4. | Eastlake | 31.1% | 4.5%(+26.6)#4 | 5.1%(+26.1)#471 |
| 5. | Custer | 28.6% | 4.5%(+24.1)#5 | 5.1%(+23.5)#531 |
| 6. | Lakeport | 26.5% | 4.5%(+22.0)#6 | 5.1%(+21.5)#619 |
| 7. | De Tour Village | 25.0% | 4.5%(+20.5)#7 | 5.1%(+19.9)#692 |
| 8. | Melvindale | 23.8% | 4.5%(+19.3)#8 | 5.1%(+18.8)#768 |
| 9. | Springport | 23.8% | 4.5%(+19.3)#9 | 5.1%(+18.8)#769 |
| 10. | Olivet | 23.6% | 4.5%(+19.1)#10 | 5.1%(+18.6)#783 |
| 11. | Benton Heights | 22.9% | 4.5%(+18.4)#11 | 5.1%(+17.8)#819 |
| 12. | Lake Gogebic | 22.2% | 4.5%(+17.7)#12 | 5.1%(+17.2)#869 |
| 13. | Burlington | 20.0% | 4.5%(+15.5)#13 | 5.1%(+14.9)#1,048 |
| 14. | Crystal Mountain | 19.2% | 4.5%(+14.8)#14 | 5.1%(+14.2)#1,131 |
| 15. | Galien | 19.1% | 4.5%(+14.7)#15 | 5.1%(+14.1)#1,135 |
| 16. | Onsted | 16.8% | 4.5%(+12.3)#16 | 5.1%(+11.7)#1,390 |
| 17. | Belleville | 16.5% | 4.5%(+12.1)#17 | 5.1%(+11.5)#1,458 |
| 18. | Otsego | 16.5% | 4.5%(+12.0)#18 | 5.1%(+11.5)#1,461 |
| 19. | Hardwood Acres | 16.5% | 4.5%(+12.0)#19 | 5.1%(+11.4)#1,462 |
| 20. | Hudson | 16.4% | 4.5%(+11.9)#20 | 5.1%(+11.4)#1,471 |
| 21. | Portland | 16.3% | 4.5%(+11.8)#21 | 5.1%(+11.3)#1,480 |
| 22. | Highland Park | 16.3% | 4.5%(+11.8)#22 | 5.1%(+11.3)#1,482 |
| 23. | Grand Marais | 16.3% | 4.5%(+11.8)#23 | 5.1%(+11.2)#1,489 |
| 24. | Grand Beach | 16.2% | 4.5%(+11.7)#24 | 5.1%(+11.1)#1,498 |
| 25. | Hersey | 15.6% | 4.5%(+11.2)#25 | 5.1%(+10.6)#1,585 |
| 26. | Watervliet | 15.4% | 4.5%(+10.9)#26 | 5.1%(+10.3)#1,617 |
| 27. | Cement City | 15.2% | 4.5%(+10.7)#27 | 5.1%(+10.1)#1,668 |
| 28. | Bridgman | 15.1% | 4.5%(+10.6)#28 | 5.1%(+10.0)#1,682 |
| 29. | South Range | 15.0% | 4.5%(+10.5)#29 | 5.1%(+9.95)#1,689 |
| 30. | White Pine | 15.0% | 4.5%(+10.5)#30 | 5.1%(+9.95)#1,691 |
| 31. | Michiana | 14.9% | 4.5%(+10.5)#31 | 5.1%(+9.89)#1,700 |
| 32. | Whittemore | 14.7% | 4.5%(+10.2)#32 | 5.1%(+9.65)#1,734 |
| 33. | Ida | 14.6% | 4.5%(+10.1)#33 | 5.1%(+9.53)#1,769 |
| 34. | Richmond | 14.6% | 4.5%(+10.1)#34 | 5.1%(+9.52)#1,775 |
| 35. | Coopersville | 14.1% | 4.5%(+9.64)#35 | 5.1%(+9.06)#1,876 |
| 36. | Martin | 13.9% | 4.5%(+9.42)#36 | 5.1%(+8.84)#1,924 |
| 37. | Delton | 13.5% | 4.5%(+8.99)#37 | 5.1%(+8.41)#2,015 |
| 38. | Stanton | 13.3% | 4.5%(+8.86)#38 | 5.1%(+8.28)#2,037 |
| 39. | Hermansville | 13.3% | 4.5%(+8.86)#39 | 5.1%(+8.28)#2,047 |
| 40. | Montrose | 13.0% | 4.5%(+8.54)#40 | 5.1%(+7.96)#2,135 |
| 41. | Westwood | 12.5% | 4.5%(+8.05)#41 | 5.1%(+7.47)#2,248 |
| 42. | Muir | 12.5% | 4.5%(+8.03)#42 | 5.1%(+7.45)#2,260 |
| 43. | Alpha | 12.5% | 4.5%(+8.03)#43 | 5.1%(+7.45)#2,283 |
| 44. | Norway | 12.3% | 4.5%(+7.85)#44 | 5.1%(+7.27)#2,335 |
| 45. | Boyne Falls | 12.2% | 4.5%(+7.72)#45 | 5.1%(+7.14)#2,380 |
| 46. | Potterville | 12.1% | 4.5%(+7.67)#46 | 5.1%(+7.09)#2,398 |
| 47. | Michigan Center | 12.1% | 4.5%(+7.61)#47 | 5.1%(+7.03)#2,421 |
| 48. | Marenisco | 12.0% | 4.5%(+7.53)#48 | 5.1%(+6.95)#2,457 |
| 49. | Rapid City | 11.8% | 4.5%(+7.37)#49 | 5.1%(+6.79)#2,514 |
| 50. | Baraga | 11.8% | 4.5%(+7.36)#50 | 5.1%(+6.78)#2,517 |
| 51. | Crystal | 11.7% | 4.5%(+7.23)#51 | 5.1%(+6.65)#2,571 |
| 52. | Mancelona | 11.5% | 4.5%(+7.07)#52 | 5.1%(+6.49)#2,625 |
| 53. | Mendon | 11.5% | 4.5%(+7.02)#53 | 5.1%(+6.44)#2,646 |
| 54. | Edmore | 11.2% | 4.5%(+6.71)#54 | 5.1%(+6.13)#2,760 |
| 55. | Turner | 11.1% | 4.5%(+6.64)#55 | 5.1%(+6.06)#2,827 |
| 56. | Dowagiac | 10.9% | 4.5%(+6.40)#56 | 5.1%(+5.82)#2,900 |
| 57. | Huntington Woods | 10.8% | 4.5%(+6.36)#57 | 5.1%(+5.78)#2,921 |
| 58. | Beecher | 10.8% | 4.5%(+6.33)#58 | 5.1%(+5.75)#2,934 |
| 59. | Walloon Lake | 10.8% | 4.5%(+6.30)#59 | 5.1%(+5.72)#2,949 |
| 60. | St Clair | 10.7% | 4.5%(+6.20)#60 | 5.1%(+5.62)#2,986 |
| 61. | Casnovia | 10.6% | 4.5%(+6.17)#61 | 5.1%(+5.59)#3,003 |
| 62. | Sheridan | 10.6% | 4.5%(+6.10)#62 | 5.1%(+5.53)#3,030 |
| 63. | Rosebush | 10.5% | 4.5%(+6.05)#63 | 5.1%(+5.48)#3,065 |
| 64. | Owendale | 10.5% | 4.5%(+6.05)#64 | 5.1%(+5.48)#3,070 |
| 65. | Cheboygan | 10.5% | 4.5%(+6.03)#65 | 5.1%(+5.46)#3,084 |
| 66. | St Helen | 10.4% | 4.5%(+5.92)#66 | 5.1%(+5.34)#3,140 |
| 67. | Three Oaks | 10.4% | 4.5%(+5.91)#67 | 5.1%(+5.33)#3,144 |
| 68. | Pewamo | 10.3% | 4.5%(+5.87)#68 | 5.1%(+5.29)#3,167 |
| 69. | Tustin | 10.3% | 4.5%(+5.87)#69 | 5.1%(+5.29)#3,178 |
| 70. | Lost Lake Woods | 10.1% | 4.5%(+5.59)#70 | 5.1%(+5.02)#3,320 |
| 71. | Indian River | 10.0% | 4.5%(+5.56)#71 | 5.1%(+4.98)#3,338 |
| 72. | Sunfield | 10.0% | 4.5%(+5.53)#72 | 5.1%(+4.95)#3,361 |
| 73. | Chums Corner | 9.9% | 4.5%(+5.41)#73 | 5.1%(+4.83)#3,443 |
| 74. | Iron River | 9.9% | 4.5%(+5.41)#74 | 5.1%(+4.83)#3,447 |
| 75. | Farwell | 9.4% | 4.5%(+4.94)#75 | 5.1%(+4.36)#3,707 |
| 76. | Rose City | 9.4% | 4.5%(+4.90)#76 | 5.1%(+4.32)#3,734 |
| 77. | Dryden | 9.3% | 4.5%(+4.85)#77 | 5.1%(+4.27)#3,778 |
| 78. | Sterling | 9.3% | 4.5%(+4.83)#78 | 5.1%(+4.25)#3,794 |
| 79. | Constantine | 9.3% | 4.5%(+4.81)#79 | 5.1%(+4.23)#3,808 |
| 80. | Climax | 9.2% | 4.5%(+4.77)#80 | 5.1%(+4.19)#3,833 |
| 81. | Akron | 9.1% | 4.5%(+4.62)#81 | 5.1%(+4.04)#3,956 |
| 82. | Litchfield | 8.9% | 4.5%(+4.43)#82 | 5.1%(+3.85)#4,095 |
| 83. | Merrill | 8.9% | 4.5%(+4.39)#83 | 5.1%(+3.81)#4,118 |
| 84. | Columbiaville | 8.8% | 4.5%(+4.32)#84 | 5.1%(+3.74)#4,180 |
| 85. | Fostoria | 8.6% | 4.5%(+4.17)#85 | 5.1%(+3.59)#4,303 |
| 86. | Fife Lake | 8.6% | 4.5%(+4.15)#86 | 5.1%(+3.57)#4,323 |
| 87. | Allen Park | 8.6% | 4.5%(+4.14)#87 | 5.1%(+3.56)#4,328 |
| 88. | Durand | 8.6% | 4.5%(+4.12)#88 | 5.1%(+3.55)#4,339 |
| 89. | Gaines | 8.6% | 4.5%(+4.10)#89 | 5.1%(+3.52)#4,356 |
| 90. | Au Gres | 8.5% | 4.5%(+4.07)#90 | 5.1%(+3.50)#4,376 |
| 91. | Glen Arbor | 8.5% | 4.5%(+3.99)#91 | 5.1%(+3.41)#4,433 |
| 92. | Keego Harbor | 8.5% | 4.5%(+3.98)#92 | 5.1%(+3.40)#4,443 |
| 93. | Ontonagon | 8.4% | 4.5%(+3.95)#93 | 5.1%(+3.38)#4,464 |
| 94. | Presque Isle Harbor | 8.4% | 4.5%(+3.94)#94 | 5.1%(+3.36)#4,473 |
| 95. | Dexter | 8.4% | 4.5%(+3.93)#95 | 5.1%(+3.35)#4,487 |
| 96. | Coloma | 8.4% | 4.5%(+3.91)#96 | 5.1%(+3.34)#4,502 |
| 97. | East Jordan | 8.4% | 4.5%(+3.90)#97 | 5.1%(+3.32)#4,513 |
| 98. | Daggett | 8.3% | 4.5%(+3.86)#98 | 5.1%(+3.28)#4,583 |
| 99. | Fowlerville | 8.3% | 4.5%(+3.80)#99 | 5.1%(+3.22)#4,642 |
| 100. | Lennon | 8.2% | 4.5%(+3.69)#100 | 5.1%(+3.11)#4,719 |
Common Questions
What are the Top 10 Cities with the Highest Percentage of Population with a Degree in Psychology in Michigan?
Top 10 Cities with the Highest Percentage of Population with a Degree in Psychology in Michigan are:
#1
73.3%
#2
55.0%
#3
31.2%
#4
31.1%
#5
28.6%
#6
25.0%
#7
23.8%
#8
23.8%
#9
23.6%
#10
22.9%
What city has the Highest Percentage of Population with a Degree in Psychology in Michigan?
Baldwin has the Highest Percentage of Population with a Degree in Psychology in Michigan with 73.3%.
What is the Percentage of Population with a Degree in Psychology in the State of Michigan?
Percentage of Population with a Degree in Psychology in Michigan is 4.5%.
What is the Percentage of Population with a Degree in Psychology in the United States?
Percentage of Population with a Degree in Psychology in the United States is 5.1%.