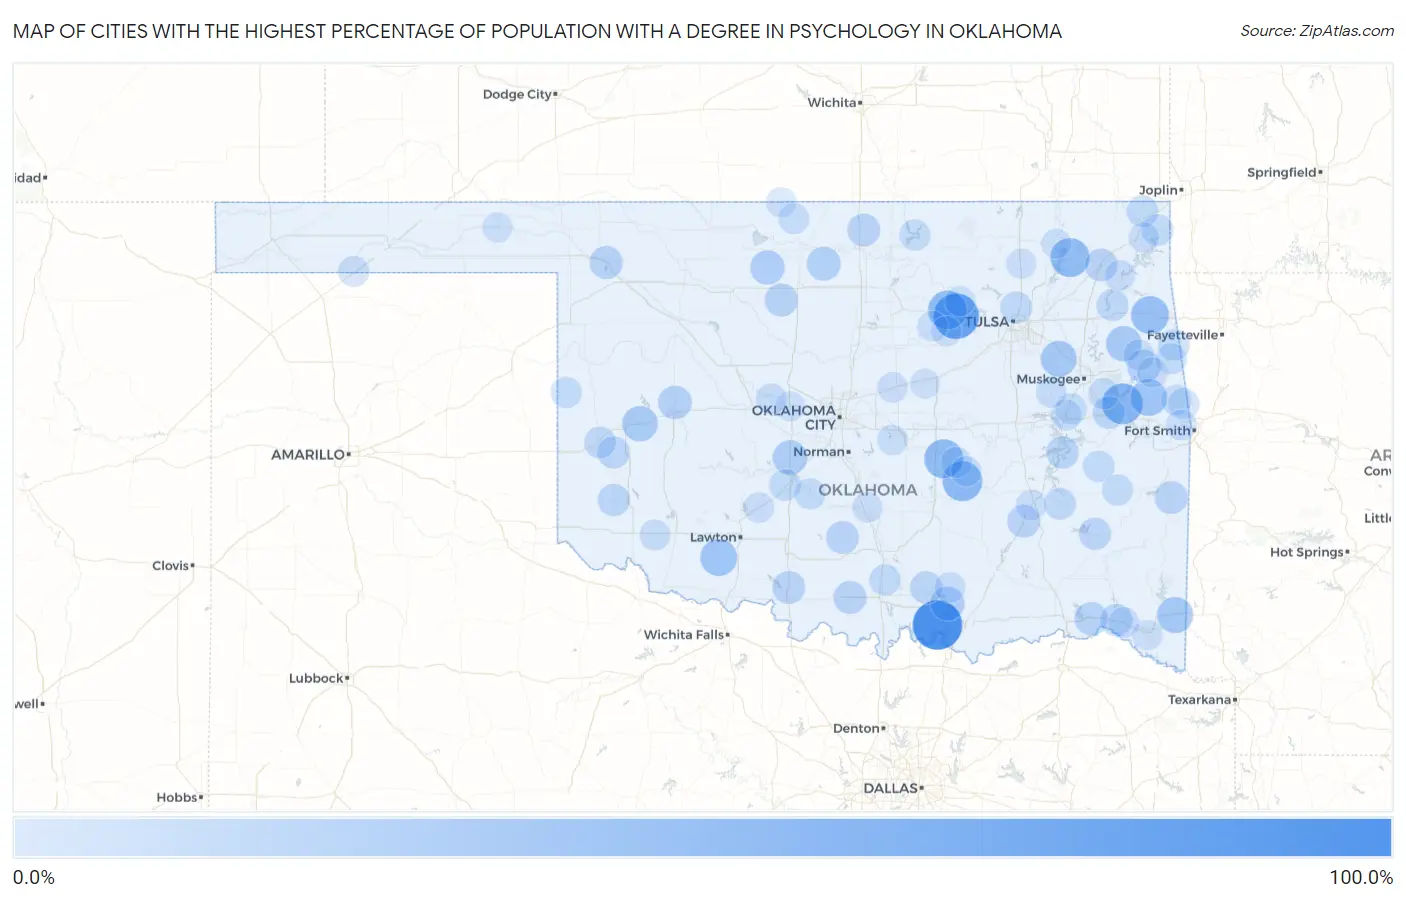
Cities with the Highest Percentage of Population with a Degree in Psychology in Oklahoma
RELATED REPORTS & OPTIONS
Psychology
Oklahoma
Compare Cities
Map of Cities with the Highest Percentage of Population with a Degree in Psychology in Oklahoma
0.0%
100.0%
Cities with the Highest Percentage of Population with a Degree in Psychology in Oklahoma
| City | % Graduates | vs State | vs National | |
| 1. | New Woodville | 100.0% | 4.5%(+95.5)#1 | 5.1%(+94.9)#48 |
| 2. | Terlton | 80.0% | 4.5%(+75.5)#2 | 5.1%(+74.9)#60 |
| 3. | Sunray | 67.3% | 4.5%(+62.8)#3 | 5.1%(+62.2)#81 |
| 4. | Redbird Smith | 58.6% | 4.5%(+54.1)#4 | 5.1%(+53.6)#124 |
| 5. | Spaulding | 53.8% | 4.5%(+49.4)#5 | 5.1%(+48.8)#144 |
| 6. | Hallett | 50.0% | 4.5%(+45.5)#6 | 5.1%(+44.9)#194 |
| 7. | Lima | 50.0% | 4.5%(+45.5)#7 | 5.1%(+44.9)#196 |
| 8. | New Alluwe | 50.0% | 4.5%(+45.5)#8 | 5.1%(+44.9)#197 |
| 9. | Peckham | 50.0% | 4.5%(+45.5)#9 | 5.1%(+44.9)#203 |
| 10. | Kansas | 44.8% | 4.5%(+40.4)#10 | 5.1%(+39.8)#244 |
| 11. | Flute Springs | 40.0% | 4.5%(+35.5)#11 | 5.1%(+34.9)#312 |
| 12. | Faxon | 40.0% | 4.5%(+35.5)#12 | 5.1%(+34.9)#314 |
| 13. | Eagletown | 36.4% | 4.5%(+31.9)#13 | 5.1%(+31.3)#363 |
| 14. | Moyers | 36.4% | 4.5%(+31.9)#14 | 5.1%(+31.3)#365 |
| 15. | Redbird | 35.7% | 4.5%(+31.2)#15 | 5.1%(+30.7)#376 |
| 16. | Pumpkin Hollow | 35.7% | 4.5%(+31.2)#16 | 5.1%(+30.7)#377 |
| 17. | Gideon | 33.9% | 4.5%(+29.4)#17 | 5.1%(+28.8)#400 |
| 18. | Canute | 33.3% | 4.5%(+28.9)#18 | 5.1%(+28.3)#408 |
| 19. | Earl | 33.3% | 4.5%(+28.9)#19 | 5.1%(+28.3)#431 |
| 20. | Cave Spring | 30.8% | 4.5%(+26.3)#20 | 5.1%(+25.7)#480 |
| 21. | Pocasset | 30.0% | 4.5%(+25.5)#21 | 5.1%(+24.9)#496 |
| 22. | Goltry | 28.6% | 4.5%(+24.1)#22 | 5.1%(+23.5)#534 |
| 23. | Bee | 27.8% | 4.5%(+23.3)#23 | 5.1%(+22.7)#572 |
| 24. | Hunter | 26.3% | 4.5%(+21.8)#24 | 5.1%(+21.3)#629 |
| 25. | Arapaho | 25.8% | 4.5%(+21.3)#25 | 5.1%(+20.8)#651 |
| 26. | Caney | 25.0% | 4.5%(+20.5)#26 | 5.1%(+19.9)#685 |
| 27. | Scipio | 25.0% | 4.5%(+20.5)#27 | 5.1%(+19.9)#722 |
| 28. | Fort Towson | 24.0% | 4.5%(+19.5)#28 | 5.1%(+18.9)#756 |
| 29. | Drummond | 23.3% | 4.5%(+18.9)#29 | 5.1%(+18.3)#794 |
| 30. | Fort Supply | 23.0% | 4.5%(+18.5)#30 | 5.1%(+17.9)#817 |
| 31. | Wilson | 22.8% | 4.5%(+18.3)#31 | 5.1%(+17.7)#823 |
| 32. | Heavener | 22.6% | 4.5%(+18.1)#32 | 5.1%(+17.5)#838 |
| 33. | Kiowa | 22.5% | 4.5%(+18.0)#33 | 5.1%(+17.4)#840 |
| 34. | Blackwell | 22.2% | 4.5%(+17.8)#34 | 5.1%(+17.2)#854 |
| 35. | Addington | 22.2% | 4.5%(+17.8)#35 | 5.1%(+17.2)#871 |
| 36. | Foster | 21.8% | 4.5%(+17.3)#36 | 5.1%(+16.8)#893 |
| 37. | Big Cabin | 21.4% | 4.5%(+17.0)#37 | 5.1%(+16.4)#926 |
| 38. | Ravia | 20.8% | 4.5%(+16.4)#38 | 5.1%(+15.8)#972 |
| 39. | Webbers Falls | 20.0% | 4.5%(+15.5)#39 | 5.1%(+14.9)#1,037 |
| 40. | Carlton Landing | 20.0% | 4.5%(+15.5)#40 | 5.1%(+14.9)#1,066 |
| 41. | Mangum | 19.4% | 4.5%(+15.0)#41 | 5.1%(+14.4)#1,104 |
| 42. | Valliant | 19.1% | 4.5%(+14.6)#42 | 5.1%(+14.0)#1,140 |
| 43. | Carter | 19.0% | 4.5%(+14.6)#43 | 5.1%(+14.0)#1,152 |
| 44. | Tuskahoma | 19.0% | 4.5%(+14.6)#44 | 5.1%(+14.0)#1,154 |
| 45. | Pump Back | 18.4% | 4.5%(+13.9)#45 | 5.1%(+13.3)#1,216 |
| 46. | Turley | 18.3% | 4.5%(+13.9)#46 | 5.1%(+13.3)#1,217 |
| 47. | Haileyville | 17.6% | 4.5%(+13.2)#47 | 5.1%(+12.6)#1,305 |
| 48. | Sayre | 17.5% | 4.5%(+13.1)#48 | 5.1%(+12.5)#1,320 |
| 49. | Commerce | 16.8% | 4.5%(+12.3)#49 | 5.1%(+11.7)#1,389 |
| 50. | Wyandotte | 16.7% | 4.5%(+12.2)#50 | 5.1%(+11.6)#1,414 |
| 51. | Norge | 16.7% | 4.5%(+12.2)#51 | 5.1%(+11.6)#1,435 |
| 52. | Kinta | 15.8% | 4.5%(+11.3)#52 | 5.1%(+10.7)#1,563 |
| 53. | Springer | 15.5% | 4.5%(+11.0)#53 | 5.1%(+10.4)#1,604 |
| 54. | Westville | 15.5% | 4.5%(+11.0)#54 | 5.1%(+10.4)#1,607 |
| 55. | Alex | 15.4% | 4.5%(+10.9)#55 | 5.1%(+10.3)#1,621 |
| 56. | Rentiesville | 15.4% | 4.5%(+10.9)#56 | 5.1%(+10.3)#1,637 |
| 57. | Bug Tussle | 14.9% | 4.5%(+10.4)#57 | 5.1%(+9.84)#1,710 |
| 58. | Red Oak | 14.6% | 4.5%(+10.2)#58 | 5.1%(+9.58)#1,753 |
| 59. | Sand Hill | 14.3% | 4.5%(+9.81)#59 | 5.1%(+9.23)#1,832 |
| 60. | Peavine | 14.3% | 4.5%(+9.81)#60 | 5.1%(+9.23)#1,833 |
| 61. | Kaw City | 14.3% | 4.5%(+9.81)#61 | 5.1%(+9.23)#1,836 |
| 62. | Short | 14.3% | 4.5%(+9.81)#62 | 5.1%(+9.23)#1,839 |
| 63. | Reydon | 14.3% | 4.5%(+9.81)#63 | 5.1%(+9.23)#1,847 |
| 64. | Wewoka | 14.1% | 4.5%(+9.65)#64 | 5.1%(+9.07)#1,875 |
| 65. | Briggs | 13.9% | 4.5%(+9.42)#65 | 5.1%(+8.84)#1,923 |
| 66. | Preston | 13.8% | 4.5%(+9.32)#66 | 5.1%(+8.74)#1,946 |
| 67. | Cedar Lake | 13.3% | 4.5%(+8.86)#67 | 5.1%(+8.28)#2,054 |
| 68. | Wakita | 13.3% | 4.5%(+8.86)#68 | 5.1%(+8.28)#2,055 |
| 69. | Millerton | 13.3% | 4.5%(+8.86)#69 | 5.1%(+8.28)#2,059 |
| 70. | Headrick | 13.3% | 4.5%(+8.86)#70 | 5.1%(+8.28)#2,068 |
| 71. | Checotah | 13.2% | 4.5%(+8.74)#71 | 5.1%(+8.16)#2,088 |
| 72. | Texhoma | 13.1% | 4.5%(+8.62)#72 | 5.1%(+8.04)#2,120 |
| 73. | Cookson | 13.1% | 4.5%(+8.58)#73 | 5.1%(+8.00)#2,122 |
| 74. | Calumet | 12.5% | 4.5%(+8.03)#74 | 5.1%(+7.45)#2,262 |
| 75. | Nicut | 12.5% | 4.5%(+8.03)#75 | 5.1%(+7.45)#2,268 |
| 76. | Milburn | 12.5% | 4.5%(+8.03)#76 | 5.1%(+7.45)#2,275 |
| 77. | Boynton | 12.5% | 4.5%(+8.03)#77 | 5.1%(+7.45)#2,289 |
| 78. | Cottonwood | 12.5% | 4.5%(+8.03)#78 | 5.1%(+7.45)#2,292 |
| 79. | Savanna | 12.3% | 4.5%(+7.84)#79 | 5.1%(+7.26)#2,339 |
| 80. | Fletcher | 12.2% | 4.5%(+7.77)#80 | 5.1%(+7.19)#2,358 |
| 81. | Wellston | 12.0% | 4.5%(+7.53)#81 | 5.1%(+6.95)#2,452 |
| 82. | Bethel Acres | 11.9% | 4.5%(+7.48)#82 | 5.1%(+6.90)#2,473 |
| 83. | Yale | 11.9% | 4.5%(+7.43)#83 | 5.1%(+6.85)#2,488 |
| 84. | Roland | 11.9% | 4.5%(+7.42)#84 | 5.1%(+6.84)#2,499 |
| 85. | Holdenville | 11.8% | 4.5%(+7.32)#85 | 5.1%(+6.74)#2,532 |
| 86. | Langley | 11.7% | 4.5%(+7.19)#86 | 5.1%(+6.62)#2,582 |
| 87. | Rocky Mountain | 11.6% | 4.5%(+7.12)#87 | 5.1%(+6.54)#2,605 |
| 88. | Paoli | 11.5% | 4.5%(+7.00)#88 | 5.1%(+6.42)#2,654 |
| 89. | Fairland | 11.2% | 4.5%(+6.74)#89 | 5.1%(+6.16)#2,750 |
| 90. | Oilton | 10.9% | 4.5%(+6.44)#90 | 5.1%(+5.86)#2,884 |
| 91. | Idabel | 10.6% | 4.5%(+6.14)#91 | 5.1%(+5.56)#3,012 |
| 92. | Ramona | 10.5% | 4.5%(+6.05)#92 | 5.1%(+5.48)#3,059 |
| 93. | Manchester | 10.5% | 4.5%(+6.05)#93 | 5.1%(+5.48)#3,075 |
| 94. | Cleveland | 10.5% | 4.5%(+6.03)#94 | 5.1%(+5.45)#3,087 |
| 95. | Toppers | 10.4% | 4.5%(+5.92)#95 | 5.1%(+5.34)#3,138 |
| 96. | Nowata | 10.4% | 4.5%(+5.91)#96 | 5.1%(+5.33)#3,149 |
| 97. | El Reno | 10.4% | 4.5%(+5.90)#97 | 5.1%(+5.32)#3,153 |
| 98. | Whitehorn Cove | 10.2% | 4.5%(+5.74)#98 | 5.1%(+5.16)#3,240 |
| 99. | Davenport | 10.2% | 4.5%(+5.73)#99 | 5.1%(+5.15)#3,250 |
| 100. | Beaver | 10.2% | 4.5%(+5.72)#100 | 5.1%(+5.14)#3,258 |
Common Questions
What are the Top 10 Cities with the Highest Percentage of Population with a Degree in Psychology in Oklahoma?
Top 10 Cities with the Highest Percentage of Population with a Degree in Psychology in Oklahoma are:
#1
100.0%
#2
80.0%
#3
58.6%
#4
53.8%
#5
50.0%
#6
50.0%
#7
50.0%
#8
44.8%
#9
40.0%
#10
40.0%
What city has the Highest Percentage of Population with a Degree in Psychology in Oklahoma?
New Woodville has the Highest Percentage of Population with a Degree in Psychology in Oklahoma with 100.0%.
What is the Percentage of Population with a Degree in Psychology in the State of Oklahoma?
Percentage of Population with a Degree in Psychology in Oklahoma is 4.5%.
What is the Percentage of Population with a Degree in Psychology in the United States?
Percentage of Population with a Degree in Psychology in the United States is 5.1%.