Cities with the Highest Percentage of Population with a Degree in Psychology in Montana
RELATED REPORTS & OPTIONS
Psychology
Montana
Compare Cities
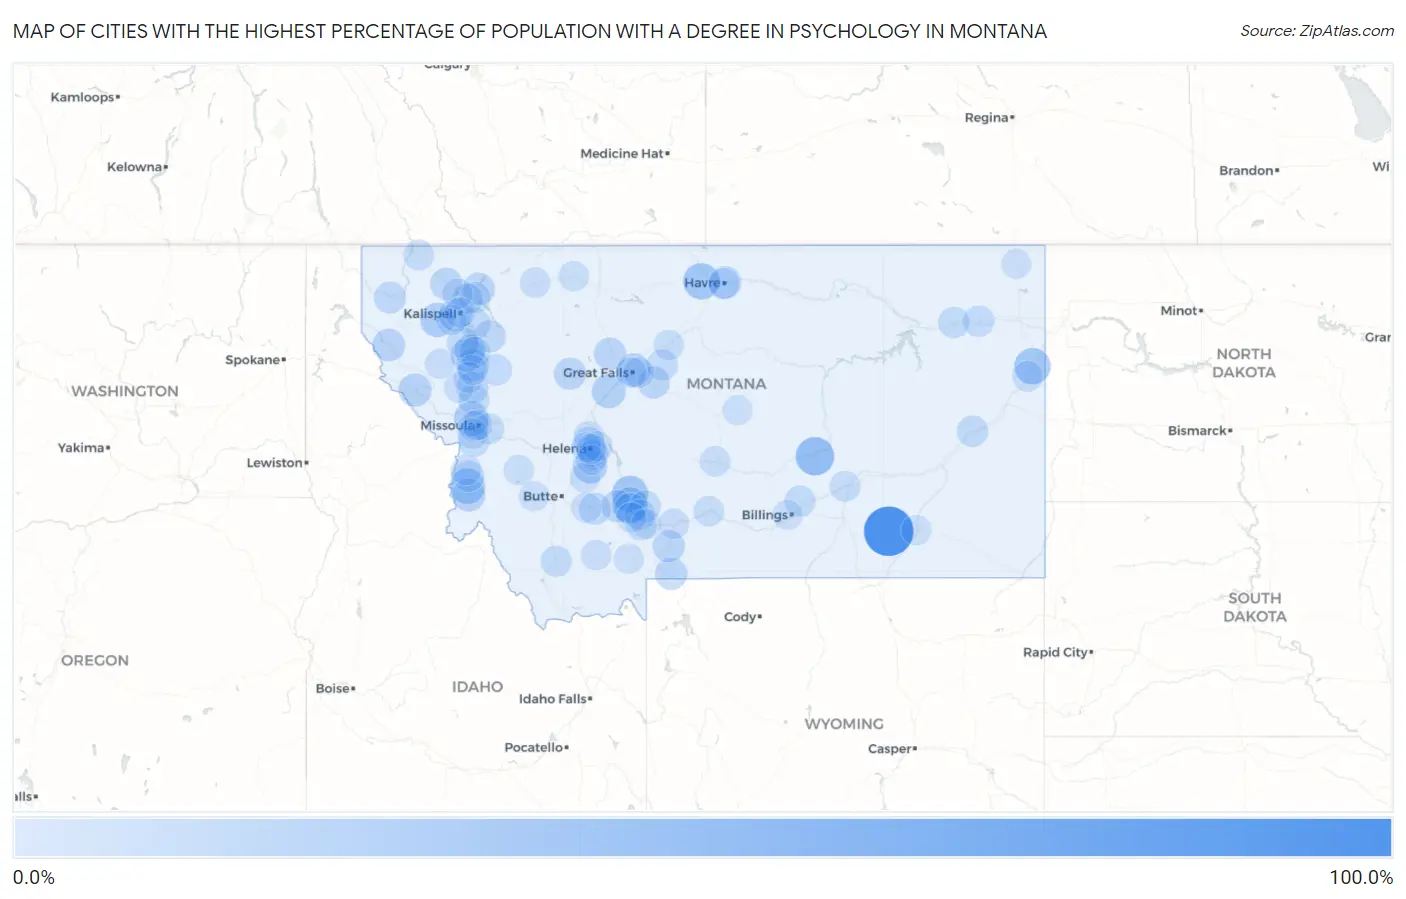
Map of Cities with the Highest Percentage of Population with a Degree in Psychology in Montana
0.0%
100.0%
Cities with the Highest Percentage of Population with a Degree in Psychology in Montana
| City | % Graduates | vs State | vs National | |
| 1. | Muddy | 100.0% | 4.2%(+95.8)#1 | 5.1%(+94.9)#5 |
| 2. | Vida | 60.0% | 4.2%(+55.8)#2 | 5.1%(+54.9)#115 |
| 3. | Fishtail | 46.3% | 4.2%(+42.1)#3 | 5.1%(+41.2)#234 |
| 4. | Musselshell | 44.4% | 4.2%(+40.2)#4 | 5.1%(+39.4)#255 |
| 5. | Crane | 33.3% | 4.2%(+29.1)#5 | 5.1%(+28.3)#420 |
| 6. | Kremlin | 33.3% | 4.2%(+29.1)#6 | 5.1%(+28.3)#436 |
| 7. | Ponderosa Pines | 32.4% | 4.2%(+28.1)#7 | 5.1%(+27.3)#446 |
| 8. | Gallatin River Ranch | 29.2% | 4.2%(+24.9)#8 | 5.1%(+24.1)#514 |
| 9. | Charlos Heights | 28.6% | 4.2%(+24.3)#9 | 5.1%(+23.5)#547 |
| 10. | Wye | 25.5% | 4.2%(+21.2)#10 | 5.1%(+20.4)#668 |
| 11. | Little Bitterroot Lake | 23.9% | 4.2%(+19.7)#11 | 5.1%(+18.9)#763 |
| 12. | Jefferson City | 23.5% | 4.2%(+19.3)#12 | 5.1%(+18.5)#784 |
| 13. | Cascade | 21.6% | 4.2%(+17.4)#13 | 5.1%(+16.5)#906 |
| 14. | Black Eagle | 19.0% | 4.2%(+14.7)#14 | 5.1%(+13.9)#1,160 |
| 15. | Jette | 18.5% | 4.2%(+14.2)#15 | 5.1%(+13.4)#1,206 |
| 16. | St Regis | 18.1% | 4.2%(+13.8)#16 | 5.1%(+13.0)#1,258 |
| 17. | Darby | 16.7% | 4.2%(+12.4)#17 | 5.1%(+11.6)#1,410 |
| 18. | Pablo | 16.4% | 4.2%(+12.2)#18 | 5.1%(+11.4)#1,467 |
| 19. | Trout Creek | 16.0% | 4.2%(+11.7)#19 | 5.1%(+10.9)#1,530 |
| 20. | Batavia | 15.8% | 4.2%(+11.5)#20 | 5.1%(+10.7)#1,560 |
| 21. | Havre North | 15.4% | 4.2%(+11.1)#21 | 5.1%(+10.3)#1,620 |
| 22. | Floweree | 14.3% | 4.2%(+10.0)#22 | 5.1%(+9.23)#1,862 |
| 23. | Jardine | 13.8% | 4.2%(+9.55)#23 | 5.1%(+8.74)#1,952 |
| 24. | West Glacier | 13.3% | 4.2%(+9.09)#24 | 5.1%(+8.28)#2,061 |
| 25. | Olney | 13.3% | 4.2%(+9.09)#25 | 5.1%(+8.28)#2,064 |
| 26. | Three Forks | 13.3% | 4.2%(+9.03)#26 | 5.1%(+8.22)#2,077 |
| 27. | Belt | 13.0% | 4.2%(+8.80)#27 | 5.1%(+7.99)#2,126 |
| 28. | Augusta | 13.0% | 4.2%(+8.80)#28 | 5.1%(+7.99)#2,130 |
| 29. | Power | 13.0% | 4.2%(+8.80)#29 | 5.1%(+7.99)#2,131 |
| 30. | Pray | 12.9% | 4.2%(+8.63)#30 | 5.1%(+7.82)#2,169 |
| 31. | Essex | 12.8% | 4.2%(+8.58)#31 | 5.1%(+7.77)#2,177 |
| 32. | Cardwell | 12.5% | 4.2%(+8.26)#32 | 5.1%(+7.45)#2,297 |
| 33. | Swan Lake | 12.3% | 4.2%(+8.07)#33 | 5.1%(+7.26)#2,341 |
| 34. | Libby | 12.1% | 4.2%(+7.83)#34 | 5.1%(+7.02)#2,422 |
| 35. | St Ignatius | 11.4% | 4.2%(+7.12)#35 | 5.1%(+6.31)#2,699 |
| 36. | Manhattan | 10.6% | 4.2%(+6.35)#36 | 5.1%(+5.54)#3,023 |
| 37. | Bigfork | 10.2% | 4.2%(+5.95)#37 | 5.1%(+5.14)#3,256 |
| 38. | Springhill | 9.8% | 4.2%(+5.60)#38 | 5.1%(+4.78)#3,472 |
| 39. | Dayton | 9.8% | 4.2%(+5.56)#39 | 5.1%(+4.75)#3,490 |
| 40. | Terry | 9.8% | 4.2%(+5.54)#40 | 5.1%(+4.73)#3,502 |
| 41. | Shepherd | 9.5% | 4.2%(+5.23)#41 | 5.1%(+4.42)#3,674 |
| 42. | Carlton | 9.3% | 4.2%(+5.11)#42 | 5.1%(+4.29)#3,759 |
| 43. | Poplar | 9.3% | 4.2%(+5.09)#43 | 5.1%(+4.28)#3,769 |
| 44. | Kings Point | 9.3% | 4.2%(+5.07)#44 | 5.1%(+4.26)#3,782 |
| 45. | Wolf Point | 9.3% | 4.2%(+5.06)#45 | 5.1%(+4.25)#3,788 |
| 46. | Condon | 9.2% | 4.2%(+4.95)#46 | 5.1%(+4.14)#3,864 |
| 47. | Arlee | 9.1% | 4.2%(+4.85)#47 | 5.1%(+4.04)#3,944 |
| 48. | Dillon | 9.1% | 4.2%(+4.83)#48 | 5.1%(+4.02)#3,987 |
| 49. | Helena Valley West Central | 9.1% | 4.2%(+4.81)#49 | 5.1%(+4.00)#3,996 |
| 50. | Hungry Horse | 8.9% | 4.2%(+4.62)#50 | 5.1%(+3.81)#4,119 |
| 51. | Hamilton | 8.8% | 4.2%(+4.61)#51 | 5.1%(+3.80)#4,128 |
| 52. | Finley Point | 8.4% | 4.2%(+4.16)#52 | 5.1%(+3.35)#4,492 |
| 53. | Highwood | 8.3% | 4.2%(+4.09)#53 | 5.1%(+3.28)#4,589 |
| 54. | Turah | 8.0% | 4.2%(+3.81)#54 | 5.1%(+2.99)#4,814 |
| 55. | Havre | 7.8% | 4.2%(+3.59)#55 | 5.1%(+2.78)#5,036 |
| 56. | Charlo | 7.7% | 4.2%(+3.45)#56 | 5.1%(+2.64)#5,193 |
| 57. | Custer | 7.7% | 4.2%(+3.45)#57 | 5.1%(+2.64)#5,210 |
| 58. | King Arthur Park | 7.6% | 4.2%(+3.36)#58 | 5.1%(+2.55)#5,280 |
| 59. | Savage | 7.5% | 4.2%(+3.31)#59 | 5.1%(+2.50)#5,338 |
| 60. | Columbia Falls | 7.5% | 4.2%(+3.28)#60 | 5.1%(+2.47)#5,363 |
| 61. | Belgrade | 7.0% | 4.2%(+2.73)#61 | 5.1%(+1.92)#6,080 |
| 62. | Eureka | 6.7% | 4.2%(+2.43)#62 | 5.1%(+1.62)#6,502 |
| 63. | Big Timber | 6.3% | 4.2%(+2.08)#63 | 5.1%(+1.26)#7,110 |
| 64. | Harlowton | 6.1% | 4.2%(+1.82)#64 | 5.1%(+1.01)#7,598 |
| 65. | Virginia City | 5.9% | 4.2%(+1.64)#65 | 5.1%(+0.831)#7,966 |
| 66. | South Hills | 5.8% | 4.2%(+1.58)#66 | 5.1%(+0.767)#8,079 |
| 67. | Orchard Homes | 5.8% | 4.2%(+1.53)#67 | 5.1%(+0.722)#8,166 |
| 68. | Malmstrom Afb | 5.7% | 4.2%(+1.48)#68 | 5.1%(+0.672)#8,284 |
| 69. | Lolo | 5.7% | 4.2%(+1.43)#69 | 5.1%(+0.624)#8,386 |
| 70. | Helena Valley Northwest | 5.6% | 4.2%(+1.39)#70 | 5.1%(+0.580)#8,465 |
| 71. | Missoula | 5.6% | 4.2%(+1.33)#71 | 5.1%(+0.518)#8,573 |
| 72. | Livingston | 5.6% | 4.2%(+1.31)#72 | 5.1%(+0.502)#8,650 |
| 73. | Kila | 5.5% | 4.2%(+1.24)#73 | 5.1%(+0.428)#8,781 |
| 74. | Great Falls | 5.2% | 4.2%(+0.910)#74 | 5.1%(+0.100)#9,554 |
| 75. | Cut Bank | 5.1% | 4.2%(+0.861)#75 | 5.1%(+0.051)#9,666 |
| 76. | Montana City | 5.1% | 4.2%(+0.851)#76 | 5.1%(+0.041)#9,697 |
| 77. | York | 5.0% | 4.2%(+0.795)#77 | 5.1%(-0.015)#9,830 |
| 78. | Whitefish | 5.0% | 4.2%(+0.790)#78 | 5.1%(-0.021)#9,840 |
| 79. | Helena Valley Southeast | 5.0% | 4.2%(+0.772)#79 | 5.1%(-0.038)#9,877 |
| 80. | Pinesdale | 5.0% | 4.2%(+0.759)#80 | 5.1%(-0.051)#9,913 |
| 81. | Browning | 4.9% | 4.2%(+0.698)#81 | 5.1%(-0.113)#10,073 |
| 82. | Kalispell | 4.9% | 4.2%(+0.640)#82 | 5.1%(-0.170)#10,203 |
| 83. | Hot Springs | 4.9% | 4.2%(+0.637)#83 | 5.1%(-0.173)#10,215 |
| 84. | Boulder | 4.8% | 4.2%(+0.567)#84 | 5.1%(-0.243)#10,397 |
| 85. | Whitehall | 4.8% | 4.2%(+0.544)#85 | 5.1%(-0.266)#10,455 |
| 86. | Philipsburg | 4.8% | 4.2%(+0.521)#86 | 5.1%(-0.289)#10,497 |
| 87. | Fort Benton | 4.7% | 4.2%(+0.495)#87 | 5.1%(-0.316)#10,579 |
| 88. | Ashland | 4.7% | 4.2%(+0.476)#88 | 5.1%(-0.334)#10,634 |
| 89. | Dixon | 4.7% | 4.2%(+0.410)#89 | 5.1%(-0.400)#10,808 |
| 90. | Ronan | 4.6% | 4.2%(+0.362)#90 | 5.1%(-0.449)#10,909 |
| 91. | Lewistown | 4.6% | 4.2%(+0.313)#91 | 5.1%(-0.497)#11,012 |
| 92. | Bozeman | 4.3% | 4.2%(+0.090)#92 | 5.1%(-0.720)#11,554 |
| 93. | Big Sky | 4.2% | 4.2%(-0.036)#93 | 5.1%(-0.847)#11,838 |
| 94. | Anaconda Deer Lodge County | 4.2% | 4.2%(-0.077)#94 | 5.1%(-0.887)#11,951 |
| 95. | Clancy | 4.2% | 4.2%(-0.090)#95 | 5.1%(-0.901)#11,975 |
| 96. | Churchill | 4.1% | 4.2%(-0.127)#96 | 5.1%(-0.937)#12,061 |
| 97. | Helena West Side | 4.1% | 4.2%(-0.142)#97 | 5.1%(-0.953)#12,092 |
| 98. | Helena | 4.1% | 4.2%(-0.144)#98 | 5.1%(-0.955)#12,097 |
| 99. | Billings | 4.0% | 4.2%(-0.236)#99 | 5.1%(-1.05)#12,325 |
| 100. | Plentywood | 3.9% | 4.2%(-0.325)#100 | 5.1%(-1.14)#12,553 |
Common Questions
What are the Top 10 Cities with the Highest Percentage of Population with a Degree in Psychology in Montana?
Top 10 Cities with the Highest Percentage of Population with a Degree in Psychology in Montana are:
#1
100.0%
#2
44.4%
#3
33.3%
#4
33.3%
#5
32.4%
#6
29.2%
#7
28.6%
#8
25.5%
#9
23.9%
#10
23.5%
What city has the Highest Percentage of Population with a Degree in Psychology in Montana?
Muddy has the Highest Percentage of Population with a Degree in Psychology in Montana with 100.0%.
What is the Percentage of Population with a Degree in Psychology in the State of Montana?
Percentage of Population with a Degree in Psychology in Montana is 4.2%.
What is the Percentage of Population with a Degree in Psychology in the United States?
Percentage of Population with a Degree in Psychology in the United States is 5.1%.