Cities with the Highest Percentage of Population with a Degree in Psychology in Illinois
RELATED REPORTS & OPTIONS
Psychology
Illinois
Compare Cities
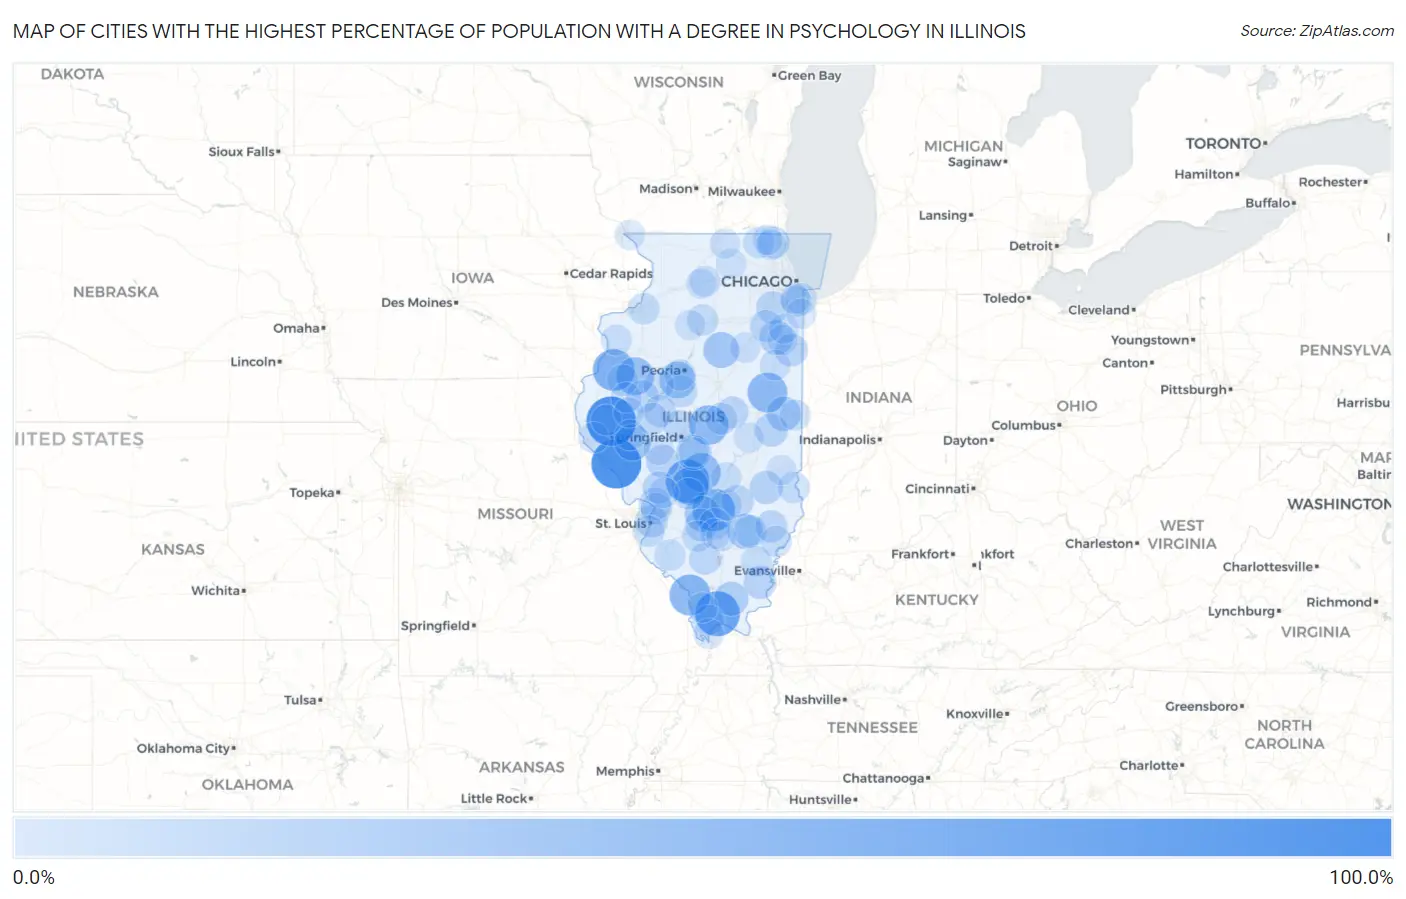
Map of Cities with the Highest Percentage of Population with a Degree in Psychology in Illinois
0.0%
100.0%
Cities with the Highest Percentage of Population with a Degree in Psychology in Illinois
| City | % Graduates | vs State | vs National | |
| 1. | Nebo | 100.0% | 4.9%(+95.1)#1 | 5.1%(+94.9)#15 |
| 2. | Mound Station | 100.0% | 4.9%(+95.1)#2 | 5.1%(+94.9)#25 |
| 3. | Cypress | 77.8% | 4.9%(+72.9)#3 | 5.1%(+72.7)#61 |
| 4. | Butler | 72.0% | 4.9%(+67.1)#4 | 5.1%(+66.9)#70 |
| 5. | Vernon | 66.7% | 4.9%(+61.8)#5 | 5.1%(+61.6)#89 |
| 6. | Raritan | 63.6% | 4.9%(+58.8)#6 | 5.1%(+58.6)#104 |
| 7. | Grand Tower | 60.0% | 4.9%(+55.1)#7 | 5.1%(+54.9)#112 |
| 8. | Ludlow | 54.5% | 4.9%(+49.7)#8 | 5.1%(+49.5)#138 |
| 9. | Latham | 53.1% | 4.9%(+48.2)#9 | 5.1%(+48.0)#145 |
| 10. | Ritchie | 50.0% | 4.9%(+45.1)#10 | 5.1%(+44.9)#180 |
| 11. | Wenonah | 50.0% | 4.9%(+45.1)#11 | 5.1%(+44.9)#207 |
| 12. | Prairie City | 46.4% | 4.9%(+41.6)#12 | 5.1%(+41.4)#232 |
| 13. | Taylor Springs | 46.2% | 4.9%(+41.3)#13 | 5.1%(+41.1)#235 |
| 14. | Mapleton | 40.0% | 4.9%(+35.1)#14 | 5.1%(+34.9)#302 |
| 15. | Exeter | 40.0% | 4.9%(+35.1)#15 | 5.1%(+34.9)#311 |
| 16. | Dana | 37.5% | 4.9%(+32.6)#16 | 5.1%(+32.4)#346 |
| 17. | Keyesport | 36.4% | 4.9%(+31.5)#17 | 5.1%(+31.3)#362 |
| 18. | Bulpitt | 33.3% | 4.9%(+28.5)#18 | 5.1%(+28.3)#416 |
| 19. | Johnsonville | 33.3% | 4.9%(+28.5)#19 | 5.1%(+28.3)#435 |
| 20. | Literberry | 32.0% | 4.9%(+27.1)#20 | 5.1%(+26.9)#452 |
| 21. | Muncie | 30.6% | 4.9%(+25.7)#21 | 5.1%(+25.5)#483 |
| 22. | Limestone | 30.1% | 4.9%(+25.2)#22 | 5.1%(+25.0)#491 |
| 23. | New Burnside | 29.4% | 4.9%(+24.6)#23 | 5.1%(+24.4)#508 |
| 24. | Longview | 25.0% | 4.9%(+20.1)#24 | 5.1%(+19.9)#714 |
| 25. | Rose Hill | 25.0% | 4.9%(+20.1)#25 | 5.1%(+19.9)#721 |
| 26. | Ridgway | 24.2% | 4.9%(+19.4)#26 | 5.1%(+19.2)#745 |
| 27. | Modesto | 24.1% | 4.9%(+19.3)#27 | 5.1%(+19.1)#752 |
| 28. | Papineau | 23.5% | 4.9%(+18.7)#28 | 5.1%(+18.5)#789 |
| 29. | Ingalls Park | 22.7% | 4.9%(+17.9)#29 | 5.1%(+17.7)#825 |
| 30. | Cisne | 22.7% | 4.9%(+17.9)#30 | 5.1%(+17.7)#828 |
| 31. | Huey | 22.2% | 4.9%(+17.4)#31 | 5.1%(+17.2)#865 |
| 32. | Brooklyn | 22.0% | 4.9%(+17.1)#32 | 5.1%(+16.9)#886 |
| 33. | East Alton | 21.8% | 4.9%(+17.0)#33 | 5.1%(+16.8)#890 |
| 34. | Lakewood Shores | 21.4% | 4.9%(+16.6)#34 | 5.1%(+16.4)#922 |
| 35. | Ipava | 21.1% | 4.9%(+16.2)#35 | 5.1%(+16.0)#953 |
| 36. | Cantrall | 21.1% | 4.9%(+16.2)#36 | 5.1%(+16.0)#958 |
| 37. | Shipman | 20.9% | 4.9%(+16.1)#37 | 5.1%(+15.9)#965 |
| 38. | Edgewood | 20.8% | 4.9%(+16.0)#38 | 5.1%(+15.8)#974 |
| 39. | Tamaroa | 20.0% | 4.9%(+15.1)#39 | 5.1%(+14.9)#1,034 |
| 40. | Weldon | 20.0% | 4.9%(+15.1)#40 | 5.1%(+14.9)#1,042 |
| 41. | Kilbourne | 20.0% | 4.9%(+15.1)#41 | 5.1%(+14.9)#1,045 |
| 42. | Parkersburg | 20.0% | 4.9%(+15.1)#42 | 5.1%(+14.9)#1,047 |
| 43. | Green Valley | 19.5% | 4.9%(+14.7)#43 | 5.1%(+14.5)#1,096 |
| 44. | Maroa | 19.5% | 4.9%(+14.7)#44 | 5.1%(+14.5)#1,097 |
| 45. | Third Lake | 19.4% | 4.9%(+14.6)#45 | 5.1%(+14.4)#1,110 |
| 46. | Hartford | 19.2% | 4.9%(+14.4)#46 | 5.1%(+14.2)#1,125 |
| 47. | Plum Valley | 19.1% | 4.9%(+14.3)#47 | 5.1%(+14.1)#1,139 |
| 48. | Chandlerville | 19.0% | 4.9%(+14.2)#48 | 5.1%(+14.0)#1,148 |
| 49. | Alexander | 18.8% | 4.9%(+13.9)#49 | 5.1%(+13.7)#1,175 |
| 50. | Hutsonville | 18.4% | 4.9%(+13.5)#50 | 5.1%(+13.3)#1,214 |
| 51. | Dupo | 18.3% | 4.9%(+13.4)#51 | 5.1%(+13.2)#1,224 |
| 52. | Cleveland | 18.2% | 4.9%(+13.3)#52 | 5.1%(+13.1)#1,243 |
| 53. | Odin | 17.9% | 4.9%(+13.0)#53 | 5.1%(+12.8)#1,276 |
| 54. | Panama | 17.6% | 4.9%(+12.8)#54 | 5.1%(+12.6)#1,310 |
| 55. | Seatonville | 17.4% | 4.9%(+12.5)#55 | 5.1%(+12.3)#1,332 |
| 56. | Burnham | 17.3% | 4.9%(+12.5)#56 | 5.1%(+12.3)#1,342 |
| 57. | Mccullom Lake | 17.0% | 4.9%(+12.1)#57 | 5.1%(+11.9)#1,376 |
| 58. | Baldwin | 16.7% | 4.9%(+11.8)#58 | 5.1%(+11.6)#1,423 |
| 59. | Browns | 16.7% | 4.9%(+11.8)#59 | 5.1%(+11.6)#1,429 |
| 60. | St Peter | 16.2% | 4.9%(+11.4)#60 | 5.1%(+11.2)#1,494 |
| 61. | Good Hope | 16.2% | 4.9%(+11.3)#61 | 5.1%(+11.1)#1,496 |
| 62. | New Minden | 16.0% | 4.9%(+11.1)#62 | 5.1%(+10.9)#1,526 |
| 63. | Bartonville | 15.9% | 4.9%(+11.1)#63 | 5.1%(+10.9)#1,535 |
| 64. | Phoenix | 15.9% | 4.9%(+11.0)#64 | 5.1%(+10.8)#1,546 |
| 65. | Tilton | 15.4% | 4.9%(+10.6)#65 | 5.1%(+10.4)#1,612 |
| 66. | Seaton | 15.4% | 4.9%(+10.5)#66 | 5.1%(+10.3)#1,629 |
| 67. | Plainville | 15.0% | 4.9%(+10.1)#67 | 5.1%(+9.95)#1,694 |
| 68. | Ashton | 14.9% | 4.9%(+10.0)#68 | 5.1%(+9.84)#1,708 |
| 69. | Clayton | 14.8% | 4.9%(+9.96)#69 | 5.1%(+9.76)#1,718 |
| 70. | Meredosia | 14.6% | 4.9%(+9.78)#70 | 5.1%(+9.58)#1,751 |
| 71. | Gilman | 14.4% | 4.9%(+9.58)#71 | 5.1%(+9.38)#1,800 |
| 72. | Enfield | 14.3% | 4.9%(+9.43)#72 | 5.1%(+9.23)#1,820 |
| 73. | Cowden | 14.3% | 4.9%(+9.43)#73 | 5.1%(+9.23)#1,823 |
| 74. | Dunfermline | 14.3% | 4.9%(+9.43)#74 | 5.1%(+9.23)#1,826 |
| 75. | Bunker Hill | 14.0% | 4.9%(+9.11)#75 | 5.1%(+8.92)#1,912 |
| 76. | Industry | 13.4% | 4.9%(+8.58)#76 | 5.1%(+8.38)#2,021 |
| 77. | Ullin | 13.4% | 4.9%(+8.58)#77 | 5.1%(+8.38)#2,022 |
| 78. | Walnut Hill | 13.3% | 4.9%(+8.48)#78 | 5.1%(+8.28)#2,066 |
| 79. | Kankakee | 13.3% | 4.9%(+8.47)#79 | 5.1%(+8.28)#2,071 |
| 80. | Mound City | 13.2% | 4.9%(+8.30)#80 | 5.1%(+8.11)#2,104 |
| 81. | Odell | 13.1% | 4.9%(+8.26)#81 | 5.1%(+8.06)#2,115 |
| 82. | Franklin | 12.9% | 4.9%(+8.00)#82 | 5.1%(+7.81)#2,172 |
| 83. | Cahokia Heights | 12.7% | 4.9%(+7.83)#83 | 5.1%(+7.64)#2,212 |
| 84. | Kingston | 12.5% | 4.9%(+7.64)#84 | 5.1%(+7.45)#2,254 |
| 85. | Franklin Grove | 12.5% | 4.9%(+7.64)#85 | 5.1%(+7.45)#2,255 |
| 86. | Riverdale | 12.4% | 4.9%(+7.54)#86 | 5.1%(+7.35)#2,316 |
| 87. | Hainesville | 12.4% | 4.9%(+7.52)#87 | 5.1%(+7.32)#2,323 |
| 88. | Martinsville | 12.4% | 4.9%(+7.51)#88 | 5.1%(+7.31)#2,324 |
| 89. | Tiskilwa | 12.4% | 4.9%(+7.50)#89 | 5.1%(+7.31)#2,327 |
| 90. | Rushville | 12.4% | 4.9%(+7.50)#90 | 5.1%(+7.31)#2,329 |
| 91. | Fox Lake Hills | 12.2% | 4.9%(+7.30)#91 | 5.1%(+7.11)#2,387 |
| 92. | Manteno | 12.2% | 4.9%(+7.30)#92 | 5.1%(+7.11)#2,390 |
| 93. | Jonesboro | 12.1% | 4.9%(+7.26)#93 | 5.1%(+7.07)#2,403 |
| 94. | Atwood | 12.1% | 4.9%(+7.26)#94 | 5.1%(+7.07)#2,406 |
| 95. | Willowbrook | 12.1% | 4.9%(+7.20)#95 | 5.1%(+7.00)#2,428 |
| 96. | Kincaid | 12.0% | 4.9%(+7.14)#96 | 5.1%(+6.95)#2,447 |
| 97. | Dix | 11.9% | 4.9%(+7.05)#97 | 5.1%(+6.85)#2,490 |
| 98. | Candlewick Lake | 11.8% | 4.9%(+6.98)#98 | 5.1%(+6.79)#2,516 |
| 99. | Rest Haven | 11.8% | 4.9%(+6.91)#99 | 5.1%(+6.71)#2,543 |
| 100. | Menominee | 11.8% | 4.9%(+6.91)#100 | 5.1%(+6.71)#2,548 |
Common Questions
What are the Top 10 Cities with the Highest Percentage of Population with a Degree in Psychology in Illinois?
Top 10 Cities with the Highest Percentage of Population with a Degree in Psychology in Illinois are:
#1
100.0%
#2
100.0%
#3
77.8%
#4
72.0%
#5
66.7%
#6
63.6%
#7
60.0%
#8
54.5%
#9
53.1%
#10
50.0%
What city has the Highest Percentage of Population with a Degree in Psychology in Illinois?
Nebo has the Highest Percentage of Population with a Degree in Psychology in Illinois with 100.0%.
What is the Percentage of Population with a Degree in Psychology in the State of Illinois?
Percentage of Population with a Degree in Psychology in Illinois is 4.9%.
What is the Percentage of Population with a Degree in Psychology in the United States?
Percentage of Population with a Degree in Psychology in the United States is 5.1%.