Cities with the Highest Percentage of Population with a Degree in Psychology in Delaware
RELATED REPORTS & OPTIONS
Psychology
Delaware
Compare Cities
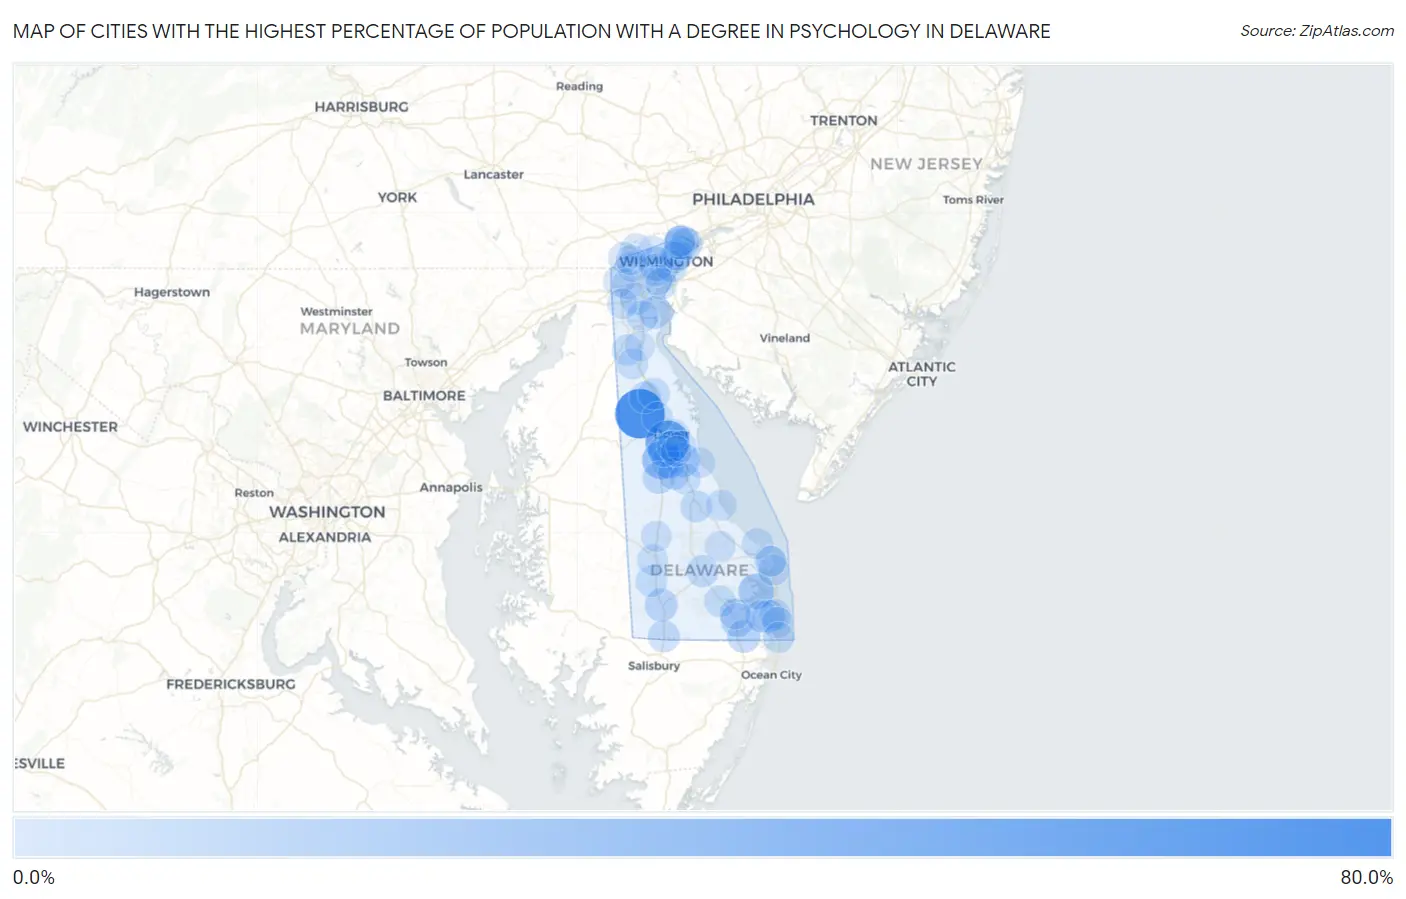
Map of Cities with the Highest Percentage of Population with a Degree in Psychology in Delaware
0.0%
80.0%
Cities with the Highest Percentage of Population with a Degree in Psychology in Delaware
| City | % Graduates | vs State | vs National | |
| 1. | Kenton | 72.0% | 4.9%(+67.1)#1 | 5.1%(+66.9)#69 |
| 2. | Rodney Village | 50.6% | 4.9%(+45.7)#2 | 5.1%(+45.6)#155 |
| 3. | Woodside | 29.2% | 4.9%(+24.3)#3 | 5.1%(+24.1)#513 |
| 4. | Long Neck | 19.4% | 4.9%(+14.5)#4 | 5.1%(+14.3)#1,112 |
| 5. | Ardentown | 16.6% | 4.9%(+11.7)#5 | 5.1%(+11.5)#1,455 |
| 6. | Magnolia | 15.5% | 4.9%(+10.6)#6 | 5.1%(+10.5)#1,602 |
| 7. | Woodside East | 14.5% | 4.9%(+9.64)#7 | 5.1%(+9.46)#1,789 |
| 8. | Elsmere | 13.9% | 4.9%(+9.00)#8 | 5.1%(+8.82)#1,931 |
| 9. | Frankford | 12.5% | 4.9%(+7.63)#9 | 5.1%(+7.45)#2,257 |
| 10. | Selbyville | 10.3% | 4.9%(+5.47)#10 | 5.1%(+5.28)#3,182 |
| 11. | Laurel | 9.9% | 4.9%(+5.02)#11 | 5.1%(+4.84)#3,438 |
| 12. | Ocean View | 9.8% | 4.9%(+4.93)#12 | 5.1%(+4.75)#3,491 |
| 13. | Delaware City | 8.6% | 4.9%(+3.73)#13 | 5.1%(+3.54)#4,340 |
| 14. | Millville | 8.4% | 4.9%(+3.57)#14 | 5.1%(+3.39)#4,452 |
| 15. | Felton | 8.3% | 4.9%(+3.39)#15 | 5.1%(+3.21)#4,646 |
| 16. | Claymont | 8.1% | 4.9%(+3.18)#16 | 5.1%(+3.00)#4,809 |
| 17. | Newport | 7.3% | 4.9%(+2.45)#17 | 5.1%(+2.27)#5,617 |
| 18. | Bear | 6.9% | 4.9%(+2.03)#18 | 5.1%(+1.85)#6,173 |
| 19. | Wilmington | 6.9% | 4.9%(+2.01)#19 | 5.1%(+1.83)#6,207 |
| 20. | Georgetown | 6.8% | 4.9%(+1.95)#20 | 5.1%(+1.77)#6,290 |
| 21. | Delmar | 6.8% | 4.9%(+1.90)#21 | 5.1%(+1.72)#6,371 |
| 22. | Riverview | 6.7% | 4.9%(+1.87)#22 | 5.1%(+1.69)#6,408 |
| 23. | Milford | 6.5% | 4.9%(+1.66)#23 | 5.1%(+1.48)#6,733 |
| 24. | Millsboro | 6.0% | 4.9%(+1.11)#24 | 5.1%(+0.930)#7,752 |
| 25. | Clayton | 5.9% | 4.9%(+0.999)#25 | 5.1%(+0.817)#7,990 |
| 26. | Camden | 5.8% | 4.9%(+0.954)#26 | 5.1%(+0.772)#8,070 |
| 27. | Smyrna | 5.6% | 4.9%(+0.700)#27 | 5.1%(+0.518)#8,574 |
| 28. | Seaford | 5.4% | 4.9%(+0.565)#28 | 5.1%(+0.382)#8,891 |
| 29. | Bethany Beach | 5.3% | 4.9%(+0.447)#29 | 5.1%(+0.264)#9,161 |
| 30. | St Georges | 5.3% | 4.9%(+0.394)#30 | 5.1%(+0.212)#9,268 |
| 31. | Dover | 5.2% | 4.9%(+0.374)#31 | 5.1%(+0.191)#9,350 |
| 32. | New Castle | 5.1% | 4.9%(+0.247)#32 | 5.1%(+0.065)#9,639 |
| 33. | Edgemoor | 5.0% | 4.9%(+0.088)#33 | 5.1%(-0.094)#10,040 |
| 34. | Cheswold | 4.8% | 4.9%(-0.056)#34 | 5.1%(-0.238)#10,385 |
| 35. | Rehoboth Beach | 4.5% | 4.9%(-0.328)#35 | 5.1%(-0.510)#11,081 |
| 36. | Middletown | 4.2% | 4.9%(-0.638)#36 | 5.1%(-0.821)#11,764 |
| 37. | South Bethany | 3.9% | 4.9%(-0.983)#37 | 5.1%(-1.17)#12,614 |
| 38. | Lewes | 3.9% | 4.9%(-1.01)#38 | 5.1%(-1.19)#12,678 |
| 39. | Dagsboro | 3.7% | 4.9%(-1.13)#39 | 5.1%(-1.31)#12,969 |
| 40. | Fenwick Island | 3.7% | 4.9%(-1.13)#40 | 5.1%(-1.31)#12,974 |
| 41. | Hockessin | 3.7% | 4.9%(-1.19)#41 | 5.1%(-1.37)#13,098 |
| 42. | Newark | 3.6% | 4.9%(-1.30)#42 | 5.1%(-1.48)#13,395 |
| 43. | Pike Creek Valley | 3.5% | 4.9%(-1.34)#43 | 5.1%(-1.52)#13,472 |
| 44. | Highland Acres | 3.5% | 4.9%(-1.42)#44 | 5.1%(-1.60)#13,638 |
| 45. | Bellefonte | 3.4% | 4.9%(-1.46)#45 | 5.1%(-1.64)#13,746 |
| 46. | Frederica | 3.4% | 4.9%(-1.50)#46 | 5.1%(-1.68)#13,843 |
| 47. | North Star | 3.3% | 4.9%(-1.61)#47 | 5.1%(-1.80)#14,093 |
| 48. | Bridgeville | 3.1% | 4.9%(-1.74)#48 | 5.1%(-1.93)#14,392 |
| 49. | Greenwood | 3.1% | 4.9%(-1.78)#49 | 5.1%(-1.96)#14,484 |
| 50. | Brookside | 3.1% | 4.9%(-1.81)#50 | 5.1%(-1.99)#14,537 |
| 51. | Townsend | 3.0% | 4.9%(-1.85)#51 | 5.1%(-2.03)#14,642 |
| 52. | Dewey Beach | 3.0% | 4.9%(-1.88)#52 | 5.1%(-2.06)#14,698 |
| 53. | Slaughter Beach | 2.8% | 4.9%(-2.04)#53 | 5.1%(-2.23)#15,065 |
| 54. | Dover Base Housing | 2.8% | 4.9%(-2.05)#54 | 5.1%(-2.23)#15,070 |
| 55. | Ardencroft | 2.8% | 4.9%(-2.12)#55 | 5.1%(-2.30)#15,215 |
| 56. | Glasgow | 2.5% | 4.9%(-2.38)#56 | 5.1%(-2.56)#15,688 |
| 57. | Greenville | 2.5% | 4.9%(-2.40)#57 | 5.1%(-2.58)#15,711 |
| 58. | Milton | 2.4% | 4.9%(-2.47)#58 | 5.1%(-2.65)#15,849 |
| 59. | Pike Creek | 2.2% | 4.9%(-2.71)#59 | 5.1%(-2.89)#16,289 |
| 60. | Bowers | 2.2% | 4.9%(-2.72)#60 | 5.1%(-2.90)#16,315 |
| 61. | Arden | 2.0% | 4.9%(-2.88)#61 | 5.1%(-3.06)#16,593 |
| 62. | Henlopen Acres | 1.9% | 4.9%(-2.99)#62 | 5.1%(-3.18)#16,808 |
| 63. | Rising Sun Lebanon | 1.9% | 4.9%(-3.01)#63 | 5.1%(-3.20)#16,837 |
| 64. | Wilmington Manor | 1.1% | 4.9%(-3.75)#64 | 5.1%(-3.94)#17,839 |
| 65. | Odessa | 0.76% | 4.9%(-4.11)#65 | 5.1%(-4.29)#18,147 |
1
Common Questions
What are the Top 10 Cities with the Highest Percentage of Population with a Degree in Psychology in Delaware?
Top 10 Cities with the Highest Percentage of Population with a Degree in Psychology in Delaware are:
#1
72.0%
#2
50.6%
#3
29.2%
#4
19.4%
#5
16.6%
#6
15.5%
#7
14.5%
#8
13.9%
#9
12.5%
#10
10.3%
What city has the Highest Percentage of Population with a Degree in Psychology in Delaware?
Kenton has the Highest Percentage of Population with a Degree in Psychology in Delaware with 72.0%.
What is the Percentage of Population with a Degree in Psychology in the State of Delaware?
Percentage of Population with a Degree in Psychology in Delaware is 4.9%.
What is the Percentage of Population with a Degree in Psychology in the United States?
Percentage of Population with a Degree in Psychology in the United States is 5.1%.