Cities with the Highest Percentage of Population with a Degree in Psychology in Mississippi
RELATED REPORTS & OPTIONS
Psychology
Mississippi
Compare Cities
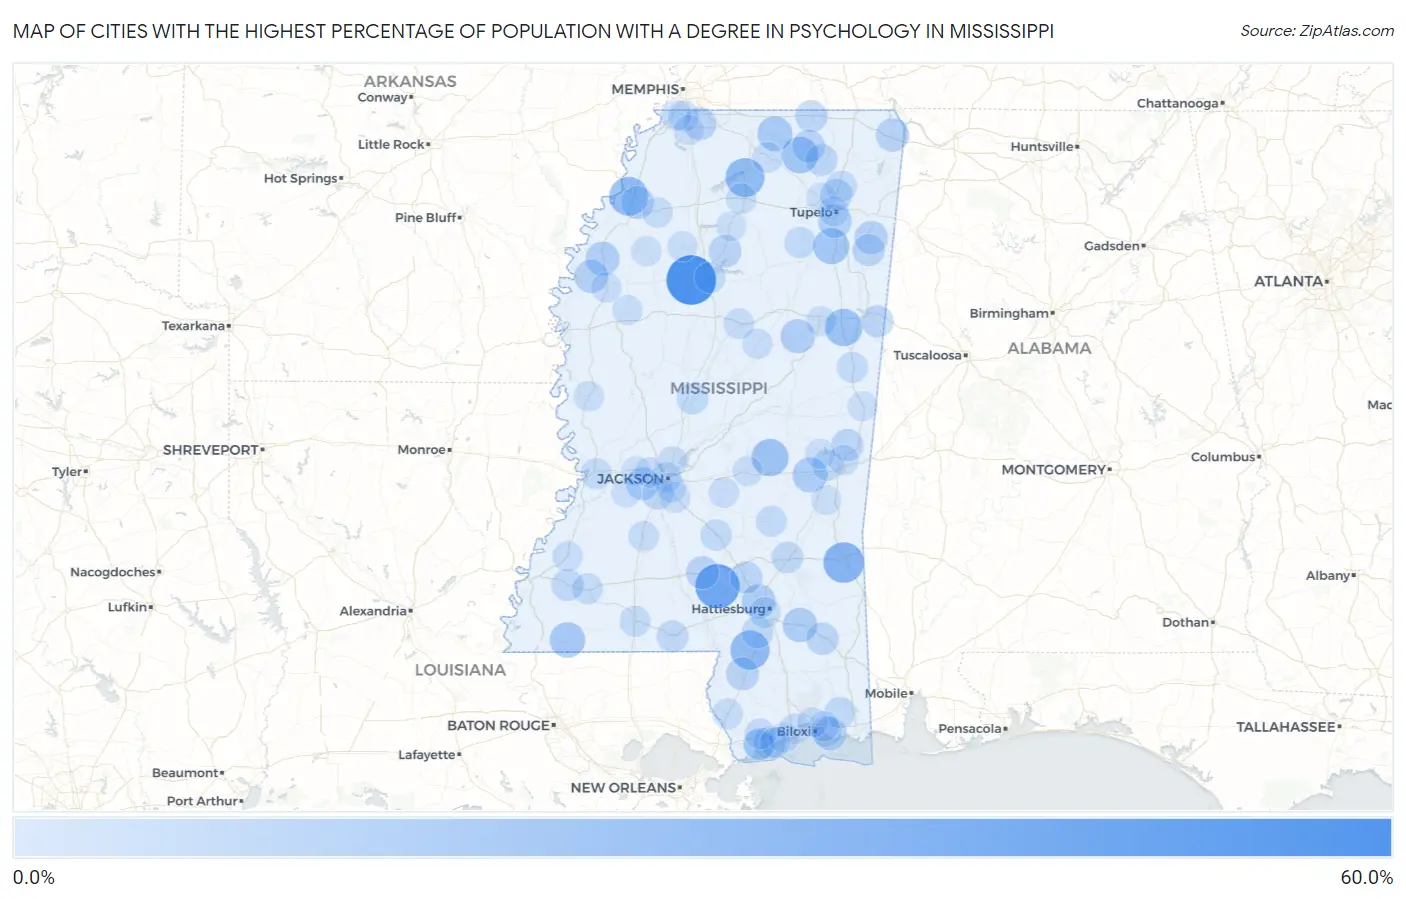
Map of Cities with the Highest Percentage of Population with a Degree in Psychology in Mississippi
0.0%
60.0%
Cities with the Highest Percentage of Population with a Degree in Psychology in Mississippi
| City | % Graduates | vs State | vs National | |
| 1. | Holcomb | 55.6% | 4.2%(+51.4)#1 | 5.1%(+50.5)#133 |
| 2. | Wheeler | 47.3% | 4.2%(+43.2)#2 | 5.1%(+42.3)#223 |
| 3. | Bassfield | 41.4% | 4.2%(+37.2)#3 | 5.1%(+36.3)#289 |
| 4. | Waynesboro | 31.6% | 4.2%(+27.5)#4 | 5.1%(+26.6)#460 |
| 5. | Lumberton | 27.6% | 4.2%(+23.4)#5 | 5.1%(+22.6)#577 |
| 6. | Abbeville | 27.3% | 4.2%(+23.1)#6 | 5.1%(+22.2)#587 |
| 7. | Coahoma | 26.7% | 4.2%(+22.5)#7 | 5.1%(+21.6)#615 |
| 8. | Artesia | 23.1% | 4.2%(+18.9)#8 | 5.1%(+18.0)#808 |
| 9. | Conehatta | 22.1% | 4.2%(+17.9)#9 | 5.1%(+17.1)#876 |
| 10. | Blue Mountain | 20.8% | 4.2%(+16.6)#10 | 5.1%(+15.7)#978 |
| 11. | Rena Lara | 20.4% | 4.2%(+16.2)#11 | 5.1%(+15.4)#1,005 |
| 12. | Okolona | 19.3% | 4.2%(+15.2)#12 | 5.1%(+14.3)#1,120 |
| 13. | Centreville | 17.8% | 4.2%(+13.6)#13 | 5.1%(+12.7)#1,290 |
| 14. | Snow Lake Shores | 16.9% | 4.2%(+12.7)#14 | 5.1%(+11.8)#1,385 |
| 15. | Chunky | 16.7% | 4.2%(+12.5)#15 | 5.1%(+11.6)#1,427 |
| 16. | New Augusta | 15.4% | 4.2%(+11.2)#16 | 5.1%(+10.3)#1,622 |
| 17. | Rawls Springs | 14.4% | 4.2%(+10.2)#17 | 5.1%(+9.37)#1,802 |
| 18. | Sturgis | 14.3% | 4.2%(+10.1)#18 | 5.1%(+9.23)#1,848 |
| 19. | Winstonville | 14.3% | 4.2%(+10.1)#19 | 5.1%(+9.23)#1,858 |
| 20. | Verona | 13.3% | 4.2%(+9.16)#20 | 5.1%(+8.28)#2,035 |
| 21. | Pace | 13.0% | 4.2%(+8.87)#21 | 5.1%(+7.99)#2,133 |
| 22. | Smithville | 12.5% | 4.2%(+8.33)#22 | 5.1%(+7.45)#2,258 |
| 23. | Iuka | 12.4% | 4.2%(+8.26)#23 | 5.1%(+7.38)#2,309 |
| 24. | Gulf Park Estates | 12.0% | 4.2%(+7.81)#24 | 5.1%(+6.93)#2,464 |
| 25. | Raymond | 11.6% | 4.2%(+7.40)#25 | 5.1%(+6.53)#2,607 |
| 26. | Prentiss | 11.4% | 4.2%(+7.25)#26 | 5.1%(+6.38)#2,673 |
| 27. | Jonestown | 11.4% | 4.2%(+7.25)#27 | 5.1%(+6.38)#2,674 |
| 28. | Poplarville | 11.4% | 4.2%(+7.22)#28 | 5.1%(+6.34)#2,687 |
| 29. | Bridgetown | 11.4% | 4.2%(+7.20)#29 | 5.1%(+6.32)#2,695 |
| 30. | Coffeeville | 10.9% | 4.2%(+6.76)#30 | 5.1%(+5.89)#2,875 |
| 31. | Ripley | 10.8% | 4.2%(+6.66)#31 | 5.1%(+5.78)#2,918 |
| 32. | Mclain | 10.3% | 4.2%(+6.17)#32 | 5.1%(+5.29)#3,172 |
| 33. | Henderson Point | 10.3% | 4.2%(+6.17)#33 | 5.1%(+5.29)#3,177 |
| 34. | Seminary | 10.0% | 4.2%(+5.83)#34 | 5.1%(+4.95)#3,375 |
| 35. | Meridian Station | 9.8% | 4.2%(+5.66)#35 | 5.1%(+4.78)#3,470 |
| 36. | Hatley | 9.7% | 4.2%(+5.50)#36 | 5.1%(+4.63)#3,549 |
| 37. | Saltillo | 9.5% | 4.2%(+5.30)#37 | 5.1%(+4.42)#3,672 |
| 38. | Dumas | 9.4% | 4.2%(+5.20)#38 | 5.1%(+4.32)#3,741 |
| 39. | New Hope | 9.3% | 4.2%(+5.17)#39 | 5.1%(+4.30)#3,756 |
| 40. | Walnut | 9.3% | 4.2%(+5.08)#40 | 5.1%(+4.21)#3,822 |
| 41. | Bay St Louis | 8.8% | 4.2%(+4.65)#41 | 5.1%(+3.77)#4,142 |
| 42. | Roxie | 8.8% | 4.2%(+4.60)#42 | 5.1%(+3.72)#4,192 |
| 43. | Purvis | 8.6% | 4.2%(+4.39)#43 | 5.1%(+3.51)#4,365 |
| 44. | Laurel | 8.4% | 4.2%(+4.27)#44 | 5.1%(+3.39)#4,448 |
| 45. | Tylertown | 8.4% | 4.2%(+4.18)#45 | 5.1%(+3.31)#4,528 |
| 46. | Byram | 8.3% | 4.2%(+4.17)#46 | 5.1%(+3.29)#4,533 |
| 47. | New Houlka | 7.7% | 4.2%(+3.52)#47 | 5.1%(+2.64)#5,177 |
| 48. | Pickens | 7.6% | 4.2%(+3.42)#48 | 5.1%(+2.54)#5,282 |
| 49. | Magee | 7.4% | 4.2%(+3.26)#49 | 5.1%(+2.38)#5,460 |
| 50. | Vancleave | 7.4% | 4.2%(+3.23)#50 | 5.1%(+2.35)#5,514 |
| 51. | Waveland | 7.4% | 4.2%(+3.22)#51 | 5.1%(+2.34)#5,523 |
| 52. | Nellieburg | 7.4% | 4.2%(+3.20)#52 | 5.1%(+2.33)#5,546 |
| 53. | Guntown | 7.2% | 4.2%(+3.03)#53 | 5.1%(+2.15)#5,742 |
| 54. | Hattiesburg | 7.1% | 4.2%(+2.93)#54 | 5.1%(+2.06)#5,892 |
| 55. | Grenada | 6.9% | 4.2%(+2.70)#55 | 5.1%(+1.83)#6,212 |
| 56. | Meadville | 6.8% | 4.2%(+2.62)#56 | 5.1%(+1.74)#6,328 |
| 57. | Macon | 6.8% | 4.2%(+2.58)#57 | 5.1%(+1.71)#6,388 |
| 58. | Horn Lake | 6.6% | 4.2%(+2.47)#58 | 5.1%(+1.60)#6,570 |
| 59. | Bay Springs | 6.6% | 4.2%(+2.40)#59 | 5.1%(+1.53)#6,657 |
| 60. | Mccomb | 6.6% | 4.2%(+2.39)#60 | 5.1%(+1.51)#6,684 |
| 61. | Beechwood | 6.5% | 4.2%(+2.37)#61 | 5.1%(+1.49)#6,718 |
| 62. | Lynchburg | 6.2% | 4.2%(+1.99)#62 | 5.1%(+1.12)#7,394 |
| 63. | Ocean Springs | 6.1% | 4.2%(+1.97)#63 | 5.1%(+1.10)#7,438 |
| 64. | Hazlehurst | 6.1% | 4.2%(+1.93)#64 | 5.1%(+1.06)#7,516 |
| 65. | Diamondhead | 6.1% | 4.2%(+1.90)#65 | 5.1%(+1.02)#7,575 |
| 66. | Potts Camp | 6.1% | 4.2%(+1.89)#66 | 5.1%(+1.01)#7,603 |
| 67. | Picayune | 5.9% | 4.2%(+1.74)#67 | 5.1%(+0.864)#7,874 |
| 68. | Oxford | 5.9% | 4.2%(+1.71)#68 | 5.1%(+0.831)#7,924 |
| 69. | Kilmichael | 5.9% | 4.2%(+1.71)#69 | 5.1%(+0.831)#7,940 |
| 70. | Gulf Hills | 5.8% | 4.2%(+1.59)#70 | 5.1%(+0.712)#8,194 |
| 71. | Marks | 5.6% | 4.2%(+1.47)#71 | 5.1%(+0.594)#8,435 |
| 72. | Florence | 5.6% | 4.2%(+1.43)#72 | 5.1%(+0.554)#8,518 |
| 73. | Polkville | 5.6% | 4.2%(+1.38)#73 | 5.1%(+0.504)#8,615 |
| 74. | Gulfport | 5.5% | 4.2%(+1.34)#74 | 5.1%(+0.467)#8,699 |
| 75. | Fayette | 5.4% | 4.2%(+1.25)#75 | 5.1%(+0.371)#8,915 |
| 76. | Long Beach | 5.3% | 4.2%(+1.15)#76 | 5.1%(+0.278)#9,126 |
| 77. | French Camp | 5.3% | 4.2%(+1.09)#77 | 5.1%(+0.212)#9,302 |
| 78. | Boyle | 5.2% | 4.2%(+0.990)#78 | 5.1%(+0.113)#9,528 |
| 79. | Forest | 5.0% | 4.2%(+0.836)#79 | 5.1%(-0.041)#9,884 |
| 80. | Rolling Fork | 5.0% | 4.2%(+0.826)#80 | 5.1%(-0.051)#9,903 |
| 81. | Marion | 5.0% | 4.2%(+0.811)#81 | 5.1%(-0.066)#9,972 |
| 82. | Jackson | 4.9% | 4.2%(+0.772)#82 | 5.1%(-0.105)#10,053 |
| 83. | Ridgeland | 4.9% | 4.2%(+0.765)#83 | 5.1%(-0.111)#10,064 |
| 84. | Starkville | 4.9% | 4.2%(+0.757)#84 | 5.1%(-0.120)#10,090 |
| 85. | Charleston | 4.9% | 4.2%(+0.725)#85 | 5.1%(-0.152)#10,174 |
| 86. | Clinton | 4.9% | 4.2%(+0.687)#86 | 5.1%(-0.190)#10,256 |
| 87. | Tupelo | 4.9% | 4.2%(+0.684)#87 | 5.1%(-0.192)#10,267 |
| 88. | Sunflower | 4.8% | 4.2%(+0.620)#88 | 5.1%(-0.257)#10,431 |
| 89. | D Iberville | 4.8% | 4.2%(+0.614)#89 | 5.1%(-0.263)#10,448 |
| 90. | Sumner | 4.8% | 4.2%(+0.588)#90 | 5.1%(-0.289)#10,514 |
| 91. | Collinsville | 4.7% | 4.2%(+0.552)#91 | 5.1%(-0.325)#10,608 |
| 92. | Bolton | 4.7% | 4.2%(+0.504)#92 | 5.1%(-0.373)#10,734 |
| 93. | Hernando | 4.7% | 4.2%(+0.503)#93 | 5.1%(-0.374)#10,737 |
| 94. | Richland | 4.6% | 4.2%(+0.460)#94 | 5.1%(-0.417)#10,842 |
| 95. | Pass Christian | 4.6% | 4.2%(+0.443)#95 | 5.1%(-0.434)#10,877 |
| 96. | Scooba | 4.5% | 4.2%(+0.371)#96 | 5.1%(-0.506)#11,045 |
| 97. | Learned | 4.5% | 4.2%(+0.371)#97 | 5.1%(-0.506)#11,077 |
| 98. | Stonewall | 4.4% | 4.2%(+0.237)#98 | 5.1%(-0.639)#11,345 |
| 99. | Water Valley | 4.4% | 4.2%(+0.212)#99 | 5.1%(-0.665)#11,409 |
| 100. | Sherman | 4.3% | 4.2%(+0.174)#100 | 5.1%(-0.703)#11,506 |
Common Questions
What are the Top 10 Cities with the Highest Percentage of Population with a Degree in Psychology in Mississippi?
Top 10 Cities with the Highest Percentage of Population with a Degree in Psychology in Mississippi are:
#1
55.6%
#2
41.4%
#3
31.6%
#4
27.6%
#5
27.3%
#6
26.7%
#7
23.1%
#8
22.1%
#9
20.8%
#10
19.3%
What city has the Highest Percentage of Population with a Degree in Psychology in Mississippi?
Holcomb has the Highest Percentage of Population with a Degree in Psychology in Mississippi with 55.6%.
What is the Percentage of Population with a Degree in Psychology in the State of Mississippi?
Percentage of Population with a Degree in Psychology in Mississippi is 4.2%.
What is the Percentage of Population with a Degree in Psychology in the United States?
Percentage of Population with a Degree in Psychology in the United States is 5.1%.