Cities with the Highest Percentage of Population with a Degree in Psychology in Connecticut
RELATED REPORTS & OPTIONS
Psychology
Connecticut
Compare Cities
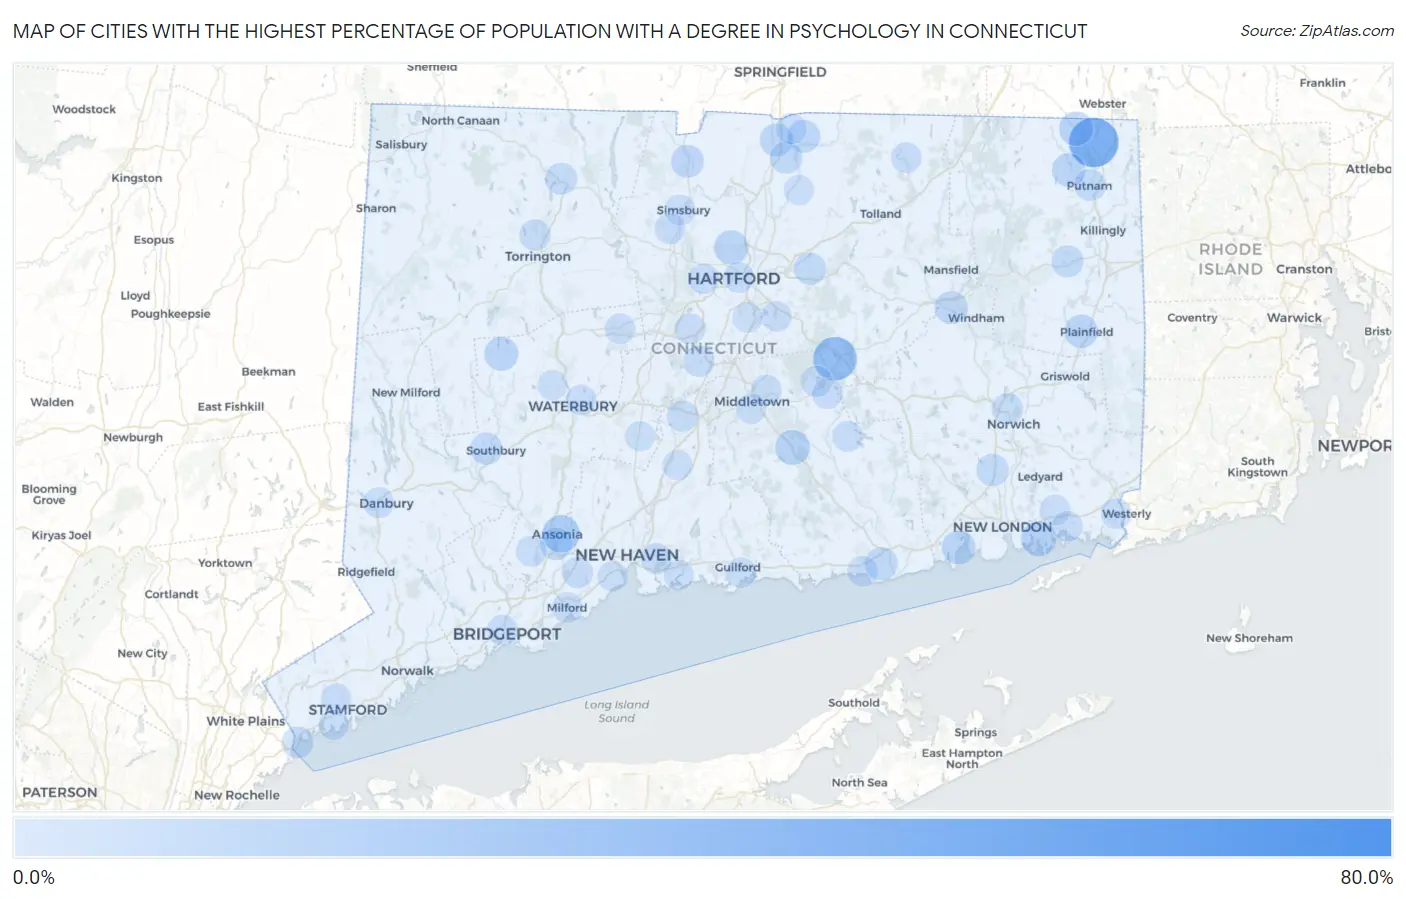
Map of Cities with the Highest Percentage of Population with a Degree in Psychology in Connecticut
0.0%
80.0%
Cities with the Highest Percentage of Population with a Degree in Psychology in Connecticut
| City | % Graduates | vs State | vs National | |
| 1. | Sherman | 66.7% | 5.9%(+60.7)#1 | 5.1%(+61.6)#93 |
| 2. | North Grosvenor Dale | 42.1% | 5.9%(+36.2)#2 | 5.1%(+37.1)#274 |
| 3. | Mechanicsville | 40.7% | 5.9%(+34.8)#3 | 5.1%(+35.7)#295 |
| 4. | Terramuggus | 30.6% | 5.9%(+24.7)#4 | 5.1%(+25.6)#482 |
| 5. | Dayville | 20.0% | 5.9%(+14.1)#5 | 5.1%(+14.9)#1,043 |
| 6. | Ansonia | 18.9% | 5.9%(+12.9)#6 | 5.1%(+13.8)#1,165 |
| 7. | Bantam Borough | 18.2% | 5.9%(+12.2)#7 | 5.1%(+13.1)#1,230 |
| 8. | Candlewood Lake Club | 16.3% | 5.9%(+10.3)#8 | 5.1%(+11.2)#1,490 |
| 9. | Lakeside Woods | 15.4% | 5.9%(+9.41)#9 | 5.1%(+10.3)#1,642 |
| 10. | Poquonock Bridge | 14.6% | 5.9%(+8.68)#10 | 5.1%(+9.57)#1,762 |
| 11. | Route 7 Gateway | 14.5% | 5.9%(+8.50)#11 | 5.1%(+9.40)#1,798 |
| 12. | Higganum | 14.3% | 5.9%(+8.37)#12 | 5.1%(+9.27)#1,810 |
| 13. | Quinebaug | 13.2% | 5.9%(+7.30)#13 | 5.1%(+8.19)#2,083 |
| 14. | Blue Hills | 13.0% | 5.9%(+7.01)#14 | 5.1%(+7.90)#2,145 |
| 15. | Lordship | 12.7% | 5.9%(+6.77)#15 | 5.1%(+7.67)#2,202 |
| 16. | Bethlehem Village | 12.3% | 5.9%(+6.37)#16 | 5.1%(+7.27)#2,337 |
| 17. | Niantic | 12.2% | 5.9%(+6.26)#17 | 5.1%(+7.16)#2,374 |
| 18. | Hawleyville | 12.0% | 5.9%(+6.05)#18 | 5.1%(+6.95)#2,460 |
| 19. | South Woodstock | 11.8% | 5.9%(+5.85)#19 | 5.1%(+6.75)#2,531 |
| 20. | Plainfield Village | 11.5% | 5.9%(+5.55)#20 | 5.1%(+6.45)#2,644 |
| 21. | Candlewood Orchards | 11.0% | 5.9%(+5.01)#21 | 5.1%(+5.90)#2,868 |
| 22. | Willimantic | 10.8% | 5.9%(+4.89)#22 | 5.1%(+5.78)#2,919 |
| 23. | Thompsonville | 10.7% | 5.9%(+4.71)#23 | 5.1%(+5.61)#2,991 |
| 24. | Hazardville | 10.6% | 5.9%(+4.70)#24 | 5.1%(+5.59)#2,995 |
| 25. | Old Saybrook Center | 10.5% | 5.9%(+4.60)#25 | 5.1%(+5.50)#3,044 |
| 26. | Salmon Brook | 10.3% | 5.9%(+4.38)#26 | 5.1%(+5.28)#3,185 |
| 27. | Southwood Acres | 9.8% | 5.9%(+3.86)#27 | 5.1%(+4.76)#3,483 |
| 28. | Derby | 9.8% | 5.9%(+3.85)#28 | 5.1%(+4.74)#3,495 |
| 29. | Old Hill | 9.6% | 5.9%(+3.66)#29 | 5.1%(+4.56)#3,585 |
| 30. | Woodmont Borough | 9.6% | 5.9%(+3.64)#30 | 5.1%(+4.54)#3,598 |
| 31. | Danielson Borough | 9.6% | 5.9%(+3.63)#31 | 5.1%(+4.53)#3,606 |
| 32. | Oxoboxo River | 9.6% | 5.9%(+3.62)#32 | 5.1%(+4.52)#3,609 |
| 33. | Naugatuck Borough | 9.4% | 5.9%(+3.49)#33 | 5.1%(+4.39)#3,695 |
| 34. | Heritage Village | 9.4% | 5.9%(+3.42)#34 | 5.1%(+4.31)#3,745 |
| 35. | Manchester | 9.1% | 5.9%(+3.15)#35 | 5.1%(+4.05)#3,918 |
| 36. | Brooklyn | 9.1% | 5.9%(+3.14)#36 | 5.1%(+4.04)#3,937 |
| 37. | Darien Downtown | 9.1% | 5.9%(+3.11)#37 | 5.1%(+4.01)#3,990 |
| 38. | Taylor Corners | 9.0% | 5.9%(+3.05)#38 | 5.1%(+3.95)#4,026 |
| 39. | Winsted | 8.8% | 5.9%(+2.88)#39 | 5.1%(+3.78)#4,140 |
| 40. | Putnam | 8.5% | 5.9%(+2.57)#40 | 5.1%(+3.47)#4,391 |
| 41. | Ball Pond | 8.5% | 5.9%(+2.56)#41 | 5.1%(+3.46)#4,407 |
| 42. | Quasset Lake | 8.3% | 5.9%(+2.39)#42 | 5.1%(+3.28)#4,577 |
| 43. | Byram | 8.3% | 5.9%(+2.31)#43 | 5.1%(+3.20)#4,653 |
| 44. | Westport | 8.1% | 5.9%(+2.15)#44 | 5.1%(+3.05)#4,777 |
| 45. | Greens Farms | 7.9% | 5.9%(+1.99)#45 | 5.1%(+2.89)#4,932 |
| 46. | Meriden | 7.8% | 5.9%(+1.86)#46 | 5.1%(+2.76)#5,060 |
| 47. | Norwich | 7.7% | 5.9%(+1.73)#47 | 5.1%(+2.62)#5,222 |
| 48. | Torrington | 7.6% | 5.9%(+1.69)#48 | 5.1%(+2.59)#5,240 |
| 49. | South Wilton | 7.5% | 5.9%(+1.53)#49 | 5.1%(+2.43)#5,409 |
| 50. | Lake Pocotopaug | 7.4% | 5.9%(+1.45)#50 | 5.1%(+2.34)#5,519 |
| 51. | Orange | 7.4% | 5.9%(+1.43)#51 | 5.1%(+2.33)#5,540 |
| 52. | Bigelow Corners | 7.3% | 5.9%(+1.38)#52 | 5.1%(+2.27)#5,607 |
| 53. | Kensington | 7.3% | 5.9%(+1.32)#53 | 5.1%(+2.22)#5,671 |
| 54. | Cornwall | 7.1% | 5.9%(+1.19)#54 | 5.1%(+2.09)#5,870 |
| 55. | East Haven | 7.0% | 5.9%(+1.07)#55 | 5.1%(+1.97)#6,010 |
| 56. | Inglenook | 6.9% | 5.9%(+0.991)#56 | 5.1%(+1.89)#6,130 |
| 57. | Rock Ridge | 6.9% | 5.9%(+0.919)#57 | 5.1%(+1.82)#6,229 |
| 58. | New Britain | 6.8% | 5.9%(+0.835)#58 | 5.1%(+1.73)#6,347 |
| 59. | Moodus | 6.7% | 5.9%(+0.732)#59 | 5.1%(+1.63)#6,480 |
| 60. | Bridgeport | 6.7% | 5.9%(+0.717)#60 | 5.1%(+1.61)#6,550 |
| 61. | Sherwood Manor | 6.6% | 5.9%(+0.698)#61 | 5.1%(+1.59)#6,574 |
| 62. | Portland | 6.6% | 5.9%(+0.667)#62 | 5.1%(+1.56)#6,601 |
| 63. | Danbury | 6.6% | 5.9%(+0.661)#63 | 5.1%(+1.56)#6,611 |
| 64. | Hartford | 6.6% | 5.9%(+0.636)#64 | 5.1%(+1.53)#6,652 |
| 65. | Lakes West | 6.5% | 5.9%(+0.598)#65 | 5.1%(+1.49)#6,715 |
| 66. | Weatogue | 6.5% | 5.9%(+0.572)#66 | 5.1%(+1.47)#6,761 |
| 67. | Simsbury Center | 6.5% | 5.9%(+0.554)#67 | 5.1%(+1.45)#6,789 |
| 68. | Coleytown | 6.5% | 5.9%(+0.541)#68 | 5.1%(+1.44)#6,817 |
| 69. | Pawcatuck | 6.4% | 5.9%(+0.498)#69 | 5.1%(+1.39)#6,904 |
| 70. | Northford | 6.4% | 5.9%(+0.489)#70 | 5.1%(+1.39)#6,921 |
| 71. | Saybrook Manor | 6.4% | 5.9%(+0.482)#71 | 5.1%(+1.38)#6,928 |
| 72. | East Hampton | 6.4% | 5.9%(+0.468)#72 | 5.1%(+1.37)#6,950 |
| 73. | Saugatuck | 6.4% | 5.9%(+0.434)#73 | 5.1%(+1.33)#7,011 |
| 74. | Old Mystic | 6.3% | 5.9%(+0.401)#74 | 5.1%(+1.30)#7,056 |
| 75. | Stafford Springs | 6.3% | 5.9%(+0.382)#75 | 5.1%(+1.28)#7,086 |
| 76. | Glastonbury Center | 6.3% | 5.9%(+0.378)#76 | 5.1%(+1.28)#7,095 |
| 77. | West Hartford | 6.3% | 5.9%(+0.342)#77 | 5.1%(+1.24)#7,151 |
| 78. | Milford City Balance | 6.3% | 5.9%(+0.334)#78 | 5.1%(+1.23)#7,164 |
| 79. | Newtown Borough | 6.1% | 5.9%(+0.183)#79 | 5.1%(+1.08)#7,465 |
| 80. | Shelton | 6.1% | 5.9%(+0.182)#80 | 5.1%(+1.08)#7,467 |
| 81. | Stamford | 6.1% | 5.9%(+0.147)#81 | 5.1%(+1.04)#7,535 |
| 82. | Tashua | 6.1% | 5.9%(+0.130)#82 | 5.1%(+1.03)#7,567 |
| 83. | Bristol | 6.1% | 5.9%(+0.116)#83 | 5.1%(+1.01)#7,589 |
| 84. | Mystic | 6.0% | 5.9%(+0.100)#84 | 5.1%(+0.997)#7,627 |
| 85. | Waterbury | 6.0% | 5.9%(+0.092)#85 | 5.1%(+0.989)#7,643 |
| 86. | Mill Plain | 5.9% | 5.9%(-0.040)#86 | 5.1%(+0.857)#7,885 |
| 87. | Wallingford Center | 5.9% | 5.9%(-0.073)#87 | 5.1%(+0.824)#7,982 |
| 88. | West Haven | 5.8% | 5.9%(-0.114)#88 | 5.1%(+0.783)#8,034 |
| 89. | Sandy Hook | 5.7% | 5.9%(-0.261)#89 | 5.1%(+0.636)#8,367 |
| 90. | Middletown | 5.7% | 5.9%(-0.272)#90 | 5.1%(+0.625)#8,385 |
| 91. | Oakville | 5.7% | 5.9%(-0.292)#91 | 5.1%(+0.605)#8,420 |
| 92. | Wethersfield | 5.6% | 5.9%(-0.340)#92 | 5.1%(+0.557)#8,508 |
| 93. | Old Greenwich | 5.6% | 5.9%(-0.393)#93 | 5.1%(+0.504)#8,593 |
| 94. | Branford Center | 5.6% | 5.9%(-0.393)#94 | 5.1%(+0.504)#8,594 |
| 95. | Trumbull Center | 5.5% | 5.9%(-0.408)#95 | 5.1%(+0.489)#8,666 |
| 96. | Cheshire Village | 5.5% | 5.9%(-0.441)#96 | 5.1%(+0.456)#8,726 |
| 97. | Plattsville | 5.5% | 5.9%(-0.465)#97 | 5.1%(+0.432)#8,771 |
| 98. | Broad Brook | 5.4% | 5.9%(-0.502)#98 | 5.1%(+0.395)#8,861 |
| 99. | East | 5.4% | 5.9%(-0.515)#99 | 5.1%(+0.382)#8,894 |
| 100. | Guilford Center | 5.4% | 5.9%(-0.575)#100 | 5.1%(+0.323)#9,024 |
Common Questions
What are the Top 10 Cities with the Highest Percentage of Population with a Degree in Psychology in Connecticut?
Top 10 Cities with the Highest Percentage of Population with a Degree in Psychology in Connecticut are:
#1
42.1%
#2
30.6%
#3
18.9%
#4
14.6%
#5
14.3%
#6
13.2%
#7
13.0%
#8
12.3%
#9
12.2%
#10
11.8%
What city has the Highest Percentage of Population with a Degree in Psychology in Connecticut?
North Grosvenor Dale has the Highest Percentage of Population with a Degree in Psychology in Connecticut with 42.1%.
What is the Percentage of Population with a Degree in Psychology in the State of Connecticut?
Percentage of Population with a Degree in Psychology in Connecticut is 5.9%.
What is the Percentage of Population with a Degree in Psychology in the United States?
Percentage of Population with a Degree in Psychology in the United States is 5.1%.