Cities with the Highest Percentage of Population with a Degree in Psychology in Louisiana
RELATED REPORTS & OPTIONS
Psychology
Louisiana
Compare Cities
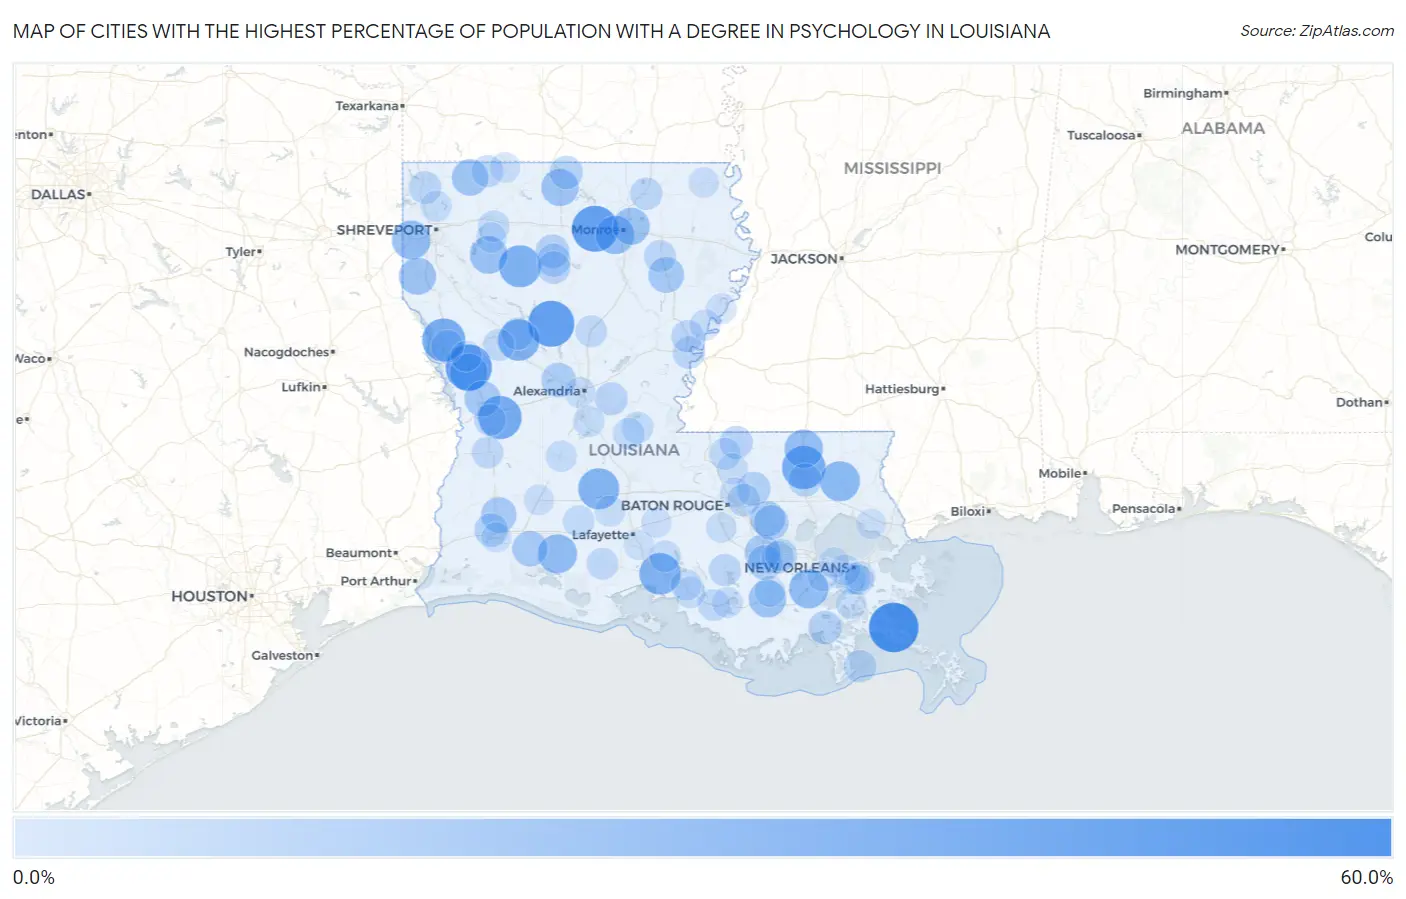
Map of Cities with the Highest Percentage of Population with a Degree in Psychology in Louisiana
0.0%
60.0%
Cities with the Highest Percentage of Population with a Degree in Psychology in Louisiana
| City | % Graduates | vs State | vs National | |
| 1. | Port Sulphur | 59.6% | 4.6%(+55.0)#1 | 5.1%(+54.6)#118 |
| 2. | Fisher | 50.0% | 4.6%(+45.4)#2 | 5.1%(+44.9)#174 |
| 3. | Calhoun | 50.0% | 4.6%(+45.4)#3 | 5.1%(+44.9)#175 |
| 4. | Atlanta | 50.0% | 4.6%(+45.4)#4 | 5.1%(+44.9)#179 |
| 5. | Fort Polk North | 42.2% | 4.6%(+37.5)#5 | 5.1%(+37.1)#273 |
| 6. | Amite City | 42.1% | 4.6%(+37.4)#6 | 5.1%(+37.0)#275 |
| 7. | Noble | 41.7% | 4.6%(+37.0)#7 | 5.1%(+36.6)#283 |
| 8. | Lucky | 38.5% | 4.6%(+33.8)#8 | 5.1%(+33.4)#333 |
| 9. | Lydia | 37.2% | 4.6%(+32.6)#9 | 5.1%(+32.2)#351 |
| 10. | Point Place | 36.9% | 4.6%(+32.3)#10 | 5.1%(+31.9)#355 |
| 11. | Chataignier | 35.7% | 4.6%(+31.1)#11 | 5.1%(+30.7)#375 |
| 12. | Folsom | 32.6% | 4.6%(+28.0)#12 | 5.1%(+27.6)#441 |
| 13. | Des Allemands | 30.5% | 4.6%(+25.8)#13 | 5.1%(+25.4)#485 |
| 14. | Lake Arthur | 30.2% | 4.6%(+25.6)#14 | 5.1%(+25.2)#490 |
| 15. | Greenwood | 29.0% | 4.6%(+24.3)#15 | 5.1%(+23.9)#520 |
| 16. | Bawcomville | 28.8% | 4.6%(+24.1)#16 | 5.1%(+23.7)#523 |
| 17. | Tangipahoa | 28.6% | 4.6%(+23.9)#17 | 5.1%(+23.5)#528 |
| 18. | Florien | 27.0% | 4.6%(+22.4)#18 | 5.1%(+22.0)#597 |
| 19. | Ringgold | 26.3% | 4.6%(+21.7)#19 | 5.1%(+21.3)#624 |
| 20. | Schriever | 26.0% | 4.6%(+21.3)#20 | 5.1%(+20.9)#647 |
| 21. | Bernice | 25.0% | 4.6%(+20.4)#21 | 5.1%(+19.9)#677 |
| 22. | Keachi | 25.0% | 4.6%(+20.4)#22 | 5.1%(+19.9)#699 |
| 23. | Lakeshore | 24.4% | 4.6%(+19.8)#23 | 5.1%(+19.4)#738 |
| 24. | Sarepta | 22.9% | 4.6%(+18.3)#24 | 5.1%(+17.9)#818 |
| 25. | Anacoco | 21.1% | 4.6%(+16.4)#25 | 5.1%(+16.0)#950 |
| 26. | Winnsboro | 20.9% | 4.6%(+16.3)#26 | 5.1%(+15.9)#964 |
| 27. | Gillis | 20.5% | 4.6%(+15.9)#27 | 5.1%(+15.5)#994 |
| 28. | Union | 20.4% | 4.6%(+15.8)#28 | 5.1%(+15.4)#1,003 |
| 29. | Hayes | 20.0% | 4.6%(+15.4)#29 | 5.1%(+14.9)#1,035 |
| 30. | Port Vincent | 19.4% | 4.6%(+14.7)#30 | 5.1%(+14.3)#1,116 |
| 31. | St James | 18.7% | 4.6%(+14.0)#31 | 5.1%(+13.6)#1,183 |
| 32. | French Settlement | 18.6% | 4.6%(+13.9)#32 | 5.1%(+13.5)#1,196 |
| 33. | Boyce | 17.7% | 4.6%(+13.1)#33 | 5.1%(+12.7)#1,292 |
| 34. | Watson | 15.9% | 4.6%(+11.2)#34 | 5.1%(+10.8)#1,548 |
| 35. | Westlake | 15.4% | 4.6%(+10.8)#35 | 5.1%(+10.4)#1,611 |
| 36. | Quitman | 15.4% | 4.6%(+10.7)#36 | 5.1%(+10.3)#1,625 |
| 37. | Cut Off | 14.6% | 4.6%(+10.0)#37 | 5.1%(+9.60)#1,749 |
| 38. | Independence | 14.3% | 4.6%(+9.64)#38 | 5.1%(+9.23)#1,811 |
| 39. | North Hodge | 14.3% | 4.6%(+9.64)#39 | 5.1%(+9.23)#1,821 |
| 40. | Spearsville | 14.3% | 4.6%(+9.64)#40 | 5.1%(+9.23)#1,849 |
| 41. | New Orleans Station | 14.0% | 4.6%(+9.38)#41 | 5.1%(+8.97)#1,898 |
| 42. | Wilson | 13.8% | 4.6%(+9.15)#42 | 5.1%(+8.74)#1,941 |
| 43. | Center Point | 13.6% | 4.6%(+8.99)#43 | 5.1%(+8.59)#1,974 |
| 44. | Jonesboro | 13.4% | 4.6%(+8.74)#44 | 5.1%(+8.33)#2,030 |
| 45. | Monticello | 12.6% | 4.6%(+7.99)#45 | 5.1%(+7.59)#2,225 |
| 46. | Zwolle | 12.5% | 4.6%(+7.85)#46 | 5.1%(+7.45)#2,253 |
| 47. | Gilliam | 12.5% | 4.6%(+7.85)#47 | 5.1%(+7.45)#2,290 |
| 48. | Grand Isle | 12.2% | 4.6%(+7.57)#48 | 5.1%(+7.16)#2,372 |
| 49. | Ridgecrest | 12.1% | 4.6%(+7.47)#49 | 5.1%(+7.07)#2,407 |
| 50. | Grand Point | 11.9% | 4.6%(+7.21)#50 | 5.1%(+6.81)#2,507 |
| 51. | Bastrop | 11.8% | 4.6%(+7.16)#51 | 5.1%(+6.76)#2,525 |
| 52. | Lutcher | 11.7% | 4.6%(+7.04)#52 | 5.1%(+6.64)#2,572 |
| 53. | Clayton | 11.5% | 4.6%(+6.89)#53 | 5.1%(+6.49)#2,634 |
| 54. | Vienna Bend | 11.4% | 4.6%(+6.78)#54 | 5.1%(+6.38)#2,672 |
| 55. | Pierre Part | 11.4% | 4.6%(+6.72)#55 | 5.1%(+6.31)#2,698 |
| 56. | Mangham | 11.3% | 4.6%(+6.62)#56 | 5.1%(+6.22)#2,733 |
| 57. | Shongaloo | 11.1% | 4.6%(+6.46)#57 | 5.1%(+6.06)#2,826 |
| 58. | Jackson | 10.6% | 4.6%(+5.96)#58 | 5.1%(+5.55)#3,013 |
| 59. | Georgetown | 10.5% | 4.6%(+5.88)#59 | 5.1%(+5.48)#3,073 |
| 60. | Deridder | 10.4% | 4.6%(+5.79)#60 | 5.1%(+5.38)#3,121 |
| 61. | New Llano | 10.4% | 4.6%(+5.73)#61 | 5.1%(+5.32)#3,151 |
| 62. | Provencal | 10.3% | 4.6%(+5.70)#62 | 5.1%(+5.29)#3,175 |
| 63. | Patterson | 10.2% | 4.6%(+5.52)#63 | 5.1%(+5.11)#3,276 |
| 64. | Kaplan | 10.1% | 4.6%(+5.49)#64 | 5.1%(+5.08)#3,290 |
| 65. | Moreauville | 10.0% | 4.6%(+5.35)#65 | 5.1%(+4.95)#3,355 |
| 66. | Dubberly | 10.0% | 4.6%(+5.35)#66 | 5.1%(+4.95)#3,373 |
| 67. | Cottonport | 9.9% | 4.6%(+5.23)#67 | 5.1%(+4.83)#3,449 |
| 68. | Loreauville | 9.8% | 4.6%(+5.14)#68 | 5.1%(+4.73)#3,501 |
| 69. | Iota | 9.7% | 4.6%(+5.01)#69 | 5.1%(+4.60)#3,563 |
| 70. | Marrero | 9.0% | 4.6%(+4.35)#70 | 5.1%(+3.95)#4,023 |
| 71. | Oakdale | 8.9% | 4.6%(+4.28)#71 | 5.1%(+3.88)#4,077 |
| 72. | Franklin | 8.8% | 4.6%(+4.17)#72 | 5.1%(+3.76)#4,162 |
| 73. | Lecompte | 8.7% | 4.6%(+4.05)#73 | 5.1%(+3.64)#4,247 |
| 74. | Benton | 8.6% | 4.6%(+3.96)#74 | 5.1%(+3.55)#4,333 |
| 75. | Baldwin | 8.5% | 4.6%(+3.83)#75 | 5.1%(+3.42)#4,425 |
| 76. | Harvey | 8.3% | 4.6%(+3.68)#76 | 5.1%(+3.28)#4,601 |
| 77. | Alexandria | 8.1% | 4.6%(+3.41)#77 | 5.1%(+3.01)#4,807 |
| 78. | Thibodaux | 7.9% | 4.6%(+3.27)#78 | 5.1%(+2.86)#4,956 |
| 79. | Waterproof | 7.8% | 4.6%(+3.17)#79 | 5.1%(+2.76)#5,054 |
| 80. | Church Point | 7.8% | 4.6%(+3.16)#80 | 5.1%(+2.75)#5,062 |
| 81. | Slaughter | 7.8% | 4.6%(+3.15)#81 | 5.1%(+2.74)#5,073 |
| 82. | Many | 7.6% | 4.6%(+2.92)#82 | 5.1%(+2.51)#5,309 |
| 83. | Morgan City | 7.4% | 4.6%(+2.79)#83 | 5.1%(+2.39)#5,458 |
| 84. | Plaquemine | 7.4% | 4.6%(+2.79)#84 | 5.1%(+2.38)#5,461 |
| 85. | Jefferson | 7.3% | 4.6%(+2.61)#85 | 5.1%(+2.21)#5,685 |
| 86. | Heflin | 7.1% | 4.6%(+2.50)#86 | 5.1%(+2.09)#5,858 |
| 87. | Haynesville | 7.1% | 4.6%(+2.44)#87 | 5.1%(+2.04)#5,922 |
| 88. | St Joseph | 7.1% | 4.6%(+2.41)#88 | 5.1%(+2.01)#5,963 |
| 89. | Kinder | 7.0% | 4.6%(+2.35)#89 | 5.1%(+1.94)#6,047 |
| 90. | Kenner | 7.0% | 4.6%(+2.33)#90 | 5.1%(+1.93)#6,057 |
| 91. | Oak Grove | 6.9% | 4.6%(+2.29)#91 | 5.1%(+1.89)#6,133 |
| 92. | Luling | 6.7% | 4.6%(+2.03)#92 | 5.1%(+1.63)#6,482 |
| 93. | Henderson | 6.7% | 4.6%(+2.02)#93 | 5.1%(+1.62)#6,504 |
| 94. | Lafitte | 6.6% | 4.6%(+1.93)#94 | 5.1%(+1.53)#6,662 |
| 95. | Timberlane | 6.5% | 4.6%(+1.87)#95 | 5.1%(+1.47)#6,764 |
| 96. | Broussard | 6.3% | 4.6%(+1.68)#96 | 5.1%(+1.28)#7,094 |
| 97. | Terrytown | 6.3% | 4.6%(+1.61)#97 | 5.1%(+1.20)#7,206 |
| 98. | Lake Charles | 6.2% | 4.6%(+1.57)#98 | 5.1%(+1.16)#7,317 |
| 99. | Lacombe | 6.2% | 4.6%(+1.51)#99 | 5.1%(+1.10)#7,429 |
| 100. | Brownfields | 6.1% | 4.6%(+1.41)#100 | 5.1%(+1.01)#7,594 |
Common Questions
What are the Top 10 Cities with the Highest Percentage of Population with a Degree in Psychology in Louisiana?
Top 10 Cities with the Highest Percentage of Population with a Degree in Psychology in Louisiana are:
#1
59.6%
#2
50.0%
#3
50.0%
#4
50.0%
#5
42.2%
#6
42.1%
#7
41.7%
#8
38.5%
#9
37.2%
#10
36.9%
What city has the Highest Percentage of Population with a Degree in Psychology in Louisiana?
Port Sulphur has the Highest Percentage of Population with a Degree in Psychology in Louisiana with 59.6%.
What is the Percentage of Population with a Degree in Psychology in the State of Louisiana?
Percentage of Population with a Degree in Psychology in Louisiana is 4.6%.
What is the Percentage of Population with a Degree in Psychology in the United States?
Percentage of Population with a Degree in Psychology in the United States is 5.1%.