Cities with the Highest Percentage of Population with a Degree in Psychology in Vermont
RELATED REPORTS & OPTIONS
Psychology
Vermont
Compare Cities
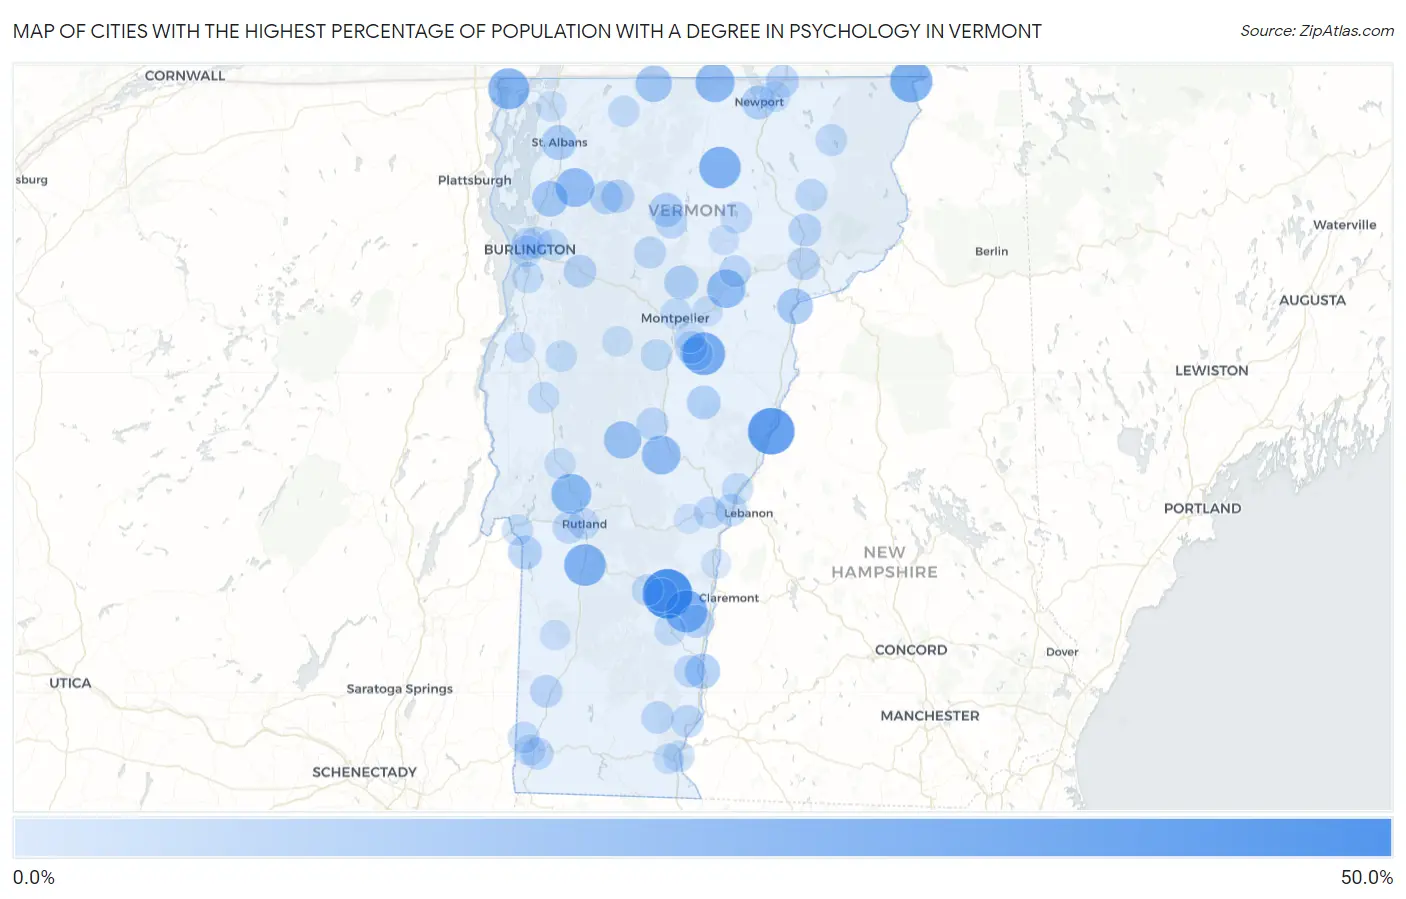
Map of Cities with the Highest Percentage of Population with a Degree in Psychology in Vermont
0.0%
50.0%
Cities with the Highest Percentage of Population with a Degree in Psychology in Vermont
| City | % Graduates | vs State | vs National | |
| 1. | Cavendish | 46.9% | 6.4%(+40.5)#1 | 5.1%(+41.8)#227 |
| 2. | Pownal Center | 40.2% | 6.4%(+33.7)#2 | 5.1%(+35.1)#297 |
| 3. | Fairlee | 40.0% | 6.4%(+33.6)#3 | 5.1%(+34.9)#310 |
| 4. | Wolcott | 34.8% | 6.4%(+28.4)#4 | 5.1%(+29.7)#387 |
| 5. | East Barre | 30.9% | 6.4%(+24.5)#5 | 5.1%(+25.8)#474 |
| 6. | Canaan | 30.0% | 6.4%(+23.6)#6 | 5.1%(+24.9)#494 |
| 7. | Harmonyville | 29.4% | 6.4%(+23.0)#7 | 5.1%(+24.4)#507 |
| 8. | North Springfield | 29.1% | 6.4%(+22.7)#8 | 5.1%(+24.0)#517 |
| 9. | Wallingford | 28.3% | 6.4%(+21.9)#9 | 5.1%(+23.3)#554 |
| 10. | Albany | 28.2% | 6.4%(+21.8)#10 | 5.1%(+23.2)#559 |
| 11. | Gilman | 27.5% | 6.4%(+21.1)#11 | 5.1%(+22.4)#581 |
| 12. | Alburgh | 27.1% | 6.4%(+20.7)#12 | 5.1%(+22.0)#594 |
| 13. | Hartford | 24.8% | 6.4%(+18.4)#13 | 5.1%(+19.7)#727 |
| 14. | Pittsford | 24.6% | 6.4%(+18.1)#14 | 5.1%(+19.5)#735 |
| 15. | North Troy | 22.7% | 6.4%(+16.3)#15 | 5.1%(+17.7)#827 |
| 16. | Bethel | 21.7% | 6.4%(+15.3)#16 | 5.1%(+16.7)#896 |
| 17. | Fairfax | 21.6% | 6.4%(+15.2)#17 | 5.1%(+16.5)#907 |
| 18. | Marshfield | 21.2% | 6.4%(+14.8)#18 | 5.1%(+16.2)#940 |
| 19. | Rochester | 18.3% | 6.4%(+11.8)#19 | 5.1%(+13.2)#1,226 |
| 20. | Richford | 16.3% | 6.4%(+9.87)#20 | 5.1%(+11.2)#1,486 |
| 21. | Middletown Springs | 15.9% | 6.4%(+9.50)#21 | 5.1%(+10.9)#1,543 |
| 22. | Milton | 15.3% | 6.4%(+8.92)#22 | 5.1%(+10.3)#1,647 |
| 23. | Sutton | 15.0% | 6.4%(+8.59)#23 | 5.1%(+9.95)#1,695 |
| 24. | Barnet | 15.0% | 6.4%(+8.59)#24 | 5.1%(+9.95)#1,696 |
| 25. | North Clarendon | 14.9% | 6.4%(+8.48)#25 | 5.1%(+9.84)#1,709 |
| 26. | Bellows Falls | 13.4% | 6.4%(+6.99)#26 | 5.1%(+8.35)#2,028 |
| 27. | St Albans | 12.7% | 6.4%(+6.28)#27 | 5.1%(+7.65)#2,211 |
| 28. | Hyde Park | 11.3% | 6.4%(+4.92)#28 | 5.1%(+6.28)#2,711 |
| 29. | Newport | 11.0% | 6.4%(+4.55)#29 | 5.1%(+5.91)#2,864 |
| 30. | Worcester | 10.8% | 6.4%(+4.40)#30 | 5.1%(+5.76)#2,932 |
| 31. | Proctorsville | 10.8% | 6.4%(+4.37)#31 | 5.1%(+5.73)#2,938 |
| 32. | Poultney | 10.7% | 6.4%(+4.28)#32 | 5.1%(+5.64)#2,979 |
| 33. | Chelsea | 10.3% | 6.4%(+3.93)#33 | 5.1%(+5.29)#3,168 |
| 34. | East Poultney | 10.1% | 6.4%(+3.71)#34 | 5.1%(+5.08)#3,295 |
| 35. | Cambridge | 9.5% | 6.4%(+3.11)#35 | 5.1%(+4.47)#3,646 |
| 36. | Graniteville | 9.4% | 6.4%(+3.01)#36 | 5.1%(+4.37)#3,701 |
| 37. | Jeffersonville | 9.2% | 6.4%(+2.81)#37 | 5.1%(+4.17)#3,847 |
| 38. | Springfield | 9.1% | 6.4%(+2.72)#38 | 5.1%(+4.08)#3,902 |
| 39. | Derby Line | 8.8% | 6.4%(+2.38)#39 | 5.1%(+3.75)#4,176 |
| 40. | Richmond | 8.7% | 6.4%(+2.26)#40 | 5.1%(+3.62)#4,283 |
| 41. | Lyndonville | 8.5% | 6.4%(+2.12)#41 | 5.1%(+3.48)#4,385 |
| 42. | St Johnsbury | 8.3% | 6.4%(+1.84)#42 | 5.1%(+3.20)#4,654 |
| 43. | Proctor | 7.8% | 6.4%(+1.42)#43 | 5.1%(+2.79)#5,034 |
| 44. | Arlington | 7.8% | 6.4%(+1.39)#44 | 5.1%(+2.75)#5,061 |
| 45. | St. George | 7.8% | 6.4%(+1.36)#45 | 5.1%(+2.73)#5,084 |
| 46. | South Barre | 7.7% | 6.4%(+1.30)#46 | 5.1%(+2.66)#5,147 |
| 47. | Putney | 7.7% | 6.4%(+1.28)#47 | 5.1%(+2.64)#5,191 |
| 48. | Newfane | 7.5% | 6.4%(+1.13)#48 | 5.1%(+2.50)#5,339 |
| 49. | Randolph | 7.5% | 6.4%(+1.11)#49 | 5.1%(+2.47)#5,364 |
| 50. | Bolton Valley | 7.5% | 6.4%(+1.09)#50 | 5.1%(+2.45)#5,388 |
| 51. | Huntington Center | 7.3% | 6.4%(+0.879)#51 | 5.1%(+2.24)#5,645 |
| 52. | White River Junction | 7.1% | 6.4%(+0.664)#52 | 5.1%(+2.03)#5,935 |
| 53. | Bennington | 6.8% | 6.4%(+0.360)#53 | 5.1%(+1.72)#6,365 |
| 54. | Saxtons River | 6.7% | 6.4%(+0.315)#54 | 5.1%(+1.68)#6,424 |
| 55. | Morrisville | 6.7% | 6.4%(+0.304)#55 | 5.1%(+1.67)#6,443 |
| 56. | West Burke | 6.7% | 6.4%(+0.254)#56 | 5.1%(+1.62)#6,544 |
| 57. | Burlington | 6.6% | 6.4%(+0.235)#57 | 5.1%(+1.60)#6,572 |
| 58. | Stowe | 6.6% | 6.4%(+0.168)#58 | 5.1%(+1.53)#6,656 |
| 59. | West Rutland | 6.5% | 6.4%(+0.050)#59 | 5.1%(+1.41)#6,861 |
| 60. | Cabot | 6.4% | 6.4%(-0.030)#60 | 5.1%(+1.33)#7,010 |
| 61. | Island Pond | 6.2% | 6.4%(-0.233)#61 | 5.1%(+1.13)#7,375 |
| 62. | Quechee | 6.1% | 6.4%(-0.266)#62 | 5.1%(+1.10)#7,441 |
| 63. | Winooski | 6.1% | 6.4%(-0.330)#63 | 5.1%(+1.03)#7,559 |
| 64. | Greensboro | 6.1% | 6.4%(-0.353)#64 | 5.1%(+1.01)#7,608 |
| 65. | Northfield | 5.9% | 6.4%(-0.468)#65 | 5.1%(+0.894)#7,817 |
| 66. | Weston | 5.9% | 6.4%(-0.531)#66 | 5.1%(+0.831)#7,971 |
| 67. | South Burlington | 5.9% | 6.4%(-0.559)#67 | 5.1%(+0.803)#8,010 |
| 68. | Lincoln | 5.7% | 6.4%(-0.666)#68 | 5.1%(+0.696)#8,245 |
| 69. | Ludlow | 5.7% | 6.4%(-0.686)#69 | 5.1%(+0.676)#8,278 |
| 70. | North Bennington | 5.7% | 6.4%(-0.747)#70 | 5.1%(+0.615)#8,401 |
| 71. | Rutland | 5.6% | 6.4%(-0.829)#71 | 5.1%(+0.533)#8,548 |
| 72. | Norwich | 5.4% | 6.4%(-0.981)#72 | 5.1%(+0.381)#8,895 |
| 73. | North Hyde Park | 5.4% | 6.4%(-1.03)#73 | 5.1%(+0.333)#9,004 |
| 74. | Enosburg Falls | 5.3% | 6.4%(-1.08)#74 | 5.1%(+0.282)#9,119 |
| 75. | Bristol | 5.3% | 6.4%(-1.09)#75 | 5.1%(+0.270)#9,147 |
| 76. | Castleton Four Corners | 5.3% | 6.4%(-1.15)#76 | 5.1%(+0.212)#9,279 |
| 77. | Middlebury | 5.2% | 6.4%(-1.21)#77 | 5.1%(+0.153)#9,425 |
| 78. | Essex Junction | 5.1% | 6.4%(-1.27)#78 | 5.1%(+0.092)#9,569 |
| 79. | Killington | 5.1% | 6.4%(-1.30)#79 | 5.1%(+0.058)#9,654 |
| 80. | Chester | 5.1% | 6.4%(-1.32)#80 | 5.1%(+0.046)#9,682 |
| 81. | Brattleboro | 5.1% | 6.4%(-1.32)#81 | 5.1%(+0.041)#9,694 |
| 82. | Montpelier | 5.0% | 6.4%(-1.45)#82 | 5.1%(-0.091)#10,033 |
| 83. | Fair Haven | 4.9% | 6.4%(-1.49)#83 | 5.1%(-0.128)#10,106 |
| 84. | Shelburne | 4.9% | 6.4%(-1.50)#84 | 5.1%(-0.142)#10,146 |
| 85. | Old Bennington | 4.9% | 6.4%(-1.56)#85 | 5.1%(-0.197)#10,280 |
| 86. | Brandon | 4.7% | 6.4%(-1.76)#86 | 5.1%(-0.400)#10,800 |
| 87. | Derby Center | 4.6% | 6.4%(-1.78)#87 | 5.1%(-0.421)#10,852 |
| 88. | Barre | 4.1% | 6.4%(-2.28)#88 | 5.1%(-0.915)#12,018 |
| 89. | South Hero | 4.0% | 6.4%(-2.41)#89 | 5.1%(-1.05)#12,360 |
| 90. | Swanton | 3.8% | 6.4%(-2.60)#90 | 5.1%(-1.24)#12,809 |
| 91. | West Brattleboro | 3.6% | 6.4%(-2.77)#91 | 5.1%(-1.41)#13,206 |
| 92. | Waitsfield | 3.6% | 6.4%(-2.82)#92 | 5.1%(-1.46)#13,334 |
| 93. | Plainfield | 3.3% | 6.4%(-3.12)#93 | 5.1%(-1.75)#14,017 |
| 94. | Vergennes | 3.1% | 6.4%(-3.26)#94 | 5.1%(-1.90)#14,342 |
| 95. | Dorset | 3.1% | 6.4%(-3.28)#95 | 5.1%(-1.92)#14,380 |
| 96. | Hardwick | 3.0% | 6.4%(-3.36)#96 | 5.1%(-2.00)#14,566 |
| 97. | Bakersfield | 2.5% | 6.4%(-3.91)#97 | 5.1%(-2.55)#15,681 |
| 98. | Woodstock | 2.3% | 6.4%(-4.06)#98 | 5.1%(-2.70)#15,948 |
| 99. | Windsor | 2.2% | 6.4%(-4.17)#99 | 5.1%(-2.81)#16,154 |
| 100. | Westford | 2.2% | 6.4%(-4.24)#100 | 5.1%(-2.88)#16,278 |
1
2Common Questions
What are the Top 10 Cities with the Highest Percentage of Population with a Degree in Psychology in Vermont?
Top 10 Cities with the Highest Percentage of Population with a Degree in Psychology in Vermont are:
#1
46.9%
#2
40.0%
#3
30.9%
#4
30.0%
#5
29.1%
#6
28.3%
#7
28.2%
#8
27.1%
#9
24.6%
#10
22.7%
What city has the Highest Percentage of Population with a Degree in Psychology in Vermont?
Cavendish has the Highest Percentage of Population with a Degree in Psychology in Vermont with 46.9%.
What is the Percentage of Population with a Degree in Psychology in the State of Vermont?
Percentage of Population with a Degree in Psychology in Vermont is 6.4%.
What is the Percentage of Population with a Degree in Psychology in the United States?
Percentage of Population with a Degree in Psychology in the United States is 5.1%.