Cities with the Highest Percentage of Population with a Degree in Psychology in New Hampshire
RELATED REPORTS & OPTIONS
Psychology
New Hampshire
Compare Cities
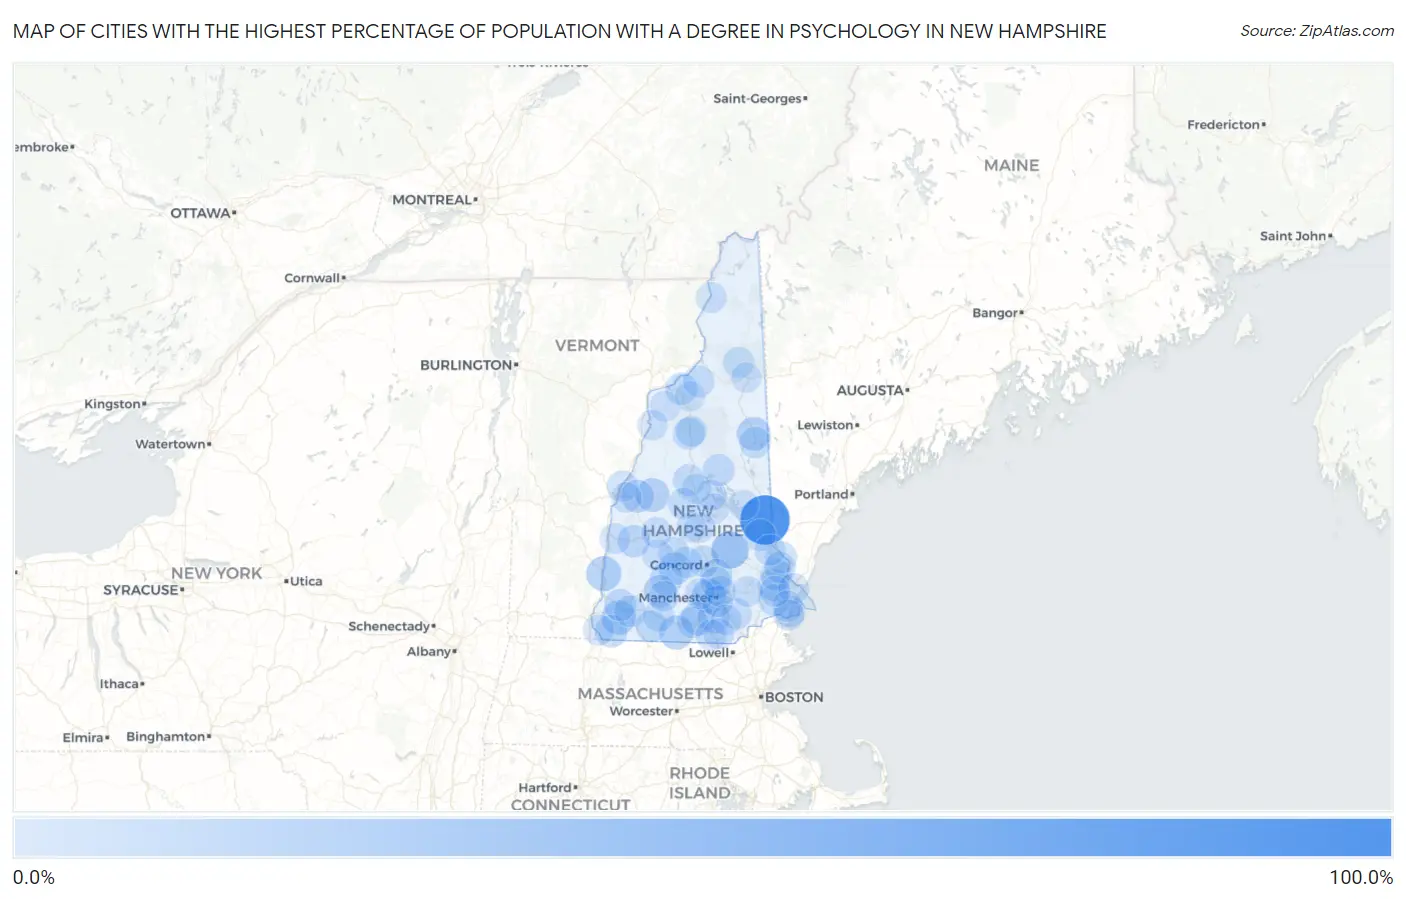
Map of Cities with the Highest Percentage of Population with a Degree in Psychology in New Hampshire
0.0%
100.0%
Cities with the Highest Percentage of Population with a Degree in Psychology in New Hampshire
| City | % Graduates | vs State | vs National | |
| 1. | Union | 100.0% | 5.7%(+94.3)#1 | 5.1%(+94.9)#12 |
| 2. | Pittsfield | 35.2% | 5.7%(+29.5)#2 | 5.1%(+30.1)#383 |
| 3. | North Walpole | 23.9% | 5.7%(+18.2)#3 | 5.1%(+18.8)#765 |
| 4. | Pinardville | 20.5% | 5.7%(+14.8)#4 | 5.1%(+15.4)#998 |
| 5. | West Swanzey | 20.3% | 5.7%(+14.6)#5 | 5.1%(+15.2)#1,014 |
| 6. | Greenville | 19.4% | 5.7%(+13.7)#6 | 5.1%(+14.4)#1,105 |
| 7. | North Conway | 17.3% | 5.7%(+11.5)#7 | 5.1%(+12.2)#1,345 |
| 8. | Canaan | 17.1% | 5.7%(+11.4)#8 | 5.1%(+12.1)#1,365 |
| 9. | Amherst | 15.8% | 5.7%(+10.1)#9 | 5.1%(+10.8)#1,559 |
| 10. | Enfield | 13.9% | 5.7%(+8.16)#10 | 5.1%(+8.83)#1,929 |
| 11. | Hillsborough | 13.1% | 5.7%(+7.41)#11 | 5.1%(+8.09)#2,111 |
| 12. | Henniker | 12.8% | 5.7%(+7.10)#12 | 5.1%(+7.78)#2,175 |
| 13. | Antrim | 12.3% | 5.7%(+6.61)#13 | 5.1%(+7.29)#2,333 |
| 14. | Winchester | 11.7% | 5.7%(+5.96)#14 | 5.1%(+6.64)#2,574 |
| 15. | Newport | 10.5% | 5.7%(+4.82)#15 | 5.1%(+5.49)#3,048 |
| 16. | Suncook | 10.0% | 5.7%(+4.30)#16 | 5.1%(+4.98)#3,339 |
| 17. | Francestown | 9.7% | 5.7%(+4.00)#17 | 5.1%(+4.67)#3,527 |
| 18. | Keene | 9.3% | 5.7%(+3.61)#18 | 5.1%(+4.29)#3,765 |
| 19. | Littleton | 9.3% | 5.7%(+3.56)#19 | 5.1%(+4.23)#3,804 |
| 20. | Newmarket | 9.3% | 5.7%(+3.54)#20 | 5.1%(+4.21)#3,820 |
| 21. | Center Sandwich | 9.2% | 5.7%(+3.50)#21 | 5.1%(+4.18)#3,843 |
| 22. | Marlborough | 8.4% | 5.7%(+2.68)#22 | 5.1%(+3.36)#4,480 |
| 23. | Farmington | 8.0% | 5.7%(+2.30)#23 | 5.1%(+2.97)#4,832 |
| 24. | East Merrimack | 8.0% | 5.7%(+2.29)#24 | 5.1%(+2.96)#4,842 |
| 25. | Plymouth | 7.9% | 5.7%(+2.20)#25 | 5.1%(+2.87)#4,948 |
| 26. | Jaffrey | 7.9% | 5.7%(+2.17)#26 | 5.1%(+2.84)#4,972 |
| 27. | Concord | 7.8% | 5.7%(+2.07)#27 | 5.1%(+2.75)#5,070 |
| 28. | North Woodstock | 7.6% | 5.7%(+1.86)#28 | 5.1%(+2.53)#5,298 |
| 29. | Durham | 7.5% | 5.7%(+1.73)#29 | 5.1%(+2.40)#5,436 |
| 30. | Conway | 7.4% | 5.7%(+1.66)#30 | 5.1%(+2.33)#5,539 |
| 31. | Somersworth | 7.3% | 5.7%(+1.62)#31 | 5.1%(+2.30)#5,582 |
| 32. | Contoocook | 7.3% | 5.7%(+1.56)#32 | 5.1%(+2.24)#5,649 |
| 33. | Hooksett | 7.0% | 5.7%(+1.32)#33 | 5.1%(+1.99)#5,983 |
| 34. | Dover | 6.5% | 5.7%(+0.773)#34 | 5.1%(+1.45)#6,793 |
| 35. | Whitefield | 6.5% | 5.7%(+0.768)#35 | 5.1%(+1.44)#6,809 |
| 36. | Peterborough | 6.4% | 5.7%(+0.665)#36 | 5.1%(+1.34)#6,989 |
| 37. | Derry | 6.2% | 5.7%(+0.445)#37 | 5.1%(+1.12)#7,389 |
| 38. | Manchester | 6.1% | 5.7%(+0.367)#38 | 5.1%(+1.04)#7,539 |
| 39. | Bristol | 6.0% | 5.7%(+0.289)#39 | 5.1%(+0.964)#7,693 |
| 40. | Exeter | 6.0% | 5.7%(+0.257)#40 | 5.1%(+0.932)#7,746 |
| 41. | Berlin | 5.8% | 5.7%(+0.102)#41 | 5.1%(+0.777)#8,054 |
| 42. | Hanover | 5.5% | 5.7%(-0.198)#42 | 5.1%(+0.477)#8,681 |
| 43. | Milford | 5.3% | 5.7%(-0.437)#43 | 5.1%(+0.238)#9,221 |
| 44. | Warner | 5.3% | 5.7%(-0.463)#44 | 5.1%(+0.212)#9,293 |
| 45. | Lincoln | 5.2% | 5.7%(-0.483)#45 | 5.1%(+0.192)#9,344 |
| 46. | Portsmouth | 5.0% | 5.7%(-0.754)#46 | 5.1%(-0.079)#9,999 |
| 47. | Hampton Beach | 4.9% | 5.7%(-0.788)#47 | 5.1%(-0.113)#10,070 |
| 48. | South Hooksett | 4.9% | 5.7%(-0.799)#48 | 5.1%(-0.124)#10,098 |
| 49. | Nashua | 4.8% | 5.7%(-0.926)#49 | 5.1%(-0.251)#10,420 |
| 50. | Hampton | 4.5% | 5.7%(-1.21)#50 | 5.1%(-0.536)#11,128 |
| 51. | Raymond | 4.5% | 5.7%(-1.23)#51 | 5.1%(-0.559)#11,167 |
| 52. | Rochester | 4.0% | 5.7%(-1.71)#52 | 5.1%(-1.03)#12,303 |
| 53. | Goffstown | 4.0% | 5.7%(-1.73)#53 | 5.1%(-1.05)#12,372 |
| 54. | Hinsdale | 4.0% | 5.7%(-1.75)#54 | 5.1%(-1.07)#12,413 |
| 55. | Seabrook Beach | 3.8% | 5.7%(-1.92)#55 | 5.1%(-1.25)#12,834 |
| 56. | Colebrook | 3.7% | 5.7%(-1.99)#56 | 5.1%(-1.32)#12,983 |
| 57. | Newfields | 3.7% | 5.7%(-2.05)#57 | 5.1%(-1.37)#13,110 |
| 58. | Bennington | 3.6% | 5.7%(-2.09)#58 | 5.1%(-1.41)#13,227 |
| 59. | Meredith | 3.5% | 5.7%(-2.20)#59 | 5.1%(-1.53)#13,476 |
| 60. | Londonderry | 3.5% | 5.7%(-2.25)#60 | 5.1%(-1.58)#13,603 |
| 61. | Bradford | 3.2% | 5.7%(-2.50)#61 | 5.1%(-1.83)#14,162 |
| 62. | Claremont | 3.2% | 5.7%(-2.50)#62 | 5.1%(-1.83)#14,174 |
| 63. | Laconia | 3.2% | 5.7%(-2.51)#63 | 5.1%(-1.84)#14,188 |
| 64. | Tilton Northfield | 3.2% | 5.7%(-2.53)#64 | 5.1%(-1.86)#14,242 |
| 65. | New London | 3.1% | 5.7%(-2.60)#65 | 5.1%(-1.93)#14,397 |
| 66. | Klondike Corner | 3.1% | 5.7%(-2.66)#66 | 5.1%(-1.99)#14,532 |
| 67. | Lebanon | 3.1% | 5.7%(-2.67)#67 | 5.1%(-2.00)#14,556 |
| 68. | Lisbon | 2.7% | 5.7%(-2.99)#68 | 5.1%(-2.31)#15,238 |
| 69. | North Haverhill | 2.7% | 5.7%(-2.99)#69 | 5.1%(-2.31)#15,239 |
| 70. | Hudson | 2.3% | 5.7%(-3.45)#70 | 5.1%(-2.77)#16,079 |
| 71. | Gorham | 1.9% | 5.7%(-3.78)#71 | 5.1%(-3.10)#16,665 |
| 72. | Franklin | 1.6% | 5.7%(-4.10)#72 | 5.1%(-3.43)#17,193 |
| 73. | Ashland | 1.5% | 5.7%(-4.25)#73 | 5.1%(-3.57)#17,383 |
| 74. | Bethlehem | 1.4% | 5.7%(-4.34)#74 | 5.1%(-3.67)#17,513 |
| 75. | Wolfeboro | 1.0% | 5.7%(-4.69)#75 | 5.1%(-4.02)#17,920 |
1
Common Questions
What are the Top 10 Cities with the Highest Percentage of Population with a Degree in Psychology in New Hampshire?
Top 10 Cities with the Highest Percentage of Population with a Degree in Psychology in New Hampshire are:
#1
100.0%
#2
35.2%
#3
23.9%
#4
20.5%
#5
20.3%
#6
19.4%
#7
17.3%
#8
17.1%
#9
15.8%
#10
13.9%
What city has the Highest Percentage of Population with a Degree in Psychology in New Hampshire?
Union has the Highest Percentage of Population with a Degree in Psychology in New Hampshire with 100.0%.
What is the Percentage of Population with a Degree in Psychology in the State of New Hampshire?
Percentage of Population with a Degree in Psychology in New Hampshire is 5.7%.
What is the Percentage of Population with a Degree in Psychology in the United States?
Percentage of Population with a Degree in Psychology in the United States is 5.1%.