Cities with the Highest Percentage of Population with a Degree in Psychology in Maryland
RELATED REPORTS & OPTIONS
Psychology
Maryland
Compare Cities
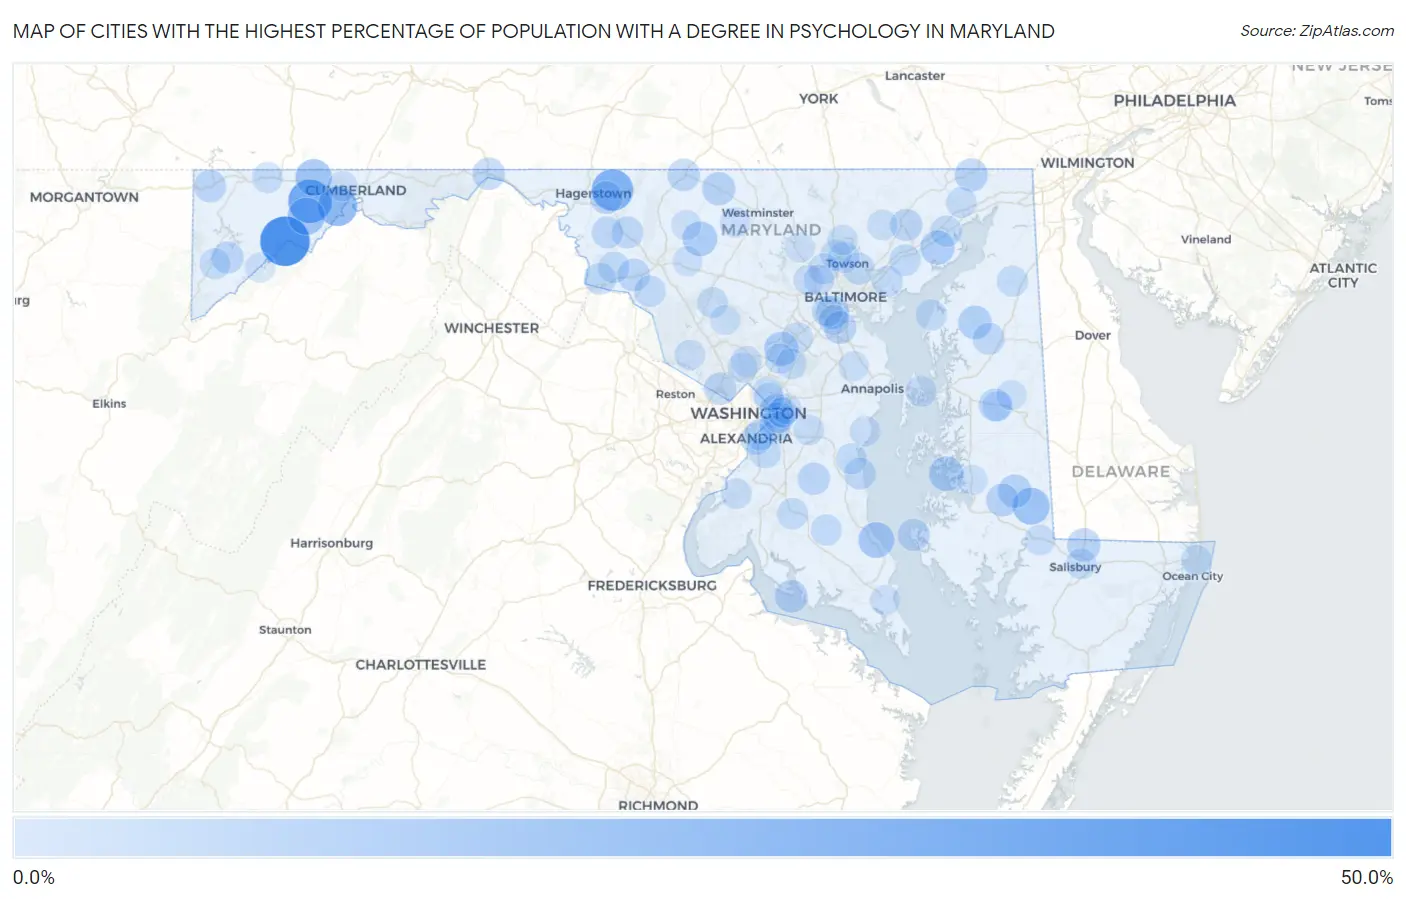
Map of Cities with the Highest Percentage of Population with a Degree in Psychology in Maryland
0.0%
50.0%
Cities with the Highest Percentage of Population with a Degree in Psychology in Maryland
| City | % Graduates | vs State | vs National | |
| 1. | Bloomington | 46.9% | 5.1%(+41.7)#1 | 5.1%(+41.8)#228 |
| 2. | Klondike | 34.0% | 5.1%(+28.9)#2 | 5.1%(+28.9)#399 |
| 3. | Chewsville | 29.5% | 5.1%(+24.4)#3 | 5.1%(+24.5)#504 |
| 4. | Cresaptown | 25.7% | 5.1%(+20.5)#4 | 5.1%(+20.6)#658 |
| 5. | Lonaconing | 20.6% | 5.1%(+15.5)#5 | 5.1%(+15.6)#990 |
| 6. | Brookview | 20.0% | 5.1%(+14.9)#6 | 5.1%(+14.9)#1,067 |
| 7. | Finzel | 19.4% | 5.1%(+14.3)#7 | 5.1%(+14.4)#1,107 |
| 8. | Long Beach | 17.5% | 5.1%(+12.4)#8 | 5.1%(+12.4)#1,324 |
| 9. | Oxford | 15.4% | 5.1%(+10.2)#9 | 5.1%(+10.3)#1,644 |
| 10. | Libertytown | 15.1% | 5.1%(+10.0)#10 | 5.1%(+10.1)#1,675 |
| 11. | Perryman | 14.6% | 5.1%(+9.50)#11 | 5.1%(+9.57)#1,760 |
| 12. | West Laurel | 14.5% | 5.1%(+9.40)#12 | 5.1%(+9.47)#1,786 |
| 13. | Fairmount Heights | 13.8% | 5.1%(+8.65)#13 | 5.1%(+8.73)#1,955 |
| 14. | Kingstown | 13.5% | 5.1%(+8.37)#14 | 5.1%(+8.44)#2,007 |
| 15. | Hurlock | 12.9% | 5.1%(+7.79)#15 | 5.1%(+7.87)#2,150 |
| 16. | Lansdowne | 12.8% | 5.1%(+7.68)#16 | 5.1%(+7.75)#2,183 |
| 17. | Delmar | 12.7% | 5.1%(+7.56)#17 | 5.1%(+7.63)#2,214 |
| 18. | Crumpton | 12.7% | 5.1%(+7.55)#18 | 5.1%(+7.62)#2,215 |
| 19. | Taneytown | 12.7% | 5.1%(+7.52)#19 | 5.1%(+7.60)#2,220 |
| 20. | Rising Sun | 12.2% | 5.1%(+7.07)#20 | 5.1%(+7.14)#2,378 |
| 21. | Robinwood | 11.8% | 5.1%(+6.69)#21 | 5.1%(+6.77)#2,522 |
| 22. | Ferndale | 11.6% | 5.1%(+6.52)#22 | 5.1%(+6.59)#2,588 |
| 23. | Cobb Island | 11.6% | 5.1%(+6.47)#23 | 5.1%(+6.54)#2,603 |
| 24. | East New Market | 11.5% | 5.1%(+6.41)#24 | 5.1%(+6.49)#2,633 |
| 25. | Jefferson | 11.2% | 5.1%(+6.08)#25 | 5.1%(+6.16)#2,752 |
| 26. | Queen Anne | 11.1% | 5.1%(+5.98)#26 | 5.1%(+6.06)#2,818 |
| 27. | Emmitsburg | 10.9% | 5.1%(+5.78)#27 | 5.1%(+5.85)#2,886 |
| 28. | Cabin John | 10.9% | 5.1%(+5.77)#28 | 5.1%(+5.84)#2,891 |
| 29. | Hancock | 10.9% | 5.1%(+5.76)#29 | 5.1%(+5.84)#2,892 |
| 30. | Friendsville | 10.6% | 5.1%(+5.51)#30 | 5.1%(+5.59)#3,002 |
| 31. | Taylors Island | 10.6% | 5.1%(+5.51)#31 | 5.1%(+5.59)#3,004 |
| 32. | Baden | 10.6% | 5.1%(+5.47)#32 | 5.1%(+5.54)#3,020 |
| 33. | Bel Air | 10.5% | 5.1%(+5.35)#33 | 5.1%(+5.43)#3,096 |
| 34. | Deer Park | 10.2% | 5.1%(+5.04)#34 | 5.1%(+5.12)#3,272 |
| 35. | Church Hill | 9.8% | 5.1%(+4.68)#35 | 5.1%(+4.75)#3,487 |
| 36. | Myersville | 9.7% | 5.1%(+4.62)#36 | 5.1%(+4.70)#3,522 |
| 37. | Parkville | 9.7% | 5.1%(+4.58)#37 | 5.1%(+4.66)#3,531 |
| 38. | Garretts Mill | 9.7% | 5.1%(+4.56)#38 | 5.1%(+4.64)#3,537 |
| 39. | Chesapeake Beach | 9.6% | 5.1%(+4.43)#39 | 5.1%(+4.50)#3,617 |
| 40. | Coral Hills | 9.5% | 5.1%(+4.40)#40 | 5.1%(+4.48)#3,626 |
| 41. | Boonsboro | 9.5% | 5.1%(+4.37)#41 | 5.1%(+4.44)#3,664 |
| 42. | Forest Heights | 9.4% | 5.1%(+4.31)#42 | 5.1%(+4.38)#3,696 |
| 43. | Friendly | 9.1% | 5.1%(+4.01)#43 | 5.1%(+4.09)#3,901 |
| 44. | Burkittsville | 9.1% | 5.1%(+3.96)#44 | 5.1%(+4.04)#3,973 |
| 45. | Joppatowne | 9.0% | 5.1%(+3.90)#45 | 5.1%(+3.97)#4,011 |
| 46. | Burnt Mills | 9.0% | 5.1%(+3.84)#46 | 5.1%(+3.92)#4,051 |
| 47. | Aberdeen | 8.9% | 5.1%(+3.77)#47 | 5.1%(+3.85)#4,096 |
| 48. | Adamstown | 8.9% | 5.1%(+3.75)#48 | 5.1%(+3.83)#4,106 |
| 49. | Glassmanor | 8.7% | 5.1%(+3.58)#49 | 5.1%(+3.66)#4,234 |
| 50. | Bryantown | 8.6% | 5.1%(+3.51)#50 | 5.1%(+3.59)#4,306 |
| 51. | Golden Beach | 8.6% | 5.1%(+3.42)#51 | 5.1%(+3.50)#4,372 |
| 52. | Hyattsville | 8.5% | 5.1%(+3.40)#52 | 5.1%(+3.48)#4,384 |
| 53. | Tolchester | 8.5% | 5.1%(+3.38)#53 | 5.1%(+3.46)#4,404 |
| 54. | Suitland | 8.5% | 5.1%(+3.34)#54 | 5.1%(+3.41)#4,431 |
| 55. | Lewistown | 8.3% | 5.1%(+3.21)#55 | 5.1%(+3.28)#4,571 |
| 56. | Lutherville | 8.3% | 5.1%(+3.15)#56 | 5.1%(+3.22)#4,635 |
| 57. | Mays Chapel | 8.2% | 5.1%(+3.11)#57 | 5.1%(+3.19)#4,667 |
| 58. | Galena | 8.2% | 5.1%(+3.07)#58 | 5.1%(+3.15)#4,697 |
| 59. | Mountain Lake Park | 8.2% | 5.1%(+3.04)#59 | 5.1%(+3.12)#4,715 |
| 60. | Capitol Heights | 8.1% | 5.1%(+3.00)#60 | 5.1%(+3.08)#4,739 |
| 61. | Middle River | 8.1% | 5.1%(+2.99)#61 | 5.1%(+3.06)#4,753 |
| 62. | Friendship | 8.1% | 5.1%(+2.95)#62 | 5.1%(+3.03)#4,792 |
| 63. | Grantsville | 8.1% | 5.1%(+2.94)#63 | 5.1%(+3.01)#4,797 |
| 64. | Arbutus | 7.9% | 5.1%(+2.80)#64 | 5.1%(+2.87)#4,950 |
| 65. | Chester | 7.9% | 5.1%(+2.75)#65 | 5.1%(+2.82)#4,998 |
| 66. | Savage | 7.9% | 5.1%(+2.73)#66 | 5.1%(+2.81)#5,012 |
| 67. | Salisbury | 7.7% | 5.1%(+2.56)#67 | 5.1%(+2.64)#5,217 |
| 68. | South Laurel | 7.6% | 5.1%(+2.46)#68 | 5.1%(+2.53)#5,294 |
| 69. | Port Deposit | 7.6% | 5.1%(+2.44)#69 | 5.1%(+2.52)#5,308 |
| 70. | Damascus | 7.6% | 5.1%(+2.43)#70 | 5.1%(+2.50)#5,325 |
| 71. | Pikesville | 7.5% | 5.1%(+2.35)#71 | 5.1%(+2.43)#5,410 |
| 72. | Marlboro Village | 7.4% | 5.1%(+2.29)#72 | 5.1%(+2.37)#5,475 |
| 73. | Mardela Springs | 7.4% | 5.1%(+2.28)#73 | 5.1%(+2.36)#5,494 |
| 74. | Glenmont | 7.4% | 5.1%(+2.23)#74 | 5.1%(+2.31)#5,568 |
| 75. | Bryans Road | 7.3% | 5.1%(+2.21)#75 | 5.1%(+2.29)#5,596 |
| 76. | Shady Side | 7.3% | 5.1%(+2.17)#76 | 5.1%(+2.25)#5,632 |
| 77. | Fallston | 7.2% | 5.1%(+2.08)#77 | 5.1%(+2.16)#5,732 |
| 78. | Milford Mill | 7.2% | 5.1%(+2.07)#78 | 5.1%(+2.15)#5,747 |
| 79. | Lochearn | 7.2% | 5.1%(+2.05)#79 | 5.1%(+2.12)#5,784 |
| 80. | Hillsboro | 7.1% | 5.1%(+2.02)#80 | 5.1%(+2.09)#5,862 |
| 81. | New Windsor | 7.1% | 5.1%(+2.00)#81 | 5.1%(+2.08)#5,880 |
| 82. | Summerfield | 6.9% | 5.1%(+1.75)#82 | 5.1%(+1.83)#6,213 |
| 83. | Cockeysville | 6.9% | 5.1%(+1.73)#83 | 5.1%(+1.81)#6,236 |
| 84. | Darnestown | 6.8% | 5.1%(+1.70)#84 | 5.1%(+1.78)#6,281 |
| 85. | Wheaton | 6.8% | 5.1%(+1.67)#85 | 5.1%(+1.75)#6,325 |
| 86. | Peppermill Village | 6.8% | 5.1%(+1.63)#86 | 5.1%(+1.71)#6,387 |
| 87. | Ocean City | 6.7% | 5.1%(+1.60)#87 | 5.1%(+1.68)#6,425 |
| 88. | Kitzmiller | 6.7% | 5.1%(+1.54)#88 | 5.1%(+1.62)#6,538 |
| 89. | Konterra | 6.7% | 5.1%(+1.53)#89 | 5.1%(+1.61)#6,553 |
| 90. | Herald Harbor | 6.6% | 5.1%(+1.49)#90 | 5.1%(+1.57)#6,596 |
| 91. | Trappe | 6.6% | 5.1%(+1.48)#91 | 5.1%(+1.56)#6,606 |
| 92. | Reisterstown | 6.6% | 5.1%(+1.48)#92 | 5.1%(+1.55)#6,615 |
| 93. | Lexington Park | 6.6% | 5.1%(+1.44)#93 | 5.1%(+1.52)#6,675 |
| 94. | La Vale | 6.5% | 5.1%(+1.37)#94 | 5.1%(+1.45)#6,799 |
| 95. | Woodsboro | 6.5% | 5.1%(+1.33)#95 | 5.1%(+1.41)#6,865 |
| 96. | Laytonsville | 6.4% | 5.1%(+1.31)#96 | 5.1%(+1.39)#6,915 |
| 97. | North Brentwood | 6.4% | 5.1%(+1.30)#97 | 5.1%(+1.38)#6,932 |
| 98. | Linganore | 6.4% | 5.1%(+1.29)#98 | 5.1%(+1.37)#6,938 |
| 99. | Linthicum | 6.4% | 5.1%(+1.26)#99 | 5.1%(+1.33)#6,999 |
| 100. | Ridgely | 6.4% | 5.1%(+1.24)#100 | 5.1%(+1.32)#7,031 |
Common Questions
What are the Top 10 Cities with the Highest Percentage of Population with a Degree in Psychology in Maryland?
Top 10 Cities with the Highest Percentage of Population with a Degree in Psychology in Maryland are:
#1
46.9%
#2
34.0%
#3
29.5%
#4
25.7%
#5
20.6%
#6
20.0%
#7
19.4%
#8
17.5%
#9
15.4%
#10
15.1%
What city has the Highest Percentage of Population with a Degree in Psychology in Maryland?
Bloomington has the Highest Percentage of Population with a Degree in Psychology in Maryland with 46.9%.
What is the Percentage of Population with a Degree in Psychology in the State of Maryland?
Percentage of Population with a Degree in Psychology in Maryland is 5.1%.
What is the Percentage of Population with a Degree in Psychology in the United States?
Percentage of Population with a Degree in Psychology in the United States is 5.1%.