Cities with the Highest Percentage of Population with a Degree in Psychology in Ohio
RELATED REPORTS & OPTIONS
Psychology
Ohio
Compare Cities
Map of Cities with the Highest Percentage of Population with a Degree in Psychology in Ohio
0.0%
100.0%
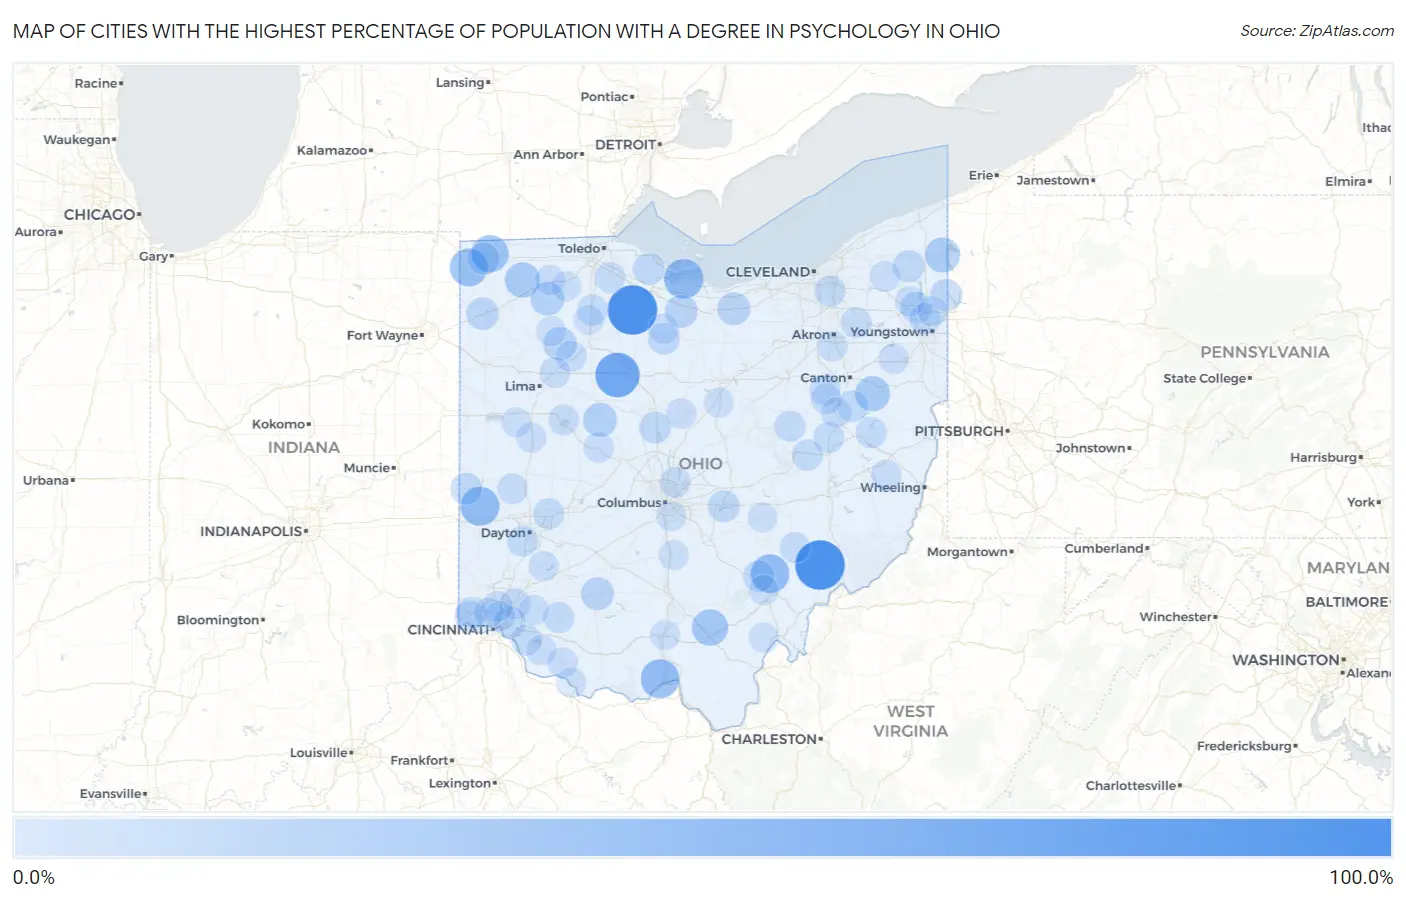
Cities with the Highest Percentage of Population with a Degree in Psychology in Ohio
| City | % Graduates | vs State | vs National | |
| 1. | Waterford | 100.0% | 4.4%(+95.6)#1 | 5.1%(+94.9)#14 |
| 2. | Jacksontown | 100.0% | 4.4%(+95.6)#2 | 5.1%(+94.9)#22 |
| 3. | Kansas | 100.0% | 4.4%(+95.6)#3 | 5.1%(+94.9)#24 |
| 4. | Kirby | 75.0% | 4.4%(+70.6)#4 | 5.1%(+69.9)#64 |
| 5. | Bolton | 52.4% | 4.4%(+48.0)#5 | 5.1%(+47.3)#149 |
| 6. | Crystal Rock | 51.8% | 4.4%(+47.4)#6 | 5.1%(+46.7)#153 |
| 7. | Castine | 50.0% | 4.4%(+45.6)#7 | 5.1%(+44.9)#185 |
| 8. | West Portsmouth | 48.7% | 4.4%(+44.3)#8 | 5.1%(+43.6)#214 |
| 9. | Jacksonville | 48.4% | 4.4%(+44.0)#9 | 5.1%(+43.3)#216 |
| 10. | Blakeslee | 44.4% | 4.4%(+40.0)#10 | 5.1%(+39.4)#254 |
| 11. | West Logan | 41.9% | 4.4%(+37.5)#11 | 5.1%(+36.8)#279 |
| 12. | Holiday City | 41.7% | 4.4%(+37.3)#12 | 5.1%(+36.6)#285 |
| 13. | Woodsdale | 39.0% | 4.4%(+34.6)#13 | 5.1%(+33.9)#326 |
| 14. | Coalton | 37.5% | 4.4%(+33.1)#14 | 5.1%(+32.4)#343 |
| 15. | Miller | 33.0% | 4.4%(+28.6)#15 | 5.1%(+27.9)#438 |
| 16. | Malvern | 32.2% | 4.4%(+27.8)#16 | 5.1%(+27.1)#448 |
| 17. | Ridgeville Corners | 32.1% | 4.4%(+27.7)#17 | 5.1%(+27.1)#451 |
| 18. | Andover | 31.2% | 4.4%(+26.8)#18 | 5.1%(+26.2)#467 |
| 19. | Mount Hope | 29.2% | 4.4%(+24.8)#19 | 5.1%(+24.1)#515 |
| 20. | Ridgeway | 26.9% | 4.4%(+22.5)#20 | 5.1%(+21.9)#603 |
| 21. | Malinta | 26.1% | 4.4%(+21.7)#21 | 5.1%(+21.0)#640 |
| 22. | Oakwood Village Cuyahoga County | 23.9% | 4.4%(+19.5)#22 | 5.1%(+18.8)#767 |
| 23. | Gilboa | 23.8% | 4.4%(+19.4)#23 | 5.1%(+18.8)#774 |
| 24. | Highland | 22.2% | 4.4%(+17.8)#24 | 5.1%(+17.2)#867 |
| 25. | Wakeman | 22.0% | 4.4%(+17.6)#25 | 5.1%(+16.9)#884 |
| 26. | Flat Rock | 21.4% | 4.4%(+17.0)#26 | 5.1%(+16.4)#924 |
| 27. | North Lima | 20.9% | 4.4%(+16.5)#27 | 5.1%(+15.8)#967 |
| 28. | Cecil | 20.0% | 4.4%(+15.6)#28 | 5.1%(+14.9)#1,058 |
| 29. | Fort Mckinley | 19.0% | 4.4%(+14.6)#29 | 5.1%(+13.9)#1,158 |
| 30. | Montpelier | 18.6% | 4.4%(+14.1)#30 | 5.1%(+13.5)#1,198 |
| 31. | Orangeville | 18.5% | 4.4%(+14.1)#31 | 5.1%(+13.5)#1,201 |
| 32. | Buckeye Lake | 18.0% | 4.4%(+13.6)#32 | 5.1%(+13.0)#1,259 |
| 33. | Orwell | 17.4% | 4.4%(+13.0)#33 | 5.1%(+12.4)#1,329 |
| 34. | Waldo | 17.4% | 4.4%(+13.0)#34 | 5.1%(+12.3)#1,334 |
| 35. | Oak Harbor | 17.3% | 4.4%(+12.9)#35 | 5.1%(+12.3)#1,341 |
| 36. | Bloomville | 16.7% | 4.4%(+12.3)#36 | 5.1%(+11.6)#1,402 |
| 37. | Palestine | 16.7% | 4.4%(+12.3)#37 | 5.1%(+11.6)#1,431 |
| 38. | Morgandale | 16.0% | 4.4%(+11.6)#38 | 5.1%(+10.9)#1,522 |
| 39. | Mckinley Heights | 15.7% | 4.4%(+11.3)#39 | 5.1%(+10.6)#1,578 |
| 40. | Mineral City | 15.6% | 4.4%(+11.1)#40 | 5.1%(+10.5)#1,594 |
| 41. | Buchtel | 15.5% | 4.4%(+11.1)#41 | 5.1%(+10.5)#1,601 |
| 42. | Plainville | 15.4% | 4.4%(+11.0)#42 | 5.1%(+10.3)#1,639 |
| 43. | Bowerston | 14.7% | 4.4%(+10.3)#43 | 5.1%(+9.65)#1,733 |
| 44. | Walton Hills | 14.4% | 4.4%(+9.98)#44 | 5.1%(+9.34)#1,807 |
| 45. | Stone Creek | 14.3% | 4.4%(+9.87)#45 | 5.1%(+9.23)#1,851 |
| 46. | Crystal Lakes | 14.1% | 4.4%(+9.67)#46 | 5.1%(+9.03)#1,881 |
| 47. | Lake Buckhorn | 14.1% | 4.4%(+9.67)#47 | 5.1%(+9.03)#1,883 |
| 48. | West Lafayette | 14.1% | 4.4%(+9.65)#48 | 5.1%(+9.01)#1,888 |
| 49. | Cygnet | 14.0% | 4.4%(+9.62)#49 | 5.1%(+8.98)#1,895 |
| 50. | Brewster | 13.8% | 4.4%(+9.36)#50 | 5.1%(+8.72)#1,957 |
| 51. | Fayetteville | 13.6% | 4.4%(+9.23)#51 | 5.1%(+8.59)#1,980 |
| 52. | Amelia | 13.6% | 4.4%(+9.19)#52 | 5.1%(+8.55)#1,988 |
| 53. | Moraine | 13.6% | 4.4%(+9.17)#53 | 5.1%(+8.53)#1,990 |
| 54. | Chippewa Park | 13.4% | 4.4%(+9.00)#54 | 5.1%(+8.36)#2,025 |
| 55. | Grandview | 13.4% | 4.4%(+8.96)#55 | 5.1%(+8.32)#2,031 |
| 56. | Beach City | 13.3% | 4.4%(+8.92)#56 | 5.1%(+8.28)#2,046 |
| 57. | Mount Cory | 13.3% | 4.4%(+8.92)#57 | 5.1%(+8.28)#2,051 |
| 58. | Miamitown | 13.2% | 4.4%(+8.77)#58 | 5.1%(+8.13)#2,097 |
| 59. | Brady Lake | 13.2% | 4.4%(+8.75)#59 | 5.1%(+8.11)#2,103 |
| 60. | Sixteen Mile Stand | 13.1% | 4.4%(+8.72)#60 | 5.1%(+8.08)#2,113 |
| 61. | Saybrook-On-The-Lake | 12.9% | 4.4%(+8.46)#61 | 5.1%(+7.82)#2,168 |
| 62. | Huber Ridge | 12.5% | 4.4%(+8.09)#62 | 5.1%(+7.45)#2,250 |
| 63. | Beaverdam | 12.5% | 4.4%(+8.09)#63 | 5.1%(+7.45)#2,266 |
| 64. | Luckey | 12.4% | 4.4%(+8.00)#64 | 5.1%(+7.36)#2,314 |
| 65. | Pleasant Hill | 12.2% | 4.4%(+7.80)#65 | 5.1%(+7.16)#2,373 |
| 66. | Malta | 12.2% | 4.4%(+7.75)#66 | 5.1%(+7.11)#2,389 |
| 67. | North Industry | 12.1% | 4.4%(+7.74)#67 | 5.1%(+7.10)#2,394 |
| 68. | Edison | 12.0% | 4.4%(+7.59)#68 | 5.1%(+6.95)#2,454 |
| 69. | Middlefield | 11.9% | 4.4%(+7.54)#69 | 5.1%(+6.90)#2,474 |
| 70. | Lloydsville | 11.9% | 4.4%(+7.49)#70 | 5.1%(+6.85)#2,491 |
| 71. | Bethel | 11.7% | 4.4%(+7.28)#71 | 5.1%(+6.64)#2,573 |
| 72. | Woodlawn | 11.5% | 4.4%(+7.07)#72 | 5.1%(+6.43)#2,650 |
| 73. | Petersburg | 11.4% | 4.4%(+7.02)#73 | 5.1%(+6.38)#2,679 |
| 74. | Beloit | 11.4% | 4.4%(+6.97)#74 | 5.1%(+6.33)#2,691 |
| 75. | Republic | 11.4% | 4.4%(+6.95)#75 | 5.1%(+6.31)#2,700 |
| 76. | East Liberty | 11.2% | 4.4%(+6.80)#76 | 5.1%(+6.16)#2,753 |
| 77. | Parral | 11.1% | 4.4%(+6.70)#77 | 5.1%(+6.06)#2,813 |
| 78. | Goshen | 11.0% | 4.4%(+6.59)#78 | 5.1%(+5.95)#2,849 |
| 79. | Liberty Center | 11.0% | 4.4%(+6.57)#79 | 5.1%(+5.93)#2,856 |
| 80. | Flushing | 11.0% | 4.4%(+6.55)#80 | 5.1%(+5.91)#2,865 |
| 81. | Golf Manor | 10.9% | 4.4%(+6.49)#81 | 5.1%(+5.85)#2,888 |
| 82. | Georgetown | 10.8% | 4.4%(+6.37)#82 | 5.1%(+5.73)#2,940 |
| 83. | Anna | 10.7% | 4.4%(+6.33)#83 | 5.1%(+5.69)#2,961 |
| 84. | Portage Lakes | 10.7% | 4.4%(+6.33)#84 | 5.1%(+5.69)#2,965 |
| 85. | Champion Heights | 10.7% | 4.4%(+6.31)#85 | 5.1%(+5.67)#2,968 |
| 86. | Corwin | 10.6% | 4.4%(+6.15)#86 | 5.1%(+5.51)#3,038 |
| 87. | The Plains | 10.3% | 4.4%(+5.90)#87 | 5.1%(+5.26)#3,193 |
| 88. | Rutland | 10.3% | 4.4%(+5.88)#88 | 5.1%(+5.24)#3,199 |
| 89. | North College Hill | 10.2% | 4.4%(+5.81)#89 | 5.1%(+5.17)#3,239 |
| 90. | Grand Rapids | 10.1% | 4.4%(+5.71)#90 | 5.1%(+5.07)#3,296 |
| 91. | Ripley | 10.1% | 4.4%(+5.66)#91 | 5.1%(+5.02)#3,317 |
| 92. | New Knoxville | 10.0% | 4.4%(+5.59)#92 | 5.1%(+4.95)#3,353 |
| 93. | West Leipsic | 10.0% | 4.4%(+5.59)#93 | 5.1%(+4.95)#3,382 |
| 94. | Fultonham | 10.0% | 4.4%(+5.59)#94 | 5.1%(+4.95)#3,395 |
| 95. | Vienna Center | 9.9% | 4.4%(+5.53)#95 | 5.1%(+4.89)#3,423 |
| 96. | Bellville | 9.9% | 4.4%(+5.44)#96 | 5.1%(+4.80)#3,462 |
| 97. | North Baltimore | 9.8% | 4.4%(+5.43)#97 | 5.1%(+4.79)#3,464 |
| 98. | Obetz | 9.8% | 4.4%(+5.43)#98 | 5.1%(+4.79)#3,467 |
| 99. | Circleville | 9.8% | 4.4%(+5.43)#99 | 5.1%(+4.79)#3,468 |
| 100. | Piketon | 9.8% | 4.4%(+5.40)#100 | 5.1%(+4.76)#3,482 |
Common Questions
What are the Top 10 Cities with the Highest Percentage of Population with a Degree in Psychology in Ohio?
Top 10 Cities with the Highest Percentage of Population with a Degree in Psychology in Ohio are:
#1
100.0%
#2
100.0%
#3
75.0%
#4
51.8%
#5
50.0%
#6
48.7%
#7
48.4%
#8
44.4%
#9
41.7%
#10
37.5%
What city has the Highest Percentage of Population with a Degree in Psychology in Ohio?
Waterford has the Highest Percentage of Population with a Degree in Psychology in Ohio with 100.0%.
What is the Percentage of Population with a Degree in Psychology in the State of Ohio?
Percentage of Population with a Degree in Psychology in Ohio is 4.4%.
What is the Percentage of Population with a Degree in Psychology in the United States?
Percentage of Population with a Degree in Psychology in the United States is 5.1%.