Cities with the Highest Percentage of Population with a Degree in Psychology in Iowa
RELATED REPORTS & OPTIONS
Psychology
Iowa
Compare Cities
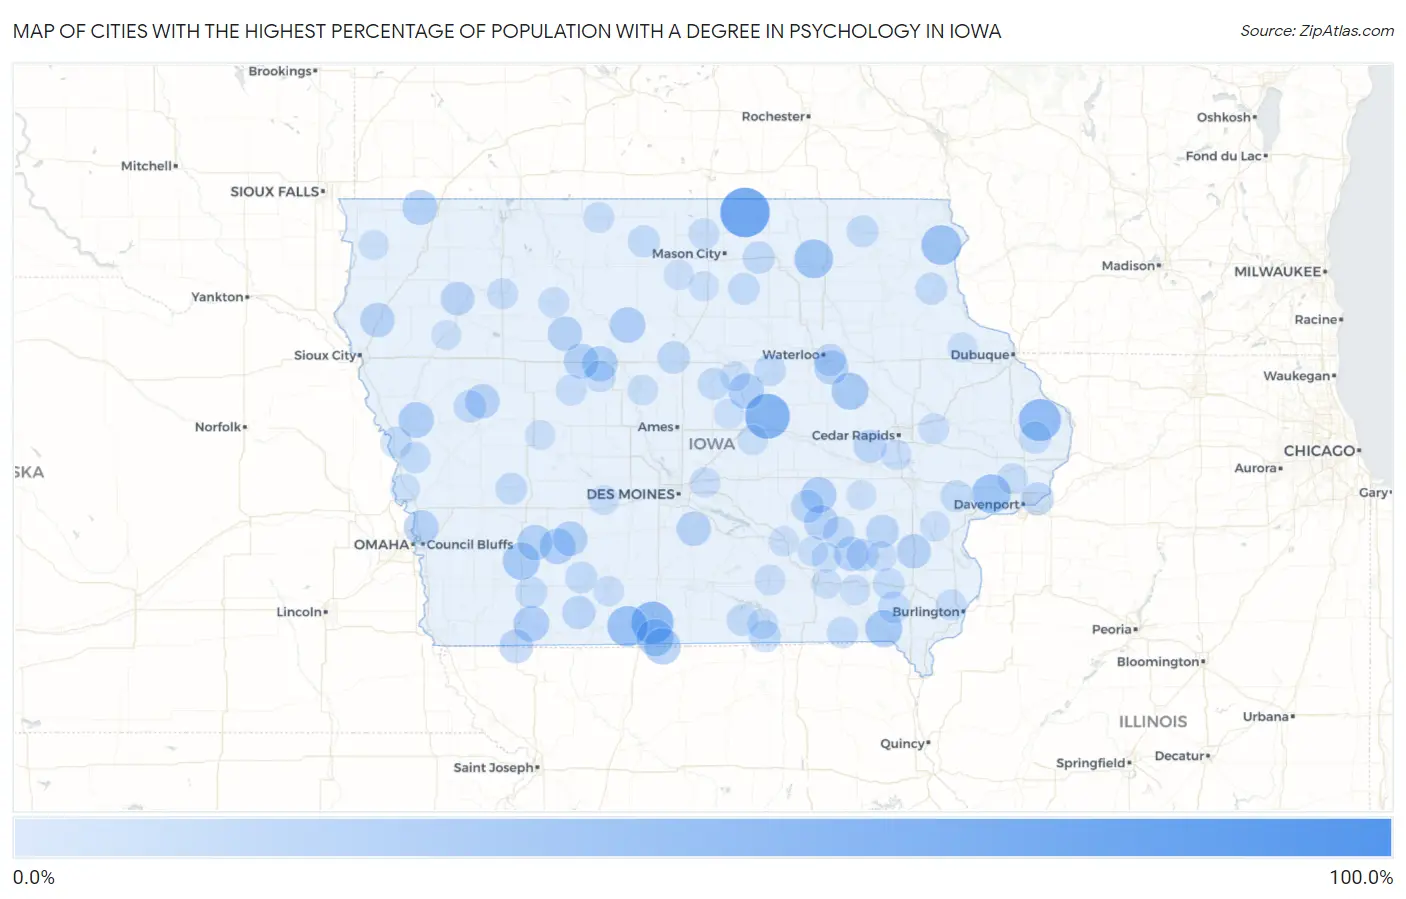
Map of Cities with the Highest Percentage of Population with a Degree in Psychology in Iowa
0.0%
100.0%
Cities with the Highest Percentage of Population with a Degree in Psychology in Iowa
| City | % Graduates | vs State | vs National | |
| 1. | Moscow | 100.0% | 4.6%(+95.4)#1 | 5.1%(+94.9)#18 |
| 2. | Downey | 100.0% | 4.6%(+95.4)#2 | 5.1%(+94.9)#37 |
| 3. | Carpenter | 75.0% | 4.6%(+70.4)#3 | 5.1%(+69.9)#63 |
| 4. | Green Mountain | 59.1% | 4.6%(+54.5)#4 | 5.1%(+54.0)#121 |
| 5. | Decatur City | 50.0% | 4.6%(+45.4)#5 | 5.1%(+44.9)#182 |
| 6. | Spragueville | 50.0% | 4.6%(+45.4)#6 | 5.1%(+44.9)#187 |
| 7. | Kellerton | 44.4% | 4.6%(+39.9)#7 | 5.1%(+39.4)#250 |
| 8. | Waterville | 42.9% | 4.6%(+38.3)#8 | 5.1%(+37.8)#267 |
| 9. | Stockton | 40.0% | 4.6%(+35.4)#9 | 5.1%(+34.9)#305 |
| 10. | North Washington | 38.9% | 4.6%(+34.3)#10 | 5.1%(+33.8)#328 |
| 11. | Bonaparte | 33.3% | 4.6%(+28.8)#11 | 5.1%(+28.3)#411 |
| 12. | Davis City | 33.3% | 4.6%(+28.8)#12 | 5.1%(+28.3)#418 |
| 13. | Mount Auburn | 33.3% | 4.6%(+28.8)#13 | 5.1%(+28.3)#423 |
| 14. | Grant | 33.3% | 4.6%(+28.8)#14 | 5.1%(+28.3)#433 |
| 15. | Pleasanton | 31.6% | 4.6%(+27.0)#15 | 5.1%(+26.5)#462 |
| 16. | New Market | 29.4% | 4.6%(+24.8)#16 | 5.1%(+24.4)#505 |
| 17. | Deep River | 28.6% | 4.6%(+24.0)#17 | 5.1%(+23.5)#530 |
| 18. | Thor | 28.6% | 4.6%(+24.0)#18 | 5.1%(+23.5)#537 |
| 19. | Castana | 28.6% | 4.6%(+24.0)#19 | 5.1%(+23.5)#538 |
| 20. | Whitten | 28.6% | 4.6%(+24.0)#20 | 5.1%(+23.5)#541 |
| 21. | Bridgewater | 28.6% | 4.6%(+24.0)#21 | 5.1%(+23.5)#542 |
| 22. | Cumberland | 27.8% | 4.6%(+23.2)#22 | 5.1%(+22.7)#571 |
| 23. | Moorland | 27.3% | 4.6%(+22.7)#23 | 5.1%(+22.2)#590 |
| 24. | Little Rock | 27.0% | 4.6%(+22.5)#24 | 5.1%(+22.0)#598 |
| 25. | Knierim | 26.7% | 4.6%(+22.1)#25 | 5.1%(+21.6)#616 |
| 26. | Crescent | 25.4% | 4.6%(+20.9)#26 | 5.1%(+20.4)#670 |
| 27. | Fontanelle | 25.4% | 4.6%(+20.8)#27 | 5.1%(+20.4)#671 |
| 28. | Merrill | 25.0% | 4.6%(+20.4)#28 | 5.1%(+19.9)#679 |
| 29. | What Cheer | 25.0% | 4.6%(+20.4)#29 | 5.1%(+19.9)#682 |
| 30. | Crawfordsville | 25.0% | 4.6%(+20.4)#30 | 5.1%(+19.9)#686 |
| 31. | Kiron | 25.0% | 4.6%(+20.4)#31 | 5.1%(+19.9)#689 |
| 32. | Ollie | 25.0% | 4.6%(+20.4)#32 | 5.1%(+19.9)#701 |
| 33. | Palmer | 25.0% | 4.6%(+20.4)#33 | 5.1%(+19.9)#707 |
| 34. | Ackworth | 25.0% | 4.6%(+20.4)#34 | 5.1%(+19.9)#712 |
| 35. | Washburn | 23.8% | 4.6%(+19.2)#35 | 5.1%(+18.8)#771 |
| 36. | Braddyville | 23.5% | 4.6%(+19.0)#36 | 5.1%(+18.5)#788 |
| 37. | Larrabee | 22.2% | 4.6%(+17.6)#37 | 5.1%(+17.2)#866 |
| 38. | Clearfield | 21.2% | 4.6%(+16.6)#38 | 5.1%(+16.1)#947 |
| 39. | Norway | 20.4% | 4.6%(+15.8)#39 | 5.1%(+15.4)#1,002 |
| 40. | West Chester | 20.0% | 4.6%(+15.4)#40 | 5.1%(+14.9)#1,054 |
| 41. | Panorama Park | 20.0% | 4.6%(+15.4)#41 | 5.1%(+14.9)#1,057 |
| 42. | Barnes City | 20.0% | 4.6%(+15.4)#42 | 5.1%(+14.9)#1,060 |
| 43. | Blairsburg | 19.2% | 4.6%(+14.7)#43 | 5.1%(+14.2)#1,130 |
| 44. | Schleswig | 19.0% | 4.6%(+14.5)#44 | 5.1%(+14.0)#1,147 |
| 45. | Evansdale | 18.5% | 4.6%(+13.9)#45 | 5.1%(+13.4)#1,207 |
| 46. | Rudd | 18.2% | 4.6%(+13.6)#46 | 5.1%(+13.1)#1,234 |
| 47. | Richland | 18.1% | 4.6%(+13.5)#47 | 5.1%(+13.0)#1,257 |
| 48. | Charlotte | 17.8% | 4.6%(+13.2)#48 | 5.1%(+12.7)#1,289 |
| 49. | St Olaf | 17.6% | 4.6%(+13.1)#49 | 5.1%(+12.6)#1,311 |
| 50. | Atalissa | 17.4% | 4.6%(+12.8)#50 | 5.1%(+12.3)#1,335 |
| 51. | Woden | 17.4% | 4.6%(+12.8)#51 | 5.1%(+12.3)#1,337 |
| 52. | Hubbard | 17.2% | 4.6%(+12.7)#52 | 5.1%(+12.2)#1,348 |
| 53. | Ridgeway | 17.1% | 4.6%(+12.6)#53 | 5.1%(+12.1)#1,364 |
| 54. | Holland | 17.1% | 4.6%(+12.5)#54 | 5.1%(+12.0)#1,370 |
| 55. | Sigourney | 16.9% | 4.6%(+12.3)#55 | 5.1%(+11.9)#1,379 |
| 56. | Kimballton | 16.7% | 4.6%(+12.1)#56 | 5.1%(+11.6)#1,426 |
| 57. | Hillsboro | 16.7% | 4.6%(+12.1)#57 | 5.1%(+11.6)#1,436 |
| 58. | Exline | 16.7% | 4.6%(+12.1)#58 | 5.1%(+11.6)#1,438 |
| 59. | Plano | 16.7% | 4.6%(+12.1)#59 | 5.1%(+11.6)#1,443 |
| 60. | Cromwell | 16.7% | 4.6%(+12.1)#60 | 5.1%(+11.6)#1,445 |
| 61. | Dougherty | 16.7% | 4.6%(+12.1)#61 | 5.1%(+11.6)#1,446 |
| 62. | Nodaway | 16.7% | 4.6%(+12.1)#62 | 5.1%(+11.6)#1,447 |
| 63. | Lockridge | 15.9% | 4.6%(+11.3)#63 | 5.1%(+10.9)#1,540 |
| 64. | Milton | 15.8% | 4.6%(+11.2)#64 | 5.1%(+10.7)#1,561 |
| 65. | Callender | 15.6% | 4.6%(+11.0)#65 | 5.1%(+10.6)#1,584 |
| 66. | Blencoe | 15.6% | 4.6%(+11.0)#66 | 5.1%(+10.6)#1,587 |
| 67. | Pisgah | 15.2% | 4.6%(+10.6)#67 | 5.1%(+10.1)#1,672 |
| 68. | Lohrville | 14.3% | 4.6%(+9.71)#68 | 5.1%(+9.23)#1,831 |
| 69. | Hanlontown | 14.3% | 4.6%(+9.71)#69 | 5.1%(+9.23)#1,842 |
| 70. | Donahue | 13.9% | 4.6%(+9.31)#70 | 5.1%(+8.84)#1,925 |
| 71. | Sioux Rapids | 13.9% | 4.6%(+9.29)#71 | 5.1%(+8.81)#1,933 |
| 72. | Swea City | 13.8% | 4.6%(+9.17)#72 | 5.1%(+8.70)#1,963 |
| 73. | Beaverdale | 13.7% | 4.6%(+9.17)#73 | 5.1%(+8.69)#1,964 |
| 74. | Havelock | 13.3% | 4.6%(+8.76)#74 | 5.1%(+8.28)#2,060 |
| 75. | Brighton | 13.2% | 4.6%(+8.58)#75 | 5.1%(+8.11)#2,105 |
| 76. | Martelle | 13.2% | 4.6%(+8.58)#76 | 5.1%(+8.11)#2,106 |
| 77. | Albia | 13.1% | 4.6%(+8.54)#77 | 5.1%(+8.06)#2,114 |
| 78. | Centerville | 12.8% | 4.6%(+8.21)#78 | 5.1%(+7.73)#2,188 |
| 79. | Libertyville | 12.8% | 4.6%(+8.19)#79 | 5.1%(+7.71)#2,193 |
| 80. | Swisher | 12.5% | 4.6%(+7.97)#80 | 5.1%(+7.50)#2,246 |
| 81. | Haverhill | 12.5% | 4.6%(+7.92)#81 | 5.1%(+7.45)#2,286 |
| 82. | Arispe | 12.5% | 4.6%(+7.92)#82 | 5.1%(+7.45)#2,294 |
| 83. | Mitchellville | 12.4% | 4.6%(+7.81)#83 | 5.1%(+7.34)#2,317 |
| 84. | Diamondhead Lake | 12.1% | 4.6%(+7.52)#84 | 5.1%(+7.05)#2,414 |
| 85. | Stratford | 11.9% | 4.6%(+7.36)#85 | 5.1%(+6.89)#2,478 |
| 86. | Fremont | 11.9% | 4.6%(+7.36)#86 | 5.1%(+6.89)#2,479 |
| 87. | Conesville | 11.8% | 4.6%(+7.19)#87 | 5.1%(+6.71)#2,544 |
| 88. | Clemons | 11.8% | 4.6%(+7.19)#88 | 5.1%(+6.71)#2,557 |
| 89. | Willey | 11.8% | 4.6%(+7.19)#89 | 5.1%(+6.71)#2,559 |
| 90. | Klemme | 11.6% | 4.6%(+7.05)#90 | 5.1%(+6.58)#2,592 |
| 91. | Hedrick | 11.6% | 4.6%(+7.02)#91 | 5.1%(+6.54)#2,604 |
| 92. | Rock Valley | 11.5% | 4.6%(+6.97)#92 | 5.1%(+6.49)#2,623 |
| 93. | Beacon | 11.5% | 4.6%(+6.96)#93 | 5.1%(+6.49)#2,632 |
| 94. | Thornton | 11.3% | 4.6%(+6.71)#94 | 5.1%(+6.24)#2,727 |
| 95. | Eldora | 11.1% | 4.6%(+6.57)#95 | 5.1%(+6.09)#2,766 |
| 96. | Agency | 11.1% | 4.6%(+6.54)#96 | 5.1%(+6.06)#2,792 |
| 97. | New Vienna | 11.1% | 4.6%(+6.54)#97 | 5.1%(+6.06)#2,793 |
| 98. | Quimby | 11.1% | 4.6%(+6.54)#98 | 5.1%(+6.06)#2,802 |
| 99. | Parnell | 11.1% | 4.6%(+6.54)#99 | 5.1%(+6.06)#2,809 |
| 100. | Modale | 11.1% | 4.6%(+6.54)#100 | 5.1%(+6.06)#2,811 |
Common Questions
What are the Top 10 Cities with the Highest Percentage of Population with a Degree in Psychology in Iowa?
Top 10 Cities with the Highest Percentage of Population with a Degree in Psychology in Iowa are:
#1
75.0%
#2
59.1%
#3
50.0%
#4
50.0%
#5
44.4%
#6
42.9%
#7
40.0%
#8
38.9%
#9
33.3%
#10
33.3%
What city has the Highest Percentage of Population with a Degree in Psychology in Iowa?
Carpenter has the Highest Percentage of Population with a Degree in Psychology in Iowa with 75.0%.
What is the Percentage of Population with a Degree in Psychology in the State of Iowa?
Percentage of Population with a Degree in Psychology in Iowa is 4.6%.
What is the Percentage of Population with a Degree in Psychology in the United States?
Percentage of Population with a Degree in Psychology in the United States is 5.1%.