Cities with the Highest Percentage of Population with a Degree in Psychology in Tennessee
RELATED REPORTS & OPTIONS
Psychology
Tennessee
Compare Cities
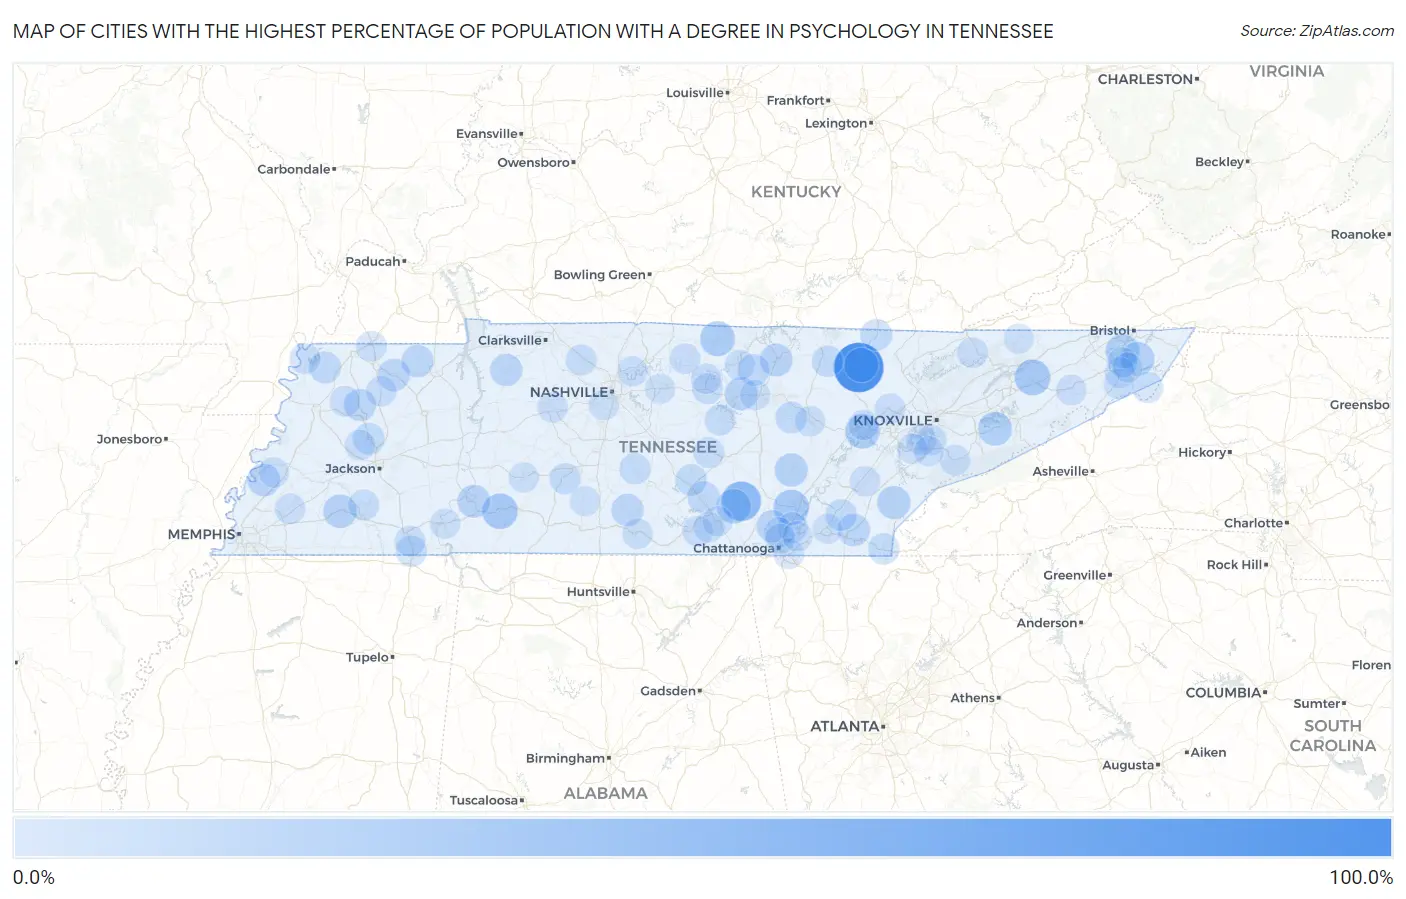
Map of Cities with the Highest Percentage of Population with a Degree in Psychology in Tennessee
0.0%
100.0%
Cities with the Highest Percentage of Population with a Degree in Psychology in Tennessee
| City | % Graduates | vs State | vs National | |
| 1. | Statesville | 100.0% | 4.9%(+95.1)#1 | 5.1%(+94.9)#19 |
| 2. | Elgin | 100.0% | 4.9%(+95.1)#2 | 5.1%(+94.9)#29 |
| 3. | Gruetli Laager | 50.0% | 4.9%(+45.1)#3 | 5.1%(+44.9)#157 |
| 4. | Bulls Gap | 31.9% | 4.9%(+27.0)#4 | 5.1%(+26.8)#454 |
| 5. | Mcdonald | 31.3% | 4.9%(+26.4)#5 | 5.1%(+26.3)#465 |
| 6. | Flat Top Mountain | 31.2% | 4.9%(+26.3)#6 | 5.1%(+26.2)#466 |
| 7. | Waynesboro | 30.9% | 4.9%(+26.0)#7 | 5.1%(+25.9)#473 |
| 8. | Red Boiling Springs | 28.2% | 4.9%(+23.3)#8 | 5.1%(+23.2)#557 |
| 9. | Midtown | 27.1% | 4.9%(+22.2)#9 | 5.1%(+22.0)#596 |
| 10. | Robbins | 26.1% | 4.9%(+21.2)#10 | 5.1%(+21.0)#641 |
| 11. | Coalmont | 26.0% | 4.9%(+21.1)#11 | 5.1%(+21.0)#642 |
| 12. | Bluff City | 23.9% | 4.9%(+19.0)#12 | 5.1%(+18.9)#764 |
| 13. | Fairgarden | 23.6% | 4.9%(+18.7)#13 | 5.1%(+18.6)#781 |
| 14. | Hunter | 23.3% | 4.9%(+18.4)#14 | 5.1%(+18.2)#798 |
| 15. | Whiteville | 22.4% | 4.9%(+17.5)#15 | 5.1%(+17.4)#845 |
| 16. | Tellico Plains | 20.5% | 4.9%(+15.6)#16 | 5.1%(+15.4)#996 |
| 17. | Pikeville | 19.9% | 4.9%(+15.0)#17 | 5.1%(+14.8)#1,075 |
| 18. | Livingston | 19.1% | 4.9%(+14.2)#18 | 5.1%(+14.1)#1,138 |
| 19. | Baxter | 19.0% | 4.9%(+14.1)#19 | 5.1%(+14.0)#1,143 |
| 20. | Clifton | 18.8% | 4.9%(+13.9)#20 | 5.1%(+13.8)#1,169 |
| 21. | Rocky Top | 18.6% | 4.9%(+13.7)#21 | 5.1%(+13.6)#1,193 |
| 22. | Gilt Edge | 18.3% | 4.9%(+13.4)#22 | 5.1%(+13.3)#1,219 |
| 23. | Walnut Grove Cdp Hardin County | 17.9% | 4.9%(+13.0)#23 | 5.1%(+12.9)#1,269 |
| 24. | Russellville | 17.6% | 4.9%(+12.7)#24 | 5.1%(+12.6)#1,302 |
| 25. | John Sevier | 17.6% | 4.9%(+12.7)#25 | 5.1%(+12.6)#1,303 |
| 26. | Dresden | 17.2% | 4.9%(+12.3)#26 | 5.1%(+12.2)#1,356 |
| 27. | Benton | 17.2% | 4.9%(+12.3)#27 | 5.1%(+12.1)#1,360 |
| 28. | Petersburg | 16.7% | 4.9%(+11.8)#28 | 5.1%(+11.6)#1,413 |
| 29. | Cottage Grove | 16.7% | 4.9%(+11.8)#29 | 5.1%(+11.6)#1,448 |
| 30. | Dyer | 16.1% | 4.9%(+11.2)#30 | 5.1%(+11.1)#1,500 |
| 31. | Erin | 16.1% | 4.9%(+11.2)#31 | 5.1%(+11.1)#1,501 |
| 32. | Lone Oak | 15.6% | 4.9%(+10.7)#32 | 5.1%(+10.5)#1,592 |
| 33. | Hornbeak | 15.0% | 4.9%(+10.1)#33 | 5.1%(+9.95)#1,690 |
| 34. | Hillsboro | 15.0% | 4.9%(+10.1)#34 | 5.1%(+9.95)#1,693 |
| 35. | Dodson Branch | 14.6% | 4.9%(+9.73)#35 | 5.1%(+9.58)#1,752 |
| 36. | Hampton | 14.0% | 4.9%(+9.08)#36 | 5.1%(+8.93)#1,910 |
| 37. | Charleston | 13.5% | 4.9%(+8.61)#37 | 5.1%(+8.46)#2,004 |
| 38. | Pleasant Hill | 13.4% | 4.9%(+8.53)#38 | 5.1%(+8.38)#2,020 |
| 39. | Winfield | 13.3% | 4.9%(+8.36)#39 | 5.1%(+8.21)#2,078 |
| 40. | Humboldt | 13.2% | 4.9%(+8.25)#40 | 5.1%(+8.11)#2,099 |
| 41. | New Union | 12.2% | 4.9%(+7.31)#41 | 5.1%(+7.16)#2,371 |
| 42. | Allardt | 12.1% | 4.9%(+7.21)#42 | 5.1%(+7.07)#2,405 |
| 43. | Ducktown | 11.9% | 4.9%(+7.00)#43 | 5.1%(+6.85)#2,492 |
| 44. | Guys | 11.1% | 4.9%(+6.20)#44 | 5.1%(+6.06)#2,796 |
| 45. | Unionville | 10.7% | 4.9%(+5.75)#45 | 5.1%(+5.61)#2,988 |
| 46. | Mount Pleasant | 10.5% | 4.9%(+5.62)#46 | 5.1%(+5.48)#3,051 |
| 47. | Roan Mountain | 10.2% | 4.9%(+5.31)#47 | 5.1%(+5.16)#3,241 |
| 48. | Toone | 10.0% | 4.9%(+5.09)#48 | 5.1%(+4.95)#3,374 |
| 49. | Pleasant View | 9.9% | 4.9%(+4.96)#49 | 5.1%(+4.81)#3,456 |
| 50. | Smithville | 9.6% | 4.9%(+4.68)#50 | 5.1%(+4.54)#3,604 |
| 51. | Gordonsville | 9.3% | 4.9%(+4.38)#51 | 5.1%(+4.23)#3,805 |
| 52. | Centertown | 9.1% | 4.9%(+4.18)#52 | 5.1%(+4.04)#3,959 |
| 53. | Tiptonville | 9.0% | 4.9%(+4.13)#53 | 5.1%(+3.98)#4,004 |
| 54. | Eastview | 9.0% | 4.9%(+4.08)#54 | 5.1%(+3.94)#4,036 |
| 55. | Yorkville | 8.9% | 4.9%(+3.98)#55 | 5.1%(+3.84)#4,104 |
| 56. | Hartsville Trousdale County | 8.7% | 4.9%(+3.81)#56 | 5.1%(+3.67)#4,231 |
| 57. | Gallaway | 8.7% | 4.9%(+3.79)#57 | 5.1%(+3.64)#4,249 |
| 58. | Cowan | 8.7% | 4.9%(+3.75)#58 | 5.1%(+3.61)#4,291 |
| 59. | Sewanee | 8.6% | 4.9%(+3.69)#59 | 5.1%(+3.55)#4,338 |
| 60. | Middle Valley | 8.6% | 4.9%(+3.67)#60 | 5.1%(+3.52)#4,348 |
| 61. | Townsend | 8.5% | 4.9%(+3.60)#61 | 5.1%(+3.46)#4,402 |
| 62. | Carthage | 8.3% | 4.9%(+3.41)#62 | 5.1%(+3.26)#4,609 |
| 63. | Greenfield | 8.3% | 4.9%(+3.39)#63 | 5.1%(+3.25)#4,614 |
| 64. | Hendersonville | 8.3% | 4.9%(+3.38)#64 | 5.1%(+3.24)#4,622 |
| 65. | South Fulton | 8.3% | 4.9%(+3.35)#65 | 5.1%(+3.21)#4,648 |
| 66. | New Tazewell | 8.2% | 4.9%(+3.33)#66 | 5.1%(+3.19)#4,669 |
| 67. | Gainesboro | 8.1% | 4.9%(+3.20)#67 | 5.1%(+3.06)#4,760 |
| 68. | Harriman | 8.1% | 4.9%(+3.18)#68 | 5.1%(+3.04)#4,781 |
| 69. | Burns | 8.1% | 4.9%(+3.14)#69 | 5.1%(+3.00)#4,810 |
| 70. | Oliver Springs | 8.0% | 4.9%(+3.11)#70 | 5.1%(+2.97)#4,835 |
| 71. | Strawberry Plains | 8.0% | 4.9%(+3.09)#71 | 5.1%(+2.95)#4,860 |
| 72. | Tusculum | 8.0% | 4.9%(+3.05)#72 | 5.1%(+2.90)#4,920 |
| 73. | Louisville | 7.8% | 4.9%(+2.94)#73 | 5.1%(+2.79)#5,023 |
| 74. | Pine Crest | 7.8% | 4.9%(+2.88)#74 | 5.1%(+2.74)#5,075 |
| 75. | Niota | 7.7% | 4.9%(+2.79)#75 | 5.1%(+2.64)#5,175 |
| 76. | Gadsden | 7.7% | 4.9%(+2.79)#76 | 5.1%(+2.64)#5,192 |
| 77. | Alcoa | 7.6% | 4.9%(+2.71)#77 | 5.1%(+2.57)#5,261 |
| 78. | Unicoi | 7.5% | 4.9%(+2.60)#78 | 5.1%(+2.45)#5,379 |
| 79. | Fayetteville | 7.5% | 4.9%(+2.59)#79 | 5.1%(+2.45)#5,383 |
| 80. | Walden | 7.5% | 4.9%(+2.56)#80 | 5.1%(+2.41)#5,425 |
| 81. | East Ridge | 7.4% | 4.9%(+2.53)#81 | 5.1%(+2.39)#5,455 |
| 82. | Crossville | 7.4% | 4.9%(+2.47)#82 | 5.1%(+2.33)#5,550 |
| 83. | Cleveland | 7.3% | 4.9%(+2.36)#83 | 5.1%(+2.22)#5,676 |
| 84. | Savannah | 7.3% | 4.9%(+2.36)#84 | 5.1%(+2.21)#5,679 |
| 85. | Watauga | 7.2% | 4.9%(+2.33)#85 | 5.1%(+2.19)#5,704 |
| 86. | Hohenwald | 7.2% | 4.9%(+2.28)#86 | 5.1%(+2.14)#5,762 |
| 87. | Garland | 7.1% | 4.9%(+2.24)#87 | 5.1%(+2.09)#5,852 |
| 88. | Friendsville | 7.1% | 4.9%(+2.15)#88 | 5.1%(+2.01)#5,961 |
| 89. | Red Bank | 7.0% | 4.9%(+2.12)#89 | 5.1%(+1.98)#6,002 |
| 90. | Lynnville | 7.0% | 4.9%(+2.11)#90 | 5.1%(+1.97)#6,016 |
| 91. | Cookeville | 7.0% | 4.9%(+2.06)#91 | 5.1%(+1.92)#6,082 |
| 92. | Forest Hills | 6.9% | 4.9%(+1.99)#92 | 5.1%(+1.85)#6,174 |
| 93. | Harrison | 6.9% | 4.9%(+1.97)#93 | 5.1%(+1.82)#6,216 |
| 94. | Monteagle | 6.8% | 4.9%(+1.94)#94 | 5.1%(+1.79)#6,256 |
| 95. | Lynchburg | 6.8% | 4.9%(+1.88)#95 | 5.1%(+1.74)#6,339 |
| 96. | Elizabethton | 6.8% | 4.9%(+1.86)#96 | 5.1%(+1.71)#6,377 |
| 97. | Maryville | 6.7% | 4.9%(+1.76)#97 | 5.1%(+1.62)#6,496 |
| 98. | Gladeville | 6.7% | 4.9%(+1.75)#98 | 5.1%(+1.60)#6,565 |
| 99. | Lebanon | 6.6% | 4.9%(+1.71)#99 | 5.1%(+1.57)#6,594 |
| 100. | Sneedville | 6.6% | 4.9%(+1.67)#100 | 5.1%(+1.53)#6,658 |
Common Questions
What are the Top 10 Cities with the Highest Percentage of Population with a Degree in Psychology in Tennessee?
Top 10 Cities with the Highest Percentage of Population with a Degree in Psychology in Tennessee are:
#1
100.0%
#2
50.0%
#3
31.9%
#4
31.2%
#5
30.9%
#6
28.2%
#7
27.1%
#8
26.1%
#9
26.0%
#10
23.9%
What city has the Highest Percentage of Population with a Degree in Psychology in Tennessee?
Elgin has the Highest Percentage of Population with a Degree in Psychology in Tennessee with 100.0%.
What is the Percentage of Population with a Degree in Psychology in the State of Tennessee?
Percentage of Population with a Degree in Psychology in Tennessee is 4.9%.
What is the Percentage of Population with a Degree in Psychology in the United States?
Percentage of Population with a Degree in Psychology in the United States is 5.1%.