Cities with the Highest Percentage of Population with a Degree in Psychology in North Carolina
RELATED REPORTS & OPTIONS
Psychology
North Carolina
Compare Cities
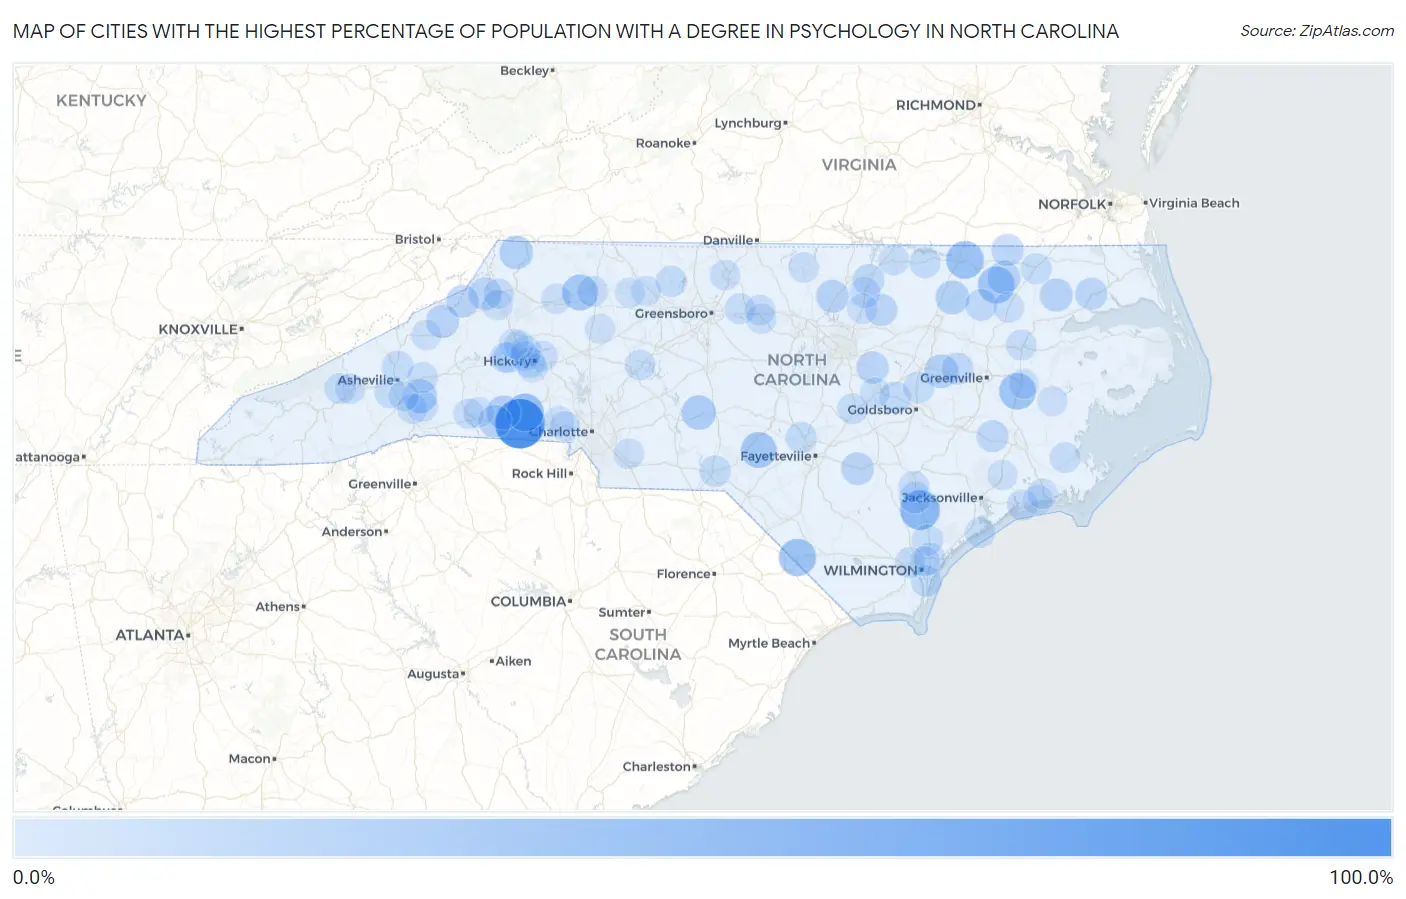
Map of Cities with the Highest Percentage of Population with a Degree in Psychology in North Carolina
0.0%
100.0%
Cities with the Highest Percentage of Population with a Degree in Psychology in North Carolina
| City | % Graduates | vs State | vs National | |
| 1. | Light Oak | 100.0% | 5.2%(+94.8)#1 | 5.1%(+94.9)#4 |
| 2. | Watha | 52.9% | 5.2%(+47.8)#2 | 5.1%(+47.9)#146 |
| 3. | Waco | 43.9% | 5.2%(+38.7)#3 | 5.1%(+38.9)#259 |
| 4. | Garysburg | 42.9% | 5.2%(+37.7)#4 | 5.1%(+37.9)#265 |
| 5. | Fair Bluff | 41.4% | 5.2%(+36.2)#5 | 5.1%(+36.3)#288 |
| 6. | Rich Square | 39.7% | 5.2%(+34.5)#6 | 5.1%(+34.6)#318 |
| 7. | Chocowinity | 39.0% | 5.2%(+33.8)#7 | 5.1%(+34.0)#325 |
| 8. | Ronda | 35.2% | 5.2%(+30.0)#8 | 5.1%(+30.1)#385 |
| 9. | Ashley Heights | 34.2% | 5.2%(+29.0)#9 | 5.1%(+29.2)#396 |
| 10. | Troy | 28.7% | 5.2%(+23.5)#10 | 5.1%(+23.6)#524 |
| 11. | Kingstown | 27.3% | 5.2%(+22.1)#11 | 5.1%(+22.2)#586 |
| 12. | Gerton | 26.5% | 5.2%(+21.3)#12 | 5.1%(+21.4)#620 |
| 13. | Enfield | 25.7% | 5.2%(+20.5)#13 | 5.1%(+20.7)#654 |
| 14. | Lansing | 25.0% | 5.2%(+19.8)#14 | 5.1%(+19.9)#691 |
| 15. | Saratoga | 24.6% | 5.2%(+19.4)#15 | 5.1%(+19.6)#732 |
| 16. | Colerain | 22.6% | 5.2%(+17.4)#16 | 5.1%(+17.5)#837 |
| 17. | Woodland | 22.4% | 5.2%(+17.2)#17 | 5.1%(+17.3)#849 |
| 18. | Stem | 21.8% | 5.2%(+16.7)#18 | 5.1%(+16.8)#891 |
| 19. | Bakersville | 21.7% | 5.2%(+16.5)#19 | 5.1%(+16.6)#902 |
| 20. | Valle Crucis | 21.4% | 5.2%(+16.2)#20 | 5.1%(+16.4)#928 |
| 21. | Mooresboro | 21.1% | 5.2%(+15.9)#21 | 5.1%(+16.0)#957 |
| 22. | Roseboro | 21.0% | 5.2%(+15.8)#22 | 5.1%(+15.9)#962 |
| 23. | Elk Park | 20.3% | 5.2%(+15.1)#23 | 5.1%(+15.2)#1,012 |
| 24. | Governors | 18.5% | 5.2%(+13.3)#24 | 5.1%(+13.4)#1,208 |
| 25. | Severn | 18.2% | 5.2%(+13.0)#25 | 5.1%(+13.1)#1,242 |
| 26. | Archer Lodge | 17.8% | 5.2%(+12.6)#26 | 5.1%(+12.8)#1,284 |
| 27. | Winfall | 17.7% | 5.2%(+12.5)#27 | 5.1%(+12.6)#1,298 |
| 28. | Louisburg | 17.7% | 5.2%(+12.5)#28 | 5.1%(+12.6)#1,299 |
| 29. | Wallace | 16.8% | 5.2%(+11.7)#29 | 5.1%(+11.8)#1,386 |
| 30. | Fountain | 16.7% | 5.2%(+11.5)#30 | 5.1%(+11.6)#1,425 |
| 31. | Cove City | 16.3% | 5.2%(+11.2)#31 | 5.1%(+11.3)#1,476 |
| 32. | South Henderson | 16.0% | 5.2%(+10.8)#32 | 5.1%(+10.9)#1,523 |
| 33. | Scotland Neck | 15.8% | 5.2%(+10.6)#33 | 5.1%(+10.7)#1,568 |
| 34. | Princeton | 15.7% | 5.2%(+10.5)#34 | 5.1%(+10.7)#1,575 |
| 35. | Rockingham | 14.8% | 5.2%(+9.56)#35 | 5.1%(+9.70)#1,730 |
| 36. | Brandywine Bay | 14.2% | 5.2%(+9.04)#36 | 5.1%(+9.18)#1,865 |
| 37. | Northchase | 14.2% | 5.2%(+8.99)#37 | 5.1%(+9.13)#1,868 |
| 38. | Fremont | 14.2% | 5.2%(+8.96)#38 | 5.1%(+9.10)#1,870 |
| 39. | Weaverville | 14.1% | 5.2%(+8.90)#39 | 5.1%(+9.04)#1,880 |
| 40. | Walnut Cove | 13.9% | 5.2%(+8.68)#40 | 5.1%(+8.82)#1,932 |
| 41. | Winton | 13.5% | 5.2%(+8.33)#41 | 5.1%(+8.46)#2,003 |
| 42. | Bent Creek | 13.5% | 5.2%(+8.26)#42 | 5.1%(+8.40)#2,017 |
| 43. | Littleton | 13.2% | 5.2%(+8.05)#43 | 5.1%(+8.18)#2,085 |
| 44. | Rocky Point | 13.2% | 5.2%(+8.02)#44 | 5.1%(+8.16)#2,093 |
| 45. | Edneyville | 12.9% | 5.2%(+7.74)#45 | 5.1%(+7.87)#2,149 |
| 46. | Valdese | 12.7% | 5.2%(+7.55)#46 | 5.1%(+7.68)#2,197 |
| 47. | Silver Lake | 12.7% | 5.2%(+7.54)#47 | 5.1%(+7.67)#2,201 |
| 48. | Spring Lake | 12.7% | 5.2%(+7.53)#48 | 5.1%(+7.66)#2,203 |
| 49. | Black Mountain | 12.7% | 5.2%(+7.46)#49 | 5.1%(+7.60)#2,221 |
| 50. | Kittrell | 12.5% | 5.2%(+7.31)#50 | 5.1%(+7.45)#2,295 |
| 51. | Navassa | 12.4% | 5.2%(+7.26)#51 | 5.1%(+7.39)#2,305 |
| 52. | Jonesville | 12.3% | 5.2%(+7.12)#52 | 5.1%(+7.26)#2,338 |
| 53. | Cape Carteret | 12.2% | 5.2%(+6.98)#53 | 5.1%(+7.11)#2,386 |
| 54. | Williamston | 12.1% | 5.2%(+6.96)#54 | 5.1%(+7.10)#2,396 |
| 55. | Maggie Valley | 12.1% | 5.2%(+6.91)#55 | 5.1%(+7.05)#2,413 |
| 56. | Granite Falls | 12.0% | 5.2%(+6.85)#56 | 5.1%(+6.98)#2,433 |
| 57. | Benson | 11.8% | 5.2%(+6.62)#57 | 5.1%(+6.76)#2,523 |
| 58. | Oriental | 11.7% | 5.2%(+6.53)#58 | 5.1%(+6.67)#2,564 |
| 59. | Cherry Branch | 11.7% | 5.2%(+6.47)#59 | 5.1%(+6.61)#2,583 |
| 60. | Spencer | 11.6% | 5.2%(+6.41)#60 | 5.1%(+6.54)#2,602 |
| 61. | Gibsonville | 11.6% | 5.2%(+6.38)#61 | 5.1%(+6.51)#2,615 |
| 62. | Norlina | 11.5% | 5.2%(+6.32)#62 | 5.1%(+6.46)#2,641 |
| 63. | Lewiston Woodville | 11.5% | 5.2%(+6.29)#63 | 5.1%(+6.42)#2,656 |
| 64. | Grandy | 11.3% | 5.2%(+6.07)#64 | 5.1%(+6.21)#2,738 |
| 65. | Rose Hill | 11.1% | 5.2%(+5.92)#65 | 5.1%(+6.06)#2,774 |
| 66. | St Stephens | 11.1% | 5.2%(+5.88)#66 | 5.1%(+6.02)#2,832 |
| 67. | Haw River | 11.0% | 5.2%(+5.84)#67 | 5.1%(+5.98)#2,840 |
| 68. | Blowing Rock | 10.9% | 5.2%(+5.76)#68 | 5.1%(+5.90)#2,872 |
| 69. | North Topsail Beach | 10.9% | 5.2%(+5.74)#69 | 5.1%(+5.87)#2,878 |
| 70. | Bostic | 10.9% | 5.2%(+5.68)#70 | 5.1%(+5.82)#2,907 |
| 71. | Unionville | 10.8% | 5.2%(+5.57)#71 | 5.1%(+5.71)#2,953 |
| 72. | Spindale | 10.5% | 5.2%(+5.36)#72 | 5.1%(+5.50)#3,045 |
| 73. | Franklinton | 10.5% | 5.2%(+5.32)#73 | 5.1%(+5.46)#3,083 |
| 74. | Roxboro | 10.4% | 5.2%(+5.22)#74 | 5.1%(+5.35)#3,132 |
| 75. | Drexel | 10.3% | 5.2%(+5.10)#75 | 5.1%(+5.24)#3,201 |
| 76. | Fruitland | 10.3% | 5.2%(+5.06)#76 | 5.1%(+5.20)#3,220 |
| 77. | Long View | 10.2% | 5.2%(+5.06)#77 | 5.1%(+5.20)#3,221 |
| 78. | Boone | 10.2% | 5.2%(+5.04)#78 | 5.1%(+5.18)#3,236 |
| 79. | Broad Creek | 10.2% | 5.2%(+5.00)#79 | 5.1%(+5.14)#3,257 |
| 80. | Ranlo | 10.2% | 5.2%(+4.98)#80 | 5.1%(+5.12)#3,267 |
| 81. | Lake Junaluska | 10.1% | 5.2%(+4.92)#81 | 5.1%(+5.06)#3,300 |
| 82. | Swepsonville | 10.1% | 5.2%(+4.92)#82 | 5.1%(+5.05)#3,302 |
| 83. | Reidsville | 10.0% | 5.2%(+4.84)#83 | 5.1%(+4.98)#3,340 |
| 84. | Newport | 9.8% | 5.2%(+4.62)#84 | 5.1%(+4.75)#3,484 |
| 85. | Royal Pines | 9.8% | 5.2%(+4.57)#85 | 5.1%(+4.71)#3,513 |
| 86. | Mcadenville | 9.7% | 5.2%(+4.50)#86 | 5.1%(+4.64)#3,538 |
| 87. | Rhodhiss | 9.7% | 5.2%(+4.49)#87 | 5.1%(+4.63)#3,546 |
| 88. | Washington | 9.6% | 5.2%(+4.41)#88 | 5.1%(+4.54)#3,596 |
| 89. | Mountain View | 9.6% | 5.2%(+4.38)#89 | 5.1%(+4.52)#3,612 |
| 90. | Harmony | 9.4% | 5.2%(+4.25)#90 | 5.1%(+4.38)#3,697 |
| 91. | Tobaccoville | 9.4% | 5.2%(+4.16)#91 | 5.1%(+4.30)#3,755 |
| 92. | Burnsville | 9.3% | 5.2%(+4.16)#92 | 5.1%(+4.29)#3,761 |
| 93. | East Bend | 9.3% | 5.2%(+4.11)#93 | 5.1%(+4.25)#3,792 |
| 94. | North Wilkesboro | 9.3% | 5.2%(+4.10)#94 | 5.1%(+4.24)#3,803 |
| 95. | Bayview | 9.2% | 5.2%(+4.02)#95 | 5.1%(+4.16)#3,854 |
| 96. | Cajah S Mountain | 9.1% | 5.2%(+3.94)#96 | 5.1%(+4.08)#3,904 |
| 97. | Maysville | 9.0% | 5.2%(+3.79)#97 | 5.1%(+3.92)#4,044 |
| 98. | Hudson | 9.0% | 5.2%(+3.78)#98 | 5.1%(+3.91)#4,054 |
| 99. | Smithfield | 8.9% | 5.2%(+3.72)#99 | 5.1%(+3.86)#4,092 |
| 100. | Wrightsboro | 8.9% | 5.2%(+3.71)#100 | 5.1%(+3.84)#4,098 |
Common Questions
What are the Top 10 Cities with the Highest Percentage of Population with a Degree in Psychology in North Carolina?
Top 10 Cities with the Highest Percentage of Population with a Degree in Psychology in North Carolina are:
#1
100.0%
#2
52.9%
#3
43.9%
#4
42.9%
#5
41.4%
#6
39.7%
#7
39.0%
#8
35.2%
#9
34.2%
#10
28.7%
What city has the Highest Percentage of Population with a Degree in Psychology in North Carolina?
Light Oak has the Highest Percentage of Population with a Degree in Psychology in North Carolina with 100.0%.
What is the Percentage of Population with a Degree in Psychology in the State of North Carolina?
Percentage of Population with a Degree in Psychology in North Carolina is 5.2%.
What is the Percentage of Population with a Degree in Psychology in the United States?
Percentage of Population with a Degree in Psychology in the United States is 5.1%.