Cities with the Highest Percentage of Population with a Degree in Psychology in South Carolina
RELATED REPORTS & OPTIONS
Psychology
South Carolina
Compare Cities
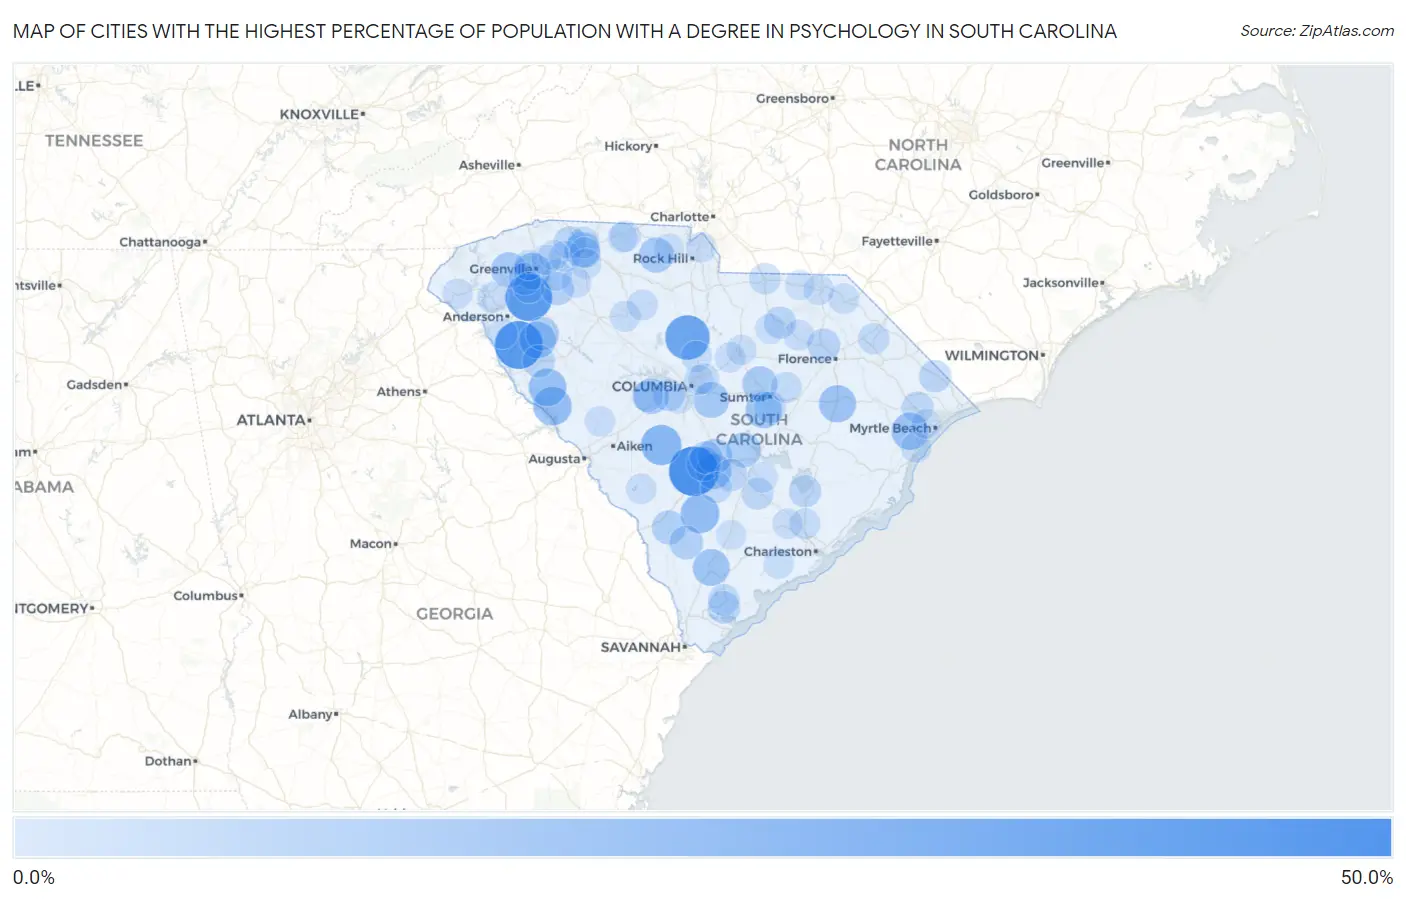
Map of Cities with the Highest Percentage of Population with a Degree in Psychology in South Carolina
0.0%
50.0%
Cities with the Highest Percentage of Population with a Degree in Psychology in South Carolina
| City | % Graduates | vs State | vs National | |
| 1. | Green Sea | 50.0% | 5.1%(+44.9)#1 | 5.1%(+44.9)#198 |
| 2. | Cope | 50.0% | 5.1%(+44.9)#2 | 5.1%(+44.9)#206 |
| 3. | Antreville | 45.9% | 5.1%(+40.9)#3 | 5.1%(+40.9)#237 |
| 4. | Pelzer | 44.0% | 5.1%(+38.9)#4 | 5.1%(+38.9)#257 |
| 5. | Winnsboro Mills | 38.6% | 5.1%(+33.6)#5 | 5.1%(+33.6)#329 |
| 6. | Salley | 28.6% | 5.1%(+23.5)#6 | 5.1%(+23.5)#532 |
| 7. | Lodge | 25.0% | 5.1%(+19.9)#7 | 5.1%(+19.9)#700 |
| 8. | Plum Branch | 24.4% | 5.1%(+19.3)#8 | 5.1%(+19.3)#741 |
| 9. | Dacusville | 24.0% | 5.1%(+18.9)#9 | 5.1%(+18.9)#759 |
| 10. | Arkwright | 23.7% | 5.1%(+18.6)#10 | 5.1%(+18.6)#778 |
| 11. | Troy | 23.1% | 5.1%(+18.0)#11 | 5.1%(+18.0)#811 |
| 12. | Bucksport | 21.8% | 5.1%(+16.8)#12 | 5.1%(+16.8)#892 |
| 13. | Lake City | 21.4% | 5.1%(+16.4)#13 | 5.1%(+16.4)#916 |
| 14. | Yemassee | 20.7% | 5.1%(+15.6)#14 | 5.1%(+15.6)#984 |
| 15. | Due West | 20.6% | 5.1%(+15.5)#15 | 5.1%(+15.5)#993 |
| 16. | Judson | 20.3% | 5.1%(+15.2)#16 | 5.1%(+15.2)#1,017 |
| 17. | Privateer | 20.0% | 5.1%(+14.9)#17 | 5.1%(+14.9)#1,028 |
| 18. | Clemson University | 19.0% | 5.1%(+14.0)#18 | 5.1%(+14.0)#1,142 |
| 19. | Hopkins | 18.7% | 5.1%(+13.6)#19 | 5.1%(+13.6)#1,185 |
| 20. | Gilbert | 18.1% | 5.1%(+13.0)#20 | 5.1%(+13.0)#1,256 |
| 21. | Arial | 17.9% | 5.1%(+12.8)#21 | 5.1%(+12.9)#1,273 |
| 22. | Southern Shops | 17.7% | 5.1%(+12.6)#22 | 5.1%(+12.7)#1,294 |
| 23. | Rowesville | 17.6% | 5.1%(+12.6)#23 | 5.1%(+12.6)#1,309 |
| 24. | Sharon | 17.4% | 5.1%(+12.3)#24 | 5.1%(+12.3)#1,333 |
| 25. | Dalzell | 16.9% | 5.1%(+11.8)#25 | 5.1%(+11.8)#1,381 |
| 26. | Elloree | 16.7% | 5.1%(+11.6)#26 | 5.1%(+11.6)#1,401 |
| 27. | Wilkinson Heights | 16.6% | 5.1%(+11.5)#27 | 5.1%(+11.5)#1,456 |
| 28. | Cordova | 16.0% | 5.1%(+10.9)#28 | 5.1%(+10.9)#1,527 |
| 29. | Dale | 15.6% | 5.1%(+10.5)#29 | 5.1%(+10.5)#1,591 |
| 30. | Chickasaw Point | 15.1% | 5.1%(+10.1)#30 | 5.1%(+10.1)#1,674 |
| 31. | Fairfax | 14.5% | 5.1%(+9.46)#31 | 5.1%(+9.49)#1,779 |
| 32. | Varnville | 14.0% | 5.1%(+8.89)#32 | 5.1%(+8.92)#1,911 |
| 33. | Olympia | 13.5% | 5.1%(+8.43)#33 | 5.1%(+8.46)#2,000 |
| 34. | Donalds | 13.3% | 5.1%(+8.25)#34 | 5.1%(+8.28)#2,053 |
| 35. | Fountain Inn | 12.6% | 5.1%(+7.50)#35 | 5.1%(+7.53)#2,239 |
| 36. | Darlington | 12.3% | 5.1%(+7.25)#36 | 5.1%(+7.28)#2,334 |
| 37. | Edisto | 12.1% | 5.1%(+7.04)#37 | 5.1%(+7.07)#2,402 |
| 38. | Camp Croft | 12.0% | 5.1%(+6.94)#38 | 5.1%(+6.98)#2,437 |
| 39. | Inman Mills | 11.5% | 5.1%(+6.39)#39 | 5.1%(+6.42)#2,653 |
| 40. | Abbeville | 11.5% | 5.1%(+6.37)#40 | 5.1%(+6.40)#2,662 |
| 41. | Red Bank | 11.3% | 5.1%(+6.26)#41 | 5.1%(+6.29)#2,708 |
| 42. | Shell Point | 11.3% | 5.1%(+6.18)#42 | 5.1%(+6.21)#2,735 |
| 43. | Bowman | 11.1% | 5.1%(+6.03)#43 | 5.1%(+6.06)#2,785 |
| 44. | Debordieu Colony | 10.9% | 5.1%(+5.77)#44 | 5.1%(+5.81)#2,914 |
| 45. | Mcbee | 10.8% | 5.1%(+5.71)#45 | 5.1%(+5.74)#2,937 |
| 46. | Pinopolis | 10.8% | 5.1%(+5.67)#46 | 5.1%(+5.70)#2,956 |
| 47. | Loris | 10.7% | 5.1%(+5.60)#47 | 5.1%(+5.64)#2,980 |
| 48. | Powdersville | 10.6% | 5.1%(+5.55)#48 | 5.1%(+5.59)#2,998 |
| 49. | Conestee | 10.6% | 5.1%(+5.52)#49 | 5.1%(+5.55)#3,014 |
| 50. | North Santee | 10.1% | 5.1%(+4.99)#50 | 5.1%(+5.03)#3,313 |
| 51. | Conway | 10.1% | 5.1%(+4.98)#51 | 5.1%(+5.01)#3,324 |
| 52. | Harleyville | 10.0% | 5.1%(+4.91)#52 | 5.1%(+4.95)#3,354 |
| 53. | Lakewood | 9.8% | 5.1%(+4.71)#53 | 5.1%(+4.74)#3,497 |
| 54. | Burton | 9.5% | 5.1%(+4.43)#54 | 5.1%(+4.47)#3,654 |
| 55. | Boiling Springs | 9.1% | 5.1%(+4.01)#55 | 5.1%(+4.04)#3,920 |
| 56. | Pageland | 9.0% | 5.1%(+3.92)#56 | 5.1%(+3.95)#4,020 |
| 57. | Latta | 8.9% | 5.1%(+3.85)#57 | 5.1%(+3.89)#4,070 |
| 58. | Summit | 8.8% | 5.1%(+3.69)#58 | 5.1%(+3.72)#4,195 |
| 59. | Five Forks | 8.7% | 5.1%(+3.57)#59 | 5.1%(+3.60)#4,296 |
| 60. | Mayesville | 8.5% | 5.1%(+3.43)#60 | 5.1%(+3.46)#4,400 |
| 61. | Duncan | 8.3% | 5.1%(+3.26)#61 | 5.1%(+3.29)#4,531 |
| 62. | Branchville | 8.3% | 5.1%(+3.25)#62 | 5.1%(+3.28)#4,545 |
| 63. | Piedmont | 8.2% | 5.1%(+3.16)#63 | 5.1%(+3.19)#4,662 |
| 64. | Blythewood | 8.2% | 5.1%(+3.10)#64 | 5.1%(+3.13)#4,707 |
| 65. | Saxon | 8.0% | 5.1%(+2.88)#65 | 5.1%(+2.92)#4,912 |
| 66. | Hartsville | 7.8% | 5.1%(+2.69)#66 | 5.1%(+2.72)#5,087 |
| 67. | Woodfield | 7.8% | 5.1%(+2.69)#67 | 5.1%(+2.72)#5,088 |
| 68. | Whitmire | 7.7% | 5.1%(+2.61)#68 | 5.1%(+2.64)#5,170 |
| 69. | Carlisle | 7.7% | 5.1%(+2.61)#69 | 5.1%(+2.64)#5,180 |
| 70. | Goose Creek | 7.7% | 5.1%(+2.57)#70 | 5.1%(+2.61)#5,232 |
| 71. | East Gaffney | 7.6% | 5.1%(+2.51)#71 | 5.1%(+2.54)#5,287 |
| 72. | Bennettsville | 7.6% | 5.1%(+2.48)#72 | 5.1%(+2.51)#5,316 |
| 73. | The Cliffs Valley | 7.5% | 5.1%(+2.45)#73 | 5.1%(+2.49)#5,346 |
| 74. | Westminster | 7.3% | 5.1%(+2.26)#74 | 5.1%(+2.30)#5,584 |
| 75. | Cheraw | 7.2% | 5.1%(+2.15)#75 | 5.1%(+2.19)#5,705 |
| 76. | Murrells Inlet | 7.2% | 5.1%(+2.11)#76 | 5.1%(+2.14)#5,764 |
| 77. | Trenton | 7.1% | 5.1%(+2.06)#77 | 5.1%(+2.09)#5,849 |
| 78. | Snelling | 7.1% | 5.1%(+2.06)#78 | 5.1%(+2.09)#5,857 |
| 79. | Pendleton | 7.1% | 5.1%(+2.04)#79 | 5.1%(+2.08)#5,877 |
| 80. | Summerville | 7.0% | 5.1%(+1.89)#80 | 5.1%(+1.93)#6,062 |
| 81. | York | 7.0% | 5.1%(+1.89)#81 | 5.1%(+1.92)#6,078 |
| 82. | Starr | 6.9% | 5.1%(+1.81)#82 | 5.1%(+1.85)#6,191 |
| 83. | Roebuck | 6.8% | 5.1%(+1.73)#83 | 5.1%(+1.77)#6,298 |
| 84. | Berea | 6.8% | 5.1%(+1.71)#84 | 5.1%(+1.75)#6,323 |
| 85. | Fort Mill | 6.8% | 5.1%(+1.71)#85 | 5.1%(+1.75)#6,324 |
| 86. | Holly Hill | 6.8% | 5.1%(+1.70)#86 | 5.1%(+1.74)#6,337 |
| 87. | Lugoff | 6.7% | 5.1%(+1.66)#87 | 5.1%(+1.69)#6,407 |
| 88. | Woodruff | 6.7% | 5.1%(+1.63)#88 | 5.1%(+1.67)#6,436 |
| 89. | Greer | 6.7% | 5.1%(+1.62)#89 | 5.1%(+1.66)#6,456 |
| 90. | Camden | 6.7% | 5.1%(+1.60)#90 | 5.1%(+1.64)#6,472 |
| 91. | Meggett | 6.6% | 5.1%(+1.55)#91 | 5.1%(+1.59)#6,578 |
| 92. | Gaffney | 6.6% | 5.1%(+1.48)#92 | 5.1%(+1.52)#6,680 |
| 93. | Bethune | 6.6% | 5.1%(+1.47)#93 | 5.1%(+1.51)#6,700 |
| 94. | South Congaree | 6.5% | 5.1%(+1.43)#94 | 5.1%(+1.46)#6,772 |
| 95. | Forestbrook | 6.4% | 5.1%(+1.30)#95 | 5.1%(+1.34)#6,992 |
| 96. | Forest Acres | 6.4% | 5.1%(+1.30)#96 | 5.1%(+1.34)#6,995 |
| 97. | Walterboro | 6.4% | 5.1%(+1.30)#97 | 5.1%(+1.33)#7,000 |
| 98. | Taylors | 6.3% | 5.1%(+1.26)#98 | 5.1%(+1.29)#7,067 |
| 99. | Chesterfield | 6.3% | 5.1%(+1.20)#99 | 5.1%(+1.24)#7,153 |
| 100. | Ben Avon | 6.3% | 5.1%(+1.19)#100 | 5.1%(+1.22)#7,179 |
Common Questions
What are the Top 10 Cities with the Highest Percentage of Population with a Degree in Psychology in South Carolina?
Top 10 Cities with the Highest Percentage of Population with a Degree in Psychology in South Carolina are:
#1
50.0%
#2
45.9%
#3
44.0%
#4
38.6%
#5
28.6%
#6
25.0%
#7
24.4%
#8
23.1%
#9
21.8%
#10
21.4%
What city has the Highest Percentage of Population with a Degree in Psychology in South Carolina?
Cope has the Highest Percentage of Population with a Degree in Psychology in South Carolina with 50.0%.
What is the Percentage of Population with a Degree in Psychology in the State of South Carolina?
Percentage of Population with a Degree in Psychology in South Carolina is 5.1%.
What is the Percentage of Population with a Degree in Psychology in the United States?
Percentage of Population with a Degree in Psychology in the United States is 5.1%.