Cities with the Highest Percentage of Population with a Degree in Psychology in Minnesota
RELATED REPORTS & OPTIONS
Psychology
Minnesota
Compare Cities
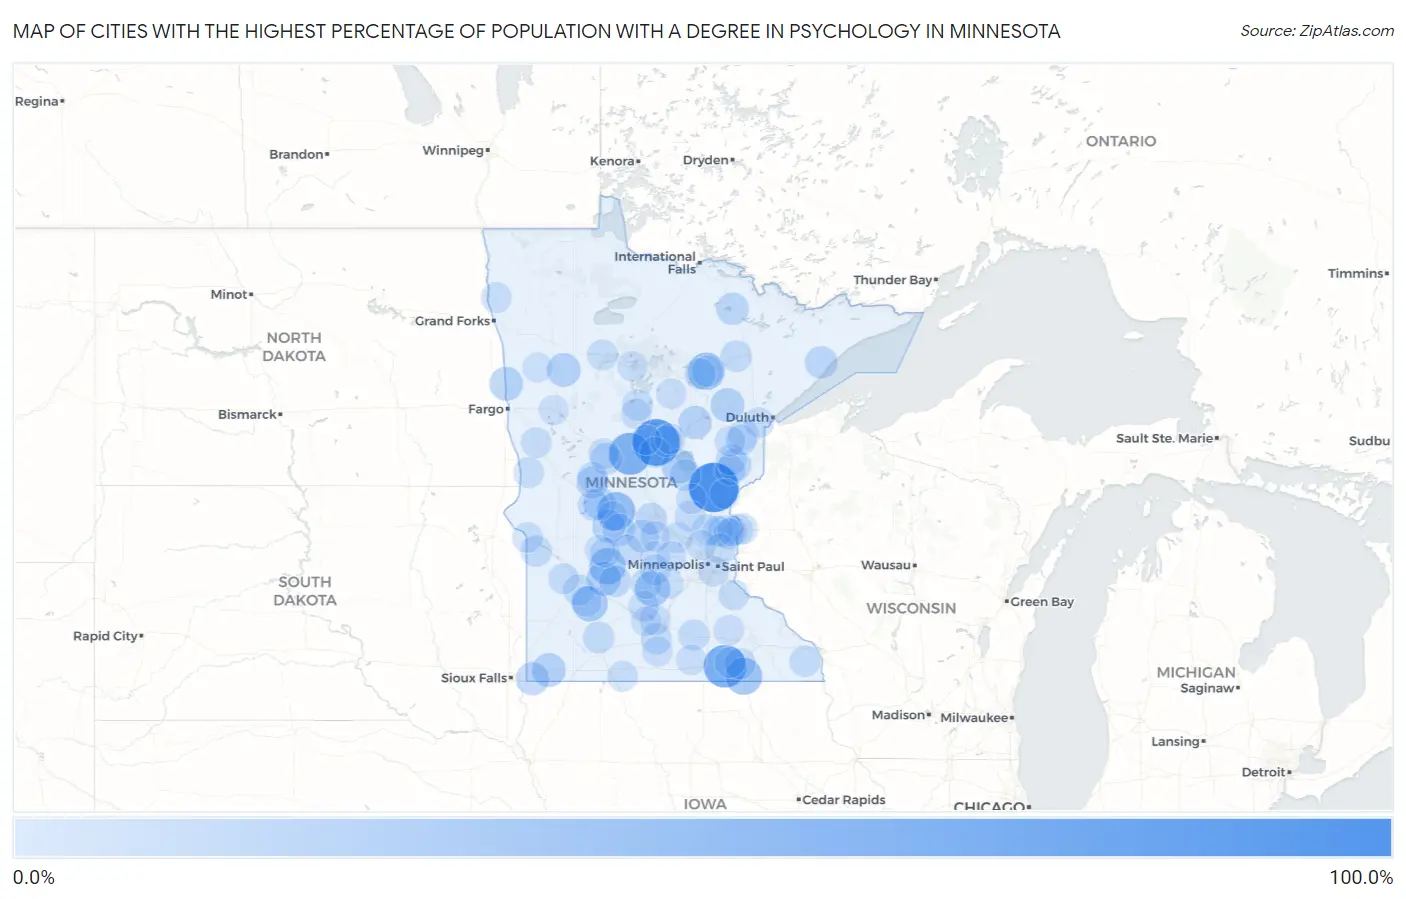
Map of Cities with the Highest Percentage of Population with a Degree in Psychology in Minnesota
0.0%
100.0%
Cities with the Highest Percentage of Population with a Degree in Psychology in Minnesota
| City | % Graduates | vs State | vs National | |
| 1. | Quamba | 100.0% | 5.1%(+94.9)#1 | 5.1%(+94.9)#44 |
| 2. | Merrifield | 86.7% | 5.1%(+81.6)#2 | 5.1%(+81.6)#54 |
| 3. | Mapleview | 66.7% | 5.1%(+61.6)#3 | 5.1%(+61.6)#87 |
| 4. | Motley | 63.6% | 5.1%(+58.5)#4 | 5.1%(+58.6)#103 |
| 5. | Meire Grove | 46.2% | 5.1%(+41.1)#5 | 5.1%(+41.1)#236 |
| 6. | Marble | 41.4% | 5.1%(+36.3)#6 | 5.1%(+36.3)#287 |
| 7. | Taopi | 40.0% | 5.1%(+34.9)#7 | 5.1%(+34.9)#316 |
| 8. | Blomkest | 37.5% | 5.1%(+32.4)#8 | 5.1%(+32.4)#345 |
| 9. | St Anthony City Stearns County | 37.5% | 5.1%(+32.4)#9 | 5.1%(+32.4)#349 |
| 10. | New Auburn | 33.3% | 5.1%(+28.2)#10 | 5.1%(+28.3)#410 |
| 11. | Seaforth | 33.3% | 5.1%(+28.2)#11 | 5.1%(+28.3)#427 |
| 12. | Vineland | 27.6% | 5.1%(+22.5)#12 | 5.1%(+22.5)#579 |
| 13. | Danube | 27.6% | 5.1%(+22.5)#13 | 5.1%(+22.5)#580 |
| 14. | Floodwood | 26.1% | 5.1%(+21.0)#14 | 5.1%(+21.0)#639 |
| 15. | Magnolia | 25.0% | 5.1%(+19.9)#15 | 5.1%(+19.9)#697 |
| 16. | Perley | 25.0% | 5.1%(+19.9)#16 | 5.1%(+19.9)#710 |
| 17. | Beaulieu | 25.0% | 5.1%(+19.9)#17 | 5.1%(+19.9)#719 |
| 18. | Palisade | 23.1% | 5.1%(+18.0)#18 | 5.1%(+18.0)#813 |
| 19. | Hills | 22.7% | 5.1%(+17.6)#19 | 5.1%(+17.6)#834 |
| 20. | Belgrade | 21.9% | 5.1%(+16.8)#20 | 5.1%(+16.9)#889 |
| 21. | Askov | 20.7% | 5.1%(+15.6)#21 | 5.1%(+15.6)#986 |
| 22. | Finland | 20.0% | 5.1%(+14.9)#22 | 5.1%(+14.9)#1,051 |
| 23. | Westport | 20.0% | 5.1%(+14.9)#23 | 5.1%(+14.9)#1,064 |
| 24. | Regal | 20.0% | 5.1%(+14.9)#24 | 5.1%(+14.9)#1,065 |
| 25. | Watkins | 19.4% | 5.1%(+14.3)#25 | 5.1%(+14.4)#1,106 |
| 26. | Orr | 18.8% | 5.1%(+13.7)#26 | 5.1%(+13.7)#1,171 |
| 27. | Carlos | 18.2% | 5.1%(+13.1)#27 | 5.1%(+13.1)#1,235 |
| 28. | Waite Park | 16.2% | 5.1%(+11.1)#28 | 5.1%(+11.1)#1,497 |
| 29. | Bertha | 15.9% | 5.1%(+10.8)#29 | 5.1%(+10.9)#1,533 |
| 30. | Bird Island | 15.6% | 5.1%(+10.5)#30 | 5.1%(+10.6)#1,582 |
| 31. | Stacy | 15.4% | 5.1%(+10.3)#31 | 5.1%(+10.4)#1,613 |
| 32. | Buhl | 15.4% | 5.1%(+10.3)#32 | 5.1%(+10.3)#1,619 |
| 33. | Jeffers | 15.4% | 5.1%(+10.3)#33 | 5.1%(+10.3)#1,626 |
| 34. | Villard | 15.4% | 5.1%(+10.3)#34 | 5.1%(+10.3)#1,630 |
| 35. | Dexter | 14.8% | 5.1%(+9.72)#35 | 5.1%(+9.76)#1,721 |
| 36. | Onamia | 14.7% | 5.1%(+9.61)#36 | 5.1%(+9.65)#1,732 |
| 37. | Bethel | 14.3% | 5.1%(+9.19)#37 | 5.1%(+9.23)#1,824 |
| 38. | Calumet | 14.3% | 5.1%(+9.19)#38 | 5.1%(+9.23)#1,838 |
| 39. | Bellingham | 14.3% | 5.1%(+9.19)#39 | 5.1%(+9.23)#1,846 |
| 40. | Hackensack | 14.0% | 5.1%(+8.86)#40 | 5.1%(+8.90)#1,917 |
| 41. | Bovey | 13.8% | 5.1%(+8.75)#41 | 5.1%(+8.80)#1,937 |
| 42. | Ironton | 13.8% | 5.1%(+8.75)#42 | 5.1%(+8.80)#1,938 |
| 43. | Houston | 13.8% | 5.1%(+8.73)#43 | 5.1%(+8.78)#1,940 |
| 44. | Garden City | 13.8% | 5.1%(+8.70)#44 | 5.1%(+8.74)#1,944 |
| 45. | Brainerd | 13.5% | 5.1%(+8.43)#45 | 5.1%(+8.48)#1,997 |
| 46. | Wood Lake | 13.3% | 5.1%(+8.24)#46 | 5.1%(+8.28)#2,052 |
| 47. | Waseca | 13.3% | 5.1%(+8.22)#47 | 5.1%(+8.26)#2,073 |
| 48. | Miltona | 12.8% | 5.1%(+7.67)#48 | 5.1%(+7.71)#2,192 |
| 49. | Clarkfield | 12.6% | 5.1%(+7.55)#49 | 5.1%(+7.59)#2,222 |
| 50. | Vesta | 12.5% | 5.1%(+7.40)#50 | 5.1%(+7.45)#2,270 |
| 51. | Hewitt | 12.5% | 5.1%(+7.40)#51 | 5.1%(+7.45)#2,274 |
| 52. | Rutledge | 12.5% | 5.1%(+7.40)#52 | 5.1%(+7.45)#2,278 |
| 53. | Monticello | 12.4% | 5.1%(+7.26)#53 | 5.1%(+7.31)#2,328 |
| 54. | Shafer | 12.2% | 5.1%(+7.15)#54 | 5.1%(+7.19)#2,359 |
| 55. | Nicollet | 12.2% | 5.1%(+7.13)#55 | 5.1%(+7.17)#2,366 |
| 56. | Taylors Falls | 12.1% | 5.1%(+7.03)#56 | 5.1%(+7.07)#2,404 |
| 57. | Lafayette | 12.1% | 5.1%(+7.03)#57 | 5.1%(+7.07)#2,408 |
| 58. | Rothsay | 12.1% | 5.1%(+7.03)#58 | 5.1%(+7.07)#2,409 |
| 59. | Martin Lake | 12.0% | 5.1%(+6.90)#59 | 5.1%(+6.95)#2,449 |
| 60. | Solway | 12.0% | 5.1%(+6.90)#60 | 5.1%(+6.95)#2,463 |
| 61. | Alvarado | 11.9% | 5.1%(+6.81)#61 | 5.1%(+6.85)#2,493 |
| 62. | Princeton | 11.8% | 5.1%(+6.73)#62 | 5.1%(+6.77)#2,519 |
| 63. | Brownsdale | 11.8% | 5.1%(+6.67)#63 | 5.1%(+6.71)#2,538 |
| 64. | Mahtowa | 11.8% | 5.1%(+6.67)#64 | 5.1%(+6.71)#2,546 |
| 65. | Chisago City | 11.7% | 5.1%(+6.62)#65 | 5.1%(+6.67)#2,565 |
| 66. | Ortonville | 11.6% | 5.1%(+6.54)#66 | 5.1%(+6.58)#2,590 |
| 67. | Silver Lake | 11.5% | 5.1%(+6.44)#67 | 5.1%(+6.49)#2,628 |
| 68. | Brownton | 11.5% | 5.1%(+6.38)#68 | 5.1%(+6.42)#2,655 |
| 69. | Barnum | 11.4% | 5.1%(+6.33)#69 | 5.1%(+6.38)#2,676 |
| 70. | Campbell | 11.4% | 5.1%(+6.33)#70 | 5.1%(+6.38)#2,680 |
| 71. | Centerville | 11.3% | 5.1%(+6.22)#71 | 5.1%(+6.27)#2,715 |
| 72. | Sandstone | 11.2% | 5.1%(+6.13)#72 | 5.1%(+6.18)#2,744 |
| 73. | Grove City | 11.1% | 5.1%(+6.02)#73 | 5.1%(+6.06)#2,781 |
| 74. | Dunnell | 11.1% | 5.1%(+6.02)#74 | 5.1%(+6.06)#2,807 |
| 75. | Cuyuna | 11.1% | 5.1%(+6.02)#75 | 5.1%(+6.06)#2,808 |
| 76. | Kettle River | 11.1% | 5.1%(+6.02)#76 | 5.1%(+6.06)#2,824 |
| 77. | Miesville | 11.1% | 5.1%(+6.02)#77 | 5.1%(+6.06)#2,825 |
| 78. | Remer | 10.9% | 5.1%(+5.77)#78 | 5.1%(+5.82)#2,904 |
| 79. | Fairhaven | 10.9% | 5.1%(+5.77)#79 | 5.1%(+5.82)#2,908 |
| 80. | Amboy | 10.6% | 5.1%(+5.51)#80 | 5.1%(+5.55)#3,016 |
| 81. | Backus | 10.5% | 5.1%(+5.43)#81 | 5.1%(+5.48)#3,068 |
| 82. | Mendota | 10.4% | 5.1%(+5.32)#82 | 5.1%(+5.37)#3,128 |
| 83. | West Concord | 10.3% | 5.1%(+5.21)#83 | 5.1%(+5.26)#3,191 |
| 84. | Pennock | 10.0% | 5.1%(+4.90)#84 | 5.1%(+4.95)#3,366 |
| 85. | Cass Lake | 10.0% | 5.1%(+4.90)#85 | 5.1%(+4.95)#3,367 |
| 86. | Elrosa | 10.0% | 5.1%(+4.90)#86 | 5.1%(+4.95)#3,388 |
| 87. | Bock | 10.0% | 5.1%(+4.90)#87 | 5.1%(+4.95)#3,401 |
| 88. | Freeborn | 9.7% | 5.1%(+4.58)#88 | 5.1%(+4.63)#3,553 |
| 89. | Lake Shore | 9.6% | 5.1%(+4.54)#89 | 5.1%(+4.59)#3,569 |
| 90. | Esko | 9.5% | 5.1%(+4.39)#90 | 5.1%(+4.44)#3,666 |
| 91. | Audubon | 9.4% | 5.1%(+4.28)#91 | 5.1%(+4.32)#3,738 |
| 92. | Pine City | 9.3% | 5.1%(+4.22)#92 | 5.1%(+4.26)#3,783 |
| 93. | Cokato | 9.2% | 5.1%(+4.08)#93 | 5.1%(+4.13)#3,876 |
| 94. | Gary | 9.1% | 5.1%(+3.99)#94 | 5.1%(+4.04)#3,960 |
| 95. | Lindstrom | 8.9% | 5.1%(+3.84)#95 | 5.1%(+3.88)#4,071 |
| 96. | Willmar | 8.9% | 5.1%(+3.81)#96 | 5.1%(+3.86)#4,091 |
| 97. | Hamburg | 8.9% | 5.1%(+3.79)#97 | 5.1%(+3.84)#4,101 |
| 98. | Anoka | 8.9% | 5.1%(+3.77)#98 | 5.1%(+3.81)#4,115 |
| 99. | Courtland | 8.8% | 5.1%(+3.70)#99 | 5.1%(+3.74)#4,179 |
| 100. | Montrose | 8.7% | 5.1%(+3.61)#100 | 5.1%(+3.66)#4,236 |
Common Questions
What are the Top 10 Cities with the Highest Percentage of Population with a Degree in Psychology in Minnesota?
Top 10 Cities with the Highest Percentage of Population with a Degree in Psychology in Minnesota are:
#1
100.0%
#2
86.7%
#3
66.7%
#4
63.6%
#5
46.2%
#6
41.4%
#7
40.0%
#8
37.5%
#9
33.3%
#10
33.3%
What city has the Highest Percentage of Population with a Degree in Psychology in Minnesota?
Quamba has the Highest Percentage of Population with a Degree in Psychology in Minnesota with 100.0%.
What is the Percentage of Population with a Degree in Psychology in the State of Minnesota?
Percentage of Population with a Degree in Psychology in Minnesota is 5.1%.
What is the Percentage of Population with a Degree in Psychology in the United States?
Percentage of Population with a Degree in Psychology in the United States is 5.1%.